Article Summary
- This article provides a comprehensive explanation of Shooting Star candlestick patterns in the context of cryptocurrency trading.
- It breaks down the visual characteristics of Shooting Star patterns and the market psychology behind their formation.
- The guide explores how Shooting Star patterns signal potential bearish reversals and what conditions make them most reliable.
- It highlights practical applications for traders, including how to use Shooting Star patterns in conjunction with support and resistance levels.
- The article concludes with actionable advice for integrating Shooting Star pattern recognition into a broader trading strategy.
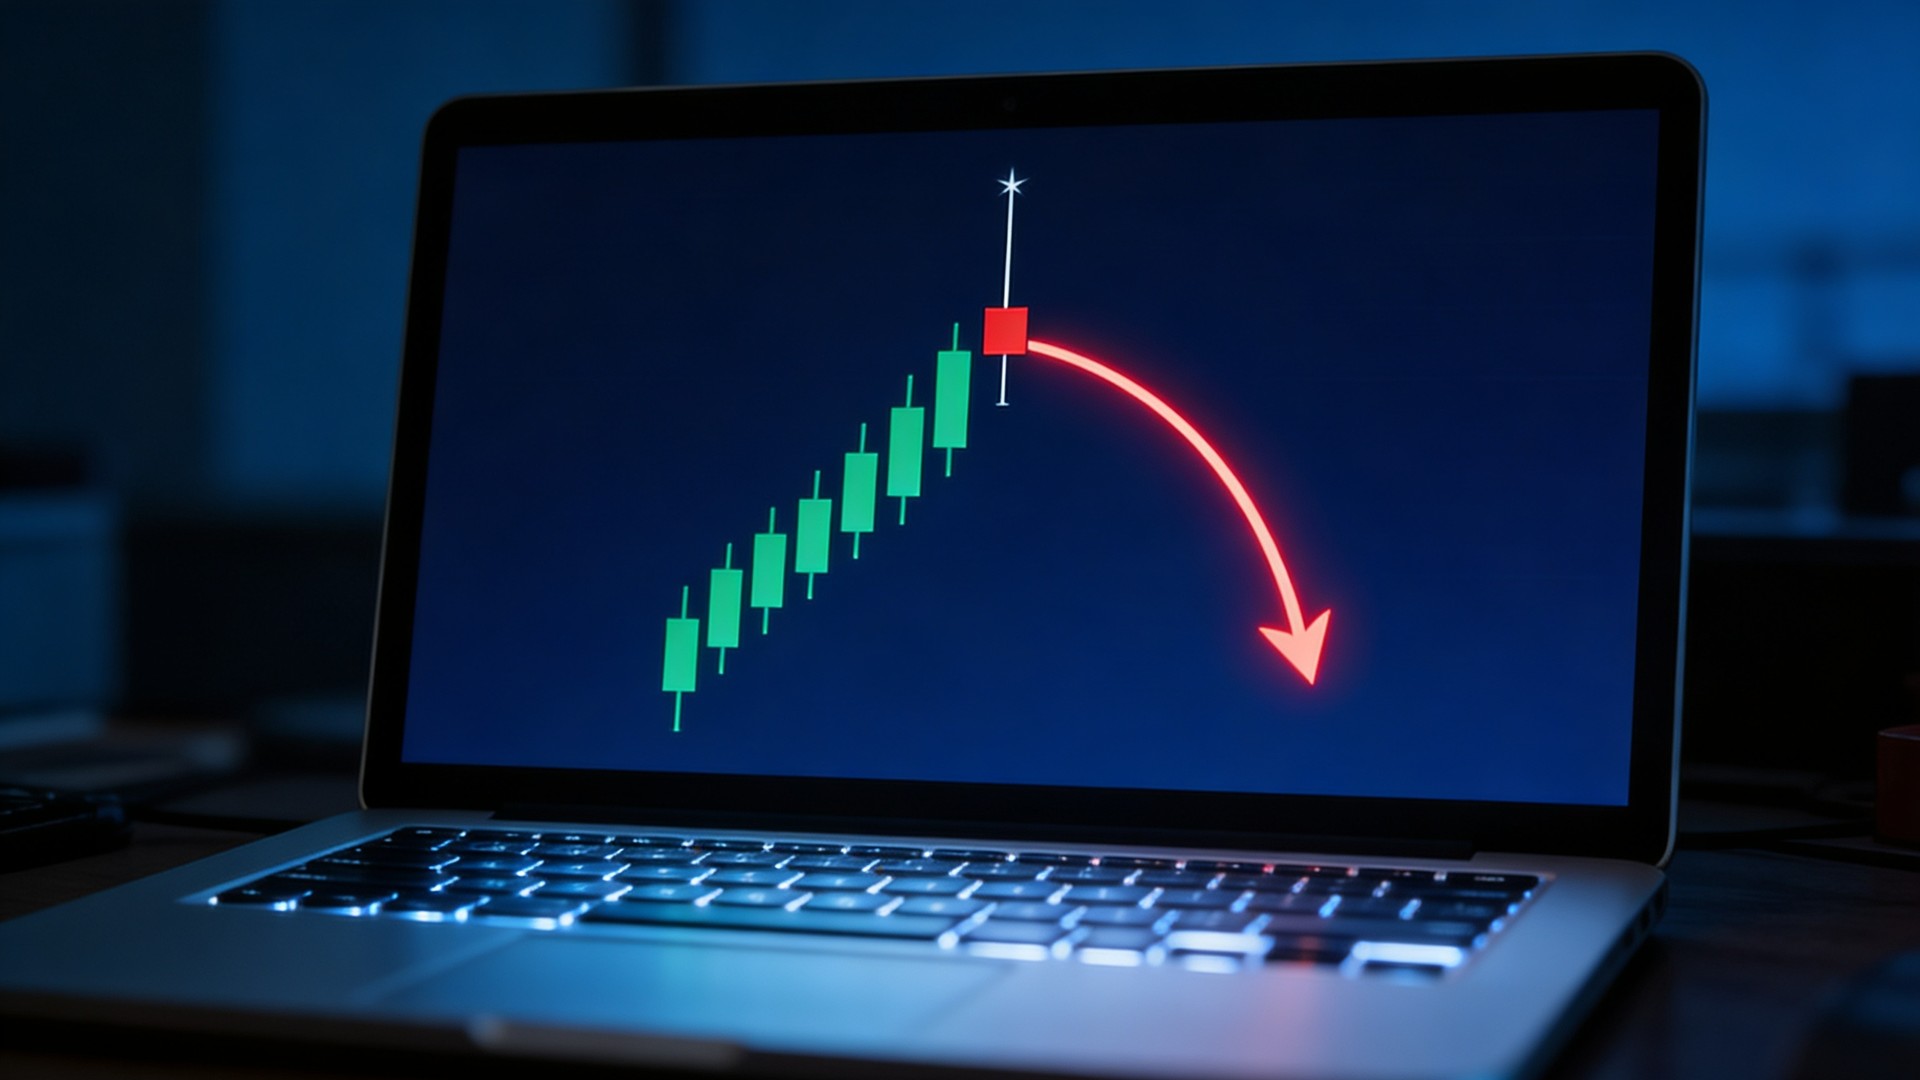
- When bulls push the price higher but ultimately fail to hold those gains, the Shooting Star candlestick pattern emerges, being one of the clearest bearish reversal signals in technical analysis. But how do you identify it, and more importantly, how do you trade it?
- A Shooting Star candlestick has a small body near the bottom of the candle, a long upper wick, and little to no lower wick. It shows that buyers pushed the price up during the session, but sellers stepped in and forced the close back near the opening price.
- For crypto traders, this pattern is useful because crypto markets move fast, trade 24/7, and
- often react sharply around resistance zones. Many traders study this setup on charting tools before placing an order on a crypto exchange such as Bitunix, where candlestick charts help them track price action in real time.
- This guide breaks down the anatomy of Shooting Star candlesticks, the conditions that make them reliable, and practical ways to use them in crypto trading.
Understanding the Mechanics of Shooting Star Candlesticks
A Shooting Star pattern can carry a lot of information in one candle. It shows that buyers pushed price higher during the session, but sellers forced it back near the open before the close. That failed move is what gives the pattern its bearish meaning.
Investopedia describes a Shooting Star as a bearish candlestick with a small real body near the lower end, a long upper shadow, and little or no lower shadow, which matches the idea of rejected upside momentum. The pattern after a strong rally or near resistance gives traders a signal worth checking with volume, trend context, and the next candle.
1. Visual Characteristics
When traders ask what is a shooting star candlestick, the answer starts with its shape. The body sits near the bottom of the candle, the upper wick extends far above it, and the lower wick is tiny or missing.
In most technical analysis guides, the upper wick should be at least twice the size of the real body. That ratio shows that the price moved much higher during the session but could not hold. The final close near the open shows that buyers lost control before the candle closed. Investopedia also highlights that the pattern is stronger when it appears after an uptrend, near a recent high, and with a very short lower shadow.
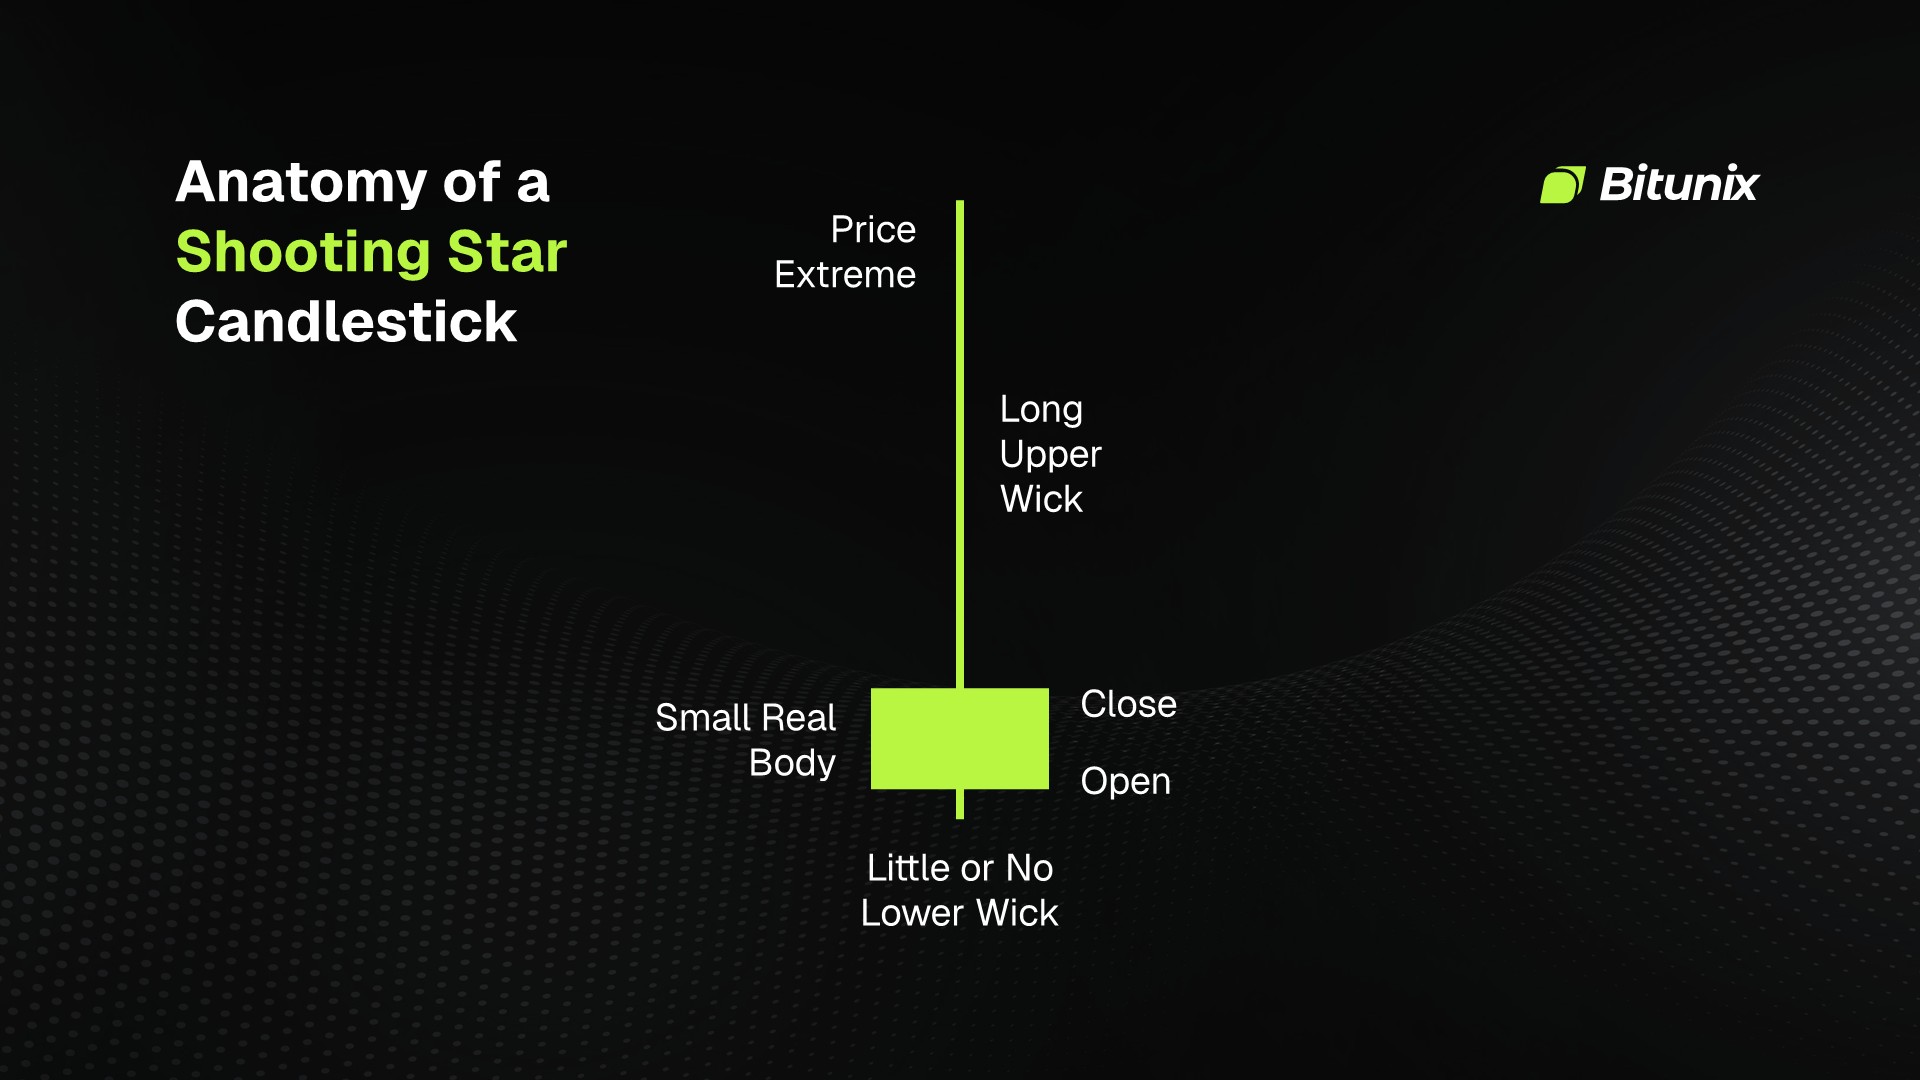
A Shooting Star candlestick shows failed upward momentum, with buyers pushing price higher before sellers force it back near the open.
2. Market Psychology
The Shooting Star is a buyer exhaustion signal. During the candle, bulls push the price upward; new buyers often enter because the chart looks strong. Then sellers appear near the top, absorb buying pressure, push the price down, and make the candle close near the opening level.
The candle creates a visual record of rejection. Buyers pushed the price higher, but sellers took over before the close. In crypto, this often happens after a token rises quickly, especially near round-number resistance, previous highs, or crowded leverage zones. A candle that looks strong halfway through the session can become a warning sign by the close, which is why traders wait for the candle to finish before judging a Shooting Star.
3. Formation Process
A Shooting Star forms in three steps. First, the session opens, and buyers gain control. Then the price rises far above the open, creating the long upper wick. Finally, sellers push the price back down so the candle closes near the open, or sometimes below it.
The closing price gives the candle its meaning because a long upper wick with a strong close near the high does not send the same bearish warning. The signal comes from failure: price moved higher during the session, tested an upper level, and then closed back down after sellers rejected the move.
Conditions That Make Shooting Stars Reliable
A Shooting Star becomes more useful when the surrounding chart supports the signal. The candle can flag a possible reversal, while confirmation shows whether the setup is strong enough to trade. Crypto traders need that extra evidence because the modern market structure is more complex than simple spot buying and selling.
In 2025, CME recorded an average daily volume of 278,000 contracts, equal to about $12 billion in notional value, underscoring how much institutional futures activity now underlies crypto price moves. That makes context more important when reading bearish signals, because a single candle can reflect hedging, leverage, arbitrage, and short-term speculation at the same time.
The most reliable Shooting Stars usually share these features:
- They appear after a sustained uptrend or a sharp rally.
- They form at or near resistance.
- They come with higher-than-usual volume.
- They follow extended price action, not random sideways movement.
- They receive confirmation from the next candle.
The candle's location should be your first filter. A Shooting Star after a strong move upward tells you buyers are starting to lose control near the top. The same candle in the middle of a sideways range is weaker because there is no clear trend to reverse.
Resistance adds weight to the pattern because it shows sellers defended a known price area. When a Shooting Star forms near a previous high, a round-number level, or a Fibonacci zone, the rejection becomes easier to interpret. Price tried to break higher, reached an area where sellers were already expected, and failed to close above it.
Volume can separate a weak warning from a stronger reversal signal. Higher volume during the Shooting Star indicates that more traders participated in the rejection. In November 2025, CME's cryptocurrency complex reached a record 424,000 contracts in average daily volume, equal to $13.2 billion in notional value, which highlights how heavy participation can shape crypto reactions around key levels.
For crypto specifically, check these before acting:
- Is Bitcoin trending up, down, or sideways?
- Is the token moving with the broader market or against it?
- Did the candle form near a previous high, Fibonacci level, or moving average?
- Did volume rise during rejection?
- Did the next candle close below the Shooting Star low?
The final confirmation often decides whether the setup deserves a trade. A Shooting Star at resistance can warn you that momentum is weakening, but the next candle needs to support that idea. When the price closes below the Shooting Star low, sellers have followed through. Without that follow-through, the pattern remains a warning.
Practical Trading Applications and Strategies
Shooting Stars help traders plan, but they do not remove uncertainty. The goal is to use them as part of a process that includes trend analysis, entry rules, confirmation, and risk management.
1. Identifying Trend Reversals
A Shooting Star can help you spot a potential change from an uptrend to a downtrend. The candle warns that buyers failed to hold the high, but it does not prove a full trend change.
A practical approach is to look for higher highs and higher lows, then check whether the Shooting Star appears near a resistance zone. After that, wait for the next candle to confirm weakness.
A stronger setup includes price rallies over several candles, reaching a known resistance level, printing a Shooting Star with high volume, and then the next candle closing below the Shooting Star low. That sequence gives you structure, rejection, and confirmation.
2. Entry and Exit Points
For short positions, many traders wait for the price to break below the Shooting Star low. A more cautious trader waits for a full candle close below that low. For long positions, the pattern can be an exit warning. If you are already in profit and a Shooting Star appears at resistance, you can reduce exposure, tighten your stop, or wait for confirmation before exiting.
3. Combining with Other Indicators
Shooting Stars work better when you pair them with tools that confirm trend, momentum, and reaction zones. Moving averages help you read the broader trend direction, RSI can highlight overbought conditions or bearish divergence, and Fibonacci levels can mark areas where price often reacts after a rally.
For example, a Shooting Star at the 61.8% Fibonacci retracement after a weak bounce carries more weight than the same candle in empty chart space. A Shooting Star above the upper Bollinger Band, followed by a close back inside the band, can also show overextension. RSI above 70 adds another clue, especially when price makes a higher high but RSI makes a lower high.
Bitunix added TradingView chart integration in 2025, including real-time K-line updates, price and volume data, multiple candlestick intervals, and compatibility with indicators such as RSI, MACD, and Bollinger Bands. That kind of setup helps traders compare a candle signal with broader technical evidence before acting.
4. Risk Management
A clean Shooting Star trade needs a clear invalidation point, which is usually placed above the upper wick. If price breaks above that high, the rejection has failed because sellers no longer defend the level. That is why risk should come before entry: decide how much of your account you can afford to lose, then size the position based on the distance between your entry and stop.
This step matters even more in crypto, where wicks can move fast, and slippage can turn a good setup into a weak trade. Limit orders can help with volatile candles, but they still need caution, and when leverage is involved, even a small mistake can become much more expensive.
Limitations and Considerations
The Shooting Star is useful as a warning sign, but traders should not treat it as an automatic reversal signal. It points to possible buyer exhaustion, yet the price can still move higher when the broader trend is strong, short sellers get squeezed, or market-moving news brings fresh demand.
Bitcoin's May 2026 price action gives a good example of why context matters. On May 6, 2026, BTC traded in an $81,250 to $82,320 range and reached its strongest level since late January, while still sitting about 30% below its late-2025 all-time high. A Shooting Star near resistance in that environment would need confirmation because the market was recovering, but not yet in a confirmed new bullish regime.
The timeframe you choose also changes how much weight the signal carries. Daily and weekly Shooting Stars usually matter more than 1-minute or 5-minute candles because longer candles capture broader market behavior. Shorter timeframes can help with entries, but they also produce more noise and more false signals.
False signals happen often in crypto because price can reject a level, dip for one candle, and then recover as buyers step back in. This is common when funding, liquidations, or market news drive short-term price action. In 2026, centralized exchange volume also cooled from its October 2025 peak, dropping from more than $8 trillion to $4.3 trillion, which means lower or shifting liquidity can make candles less reliable, especially on smaller altcoins.
The broader market context should be your final filter before acting on the pattern. Check Bitcoin dominance, macro news, token-specific catalysts, and whether the asset has enough liquidity. Bearish signals work best when they align with the market environment, while signals that go against a strong market need extra confirmation.
Conclusion: Mastering Shooting Star Recognition
Shooting Star candlesticks represent critical bearish rejection points, and recognizing them is a valuable skill for any trader. The pattern shows that buyers pushed the price higher, but sellers forced it back down before the close.
A Shooting Star works best after an uptrend, at resistance, with strong volume, and with bearish confirmation. When you combine the pattern with risk management and other technical tools, you can identify potential reversals with more discipline instead of trying to guess every market top.
Ready to improve your technical analysis skills? Create an account on Bitunix to access charting tools and practice identifying Shooting Star patterns in real time. Trade only when the setup, confirmation, and risk plan make sense.
FAQ Section
What exactly is a Shooting Star candlestick?
A Shooting Star candlestick is a bearish reversal pattern that forms when the price rises during a trading period but closes near the opening level. It has a small real body near the bottom, a long upper wick, and little or no lower wick, showing that sellers rejected higher prices before the candle closed.
How do I identify a Shooting Star pattern on a chart?
You can identify a Shooting Star by looking for a candle with a long upper wick and a small body near the bottom, with the wick clearly longer than the body. The pattern is more useful when it appears after an uptrend or near resistance, where it can signal that buyers tried to push higher but lost control before the close.
What does a Shooting Star signal mean about market sentiment?
A Shooting Star signals that bullish momentum is weakening because buyers pushed the price higher but failed to hold those gains. Sellers took control before the close, which could signal buyer exhaustion and a possible shift toward bearish sentiment.
Where do Shooting Stars typically appear in a trend?
Shooting Stars usually appear near the top of an uptrend, close to a swing high, or around a resistance level. Their meaning is stronger in those areas because the candle shows rejection after buyers have already pushed the price upward.
How reliable are Shooting Stars as reversal signals?
Shooting Stars become more reliable when they appear after an uptrend, form near resistance, and receive confirmation from the next bearish candle. Volume and other technical indicators can also strengthen the signal, since the pattern alone does not guarantee a reversal.
Should I trade every Shooting Star I see?
You should not trade every Shooting Star because many of them appear during noisy or low-quality market conditions. Wait for confirmation, check support and resistance, review volume, and make sure the broader market does not contradict the bearish signal.
What is the difference between a Shooting Star and a Hammer?
A Shooting Star and a Hammer can look similar, but their locations change their meanings. A Shooting Star appears after an uptrend and signals a possible downside reversal, while a Hammer appears after a downtrend and signals a possible upside reversal.
How should I set my stop loss when trading a Shooting Star?
A common stop-loss placement sits above the upper wick of the Shooting Star because that level marks the failed high. If price breaks above it, sellers no longer defend the rejection zone, and the trade idea loses strength.
What other indicators should I use with Shooting Star patterns?
Shooting Star patterns work better when you combine them with tools that confirm trend, momentum, and key price levels. Moving averages help define trend direction, RSI can show overbought conditions or bearish divergence, and Fibonacci levels can highlight possible reaction zones after a rally.
Where can I practice identifying Shooting Star patterns?
You can practice identifying Shooting Star patterns on live or historical candlestick charts using platforms that offer multiple timeframes, technical indicators, and crypto trading pairs. Bitunix provides charting tools that let you review market structure and test pattern recognition in real time.
Glossary
- Shooting Star Candlestick: A bearish candlestick with a small lower body, long upper wick, and little or no lower wick.
- Shooting Star Pattern: A single-candle setup that signals possible rejection after an upward price move.
- Candlestick: A chart unit showing open, high, low, and close prices for a chosen period.
- Real Body: The filled or hollow section of a candle between the open and closing prices.
- Upper Wick: The line above the candle body showing the highest price reached during the period.
- Lower Wick: The line below the candle body shows the lowest price reached during the period.
- Resistance: A price area where selling pressure often slows or rejects upward movement.
- Support: A price area where buying pressure often slows or rejects downward movement.
- Bearish Signals: Chart clues that suggest sellers are gaining control or the price may move lower.
- Candlestick Reversal: A candle pattern that warns the current trend may be losing strength.
- Technical Analysis: The study of charts, price action, volume, and indicators to evaluate market behavior.
- Volume: The amount of an asset traded during a specific period.
- RSI: A momentum indicator that helps traders identify overbought or oversold conditions.
- Fibonacci Retracement: A charting tool used to identify possible support and resistance levels after a move.
- Stop Loss: An order or planned exit level used to limit losses when a trade moves against you.
Disclaimer
This article does not provide:
(i) investment advice or investment recommendations;
(ii) an offer or solicitation to buy, sell, or hold digital assets;
(iii) financial, accounting, legal, or tax advice.
Digital assets, including stablecoins and NFTs, involve high risk and may fluctuate significantly. Consider whether trading or holding digital assets is appropriate for you given your financial situation. Consult a qualified legal, tax, or investment professional when needed. You are responsible for understanding and complying with applicable local laws and regulations.
About Bitunix
Bitunix is a global cryptocurrency derivatives exchange trusted by over 3 million users across more than 100 countries. At Bitunix, we are committed to providing a transparent, compliant, and secure trading environment for every user. Our platform features a fast registration process and a user-friendly verification system supported by mandatory KYC to ensure safety and compliance. With global standards of protection through Proof of Reserves (POR) and the Bitunix Care Fund, we prioritize user trust and fund security. The K-Line Ultra chart system delivers a seamless trading experience for both beginners and advanced traders, while leverage of up to 200x and deep liquidity make Bitunix one of the most dynamic platforms in the market.
Bitunix Global Accounts
X | Telegram Announcements | Telegram Global | CoinMarketCap | Instagram | Facebook | LinkedIn | Reddit | Medium