
In cryptocurrency futures trading, prices can fluctuate sharply, and the battle between bulls and bears is often intense. Accurately identifying bottom reversal patterns is essential for capturing bottom-fishing opportunities while managing risk. As a classic bottom reversal formation, the W bottom can be seen as a valuable tool for bottom-fishing in futures trading. This article provides a comprehensive analysis of how to trade the W bottom pattern in futures markets, covering its basic definition, application rules, practical examples, and risk considerations, to help traders avoid false breakouts and identify more reliable market opportunities.
I. What is the "W" bottom pattern and what does it look like?
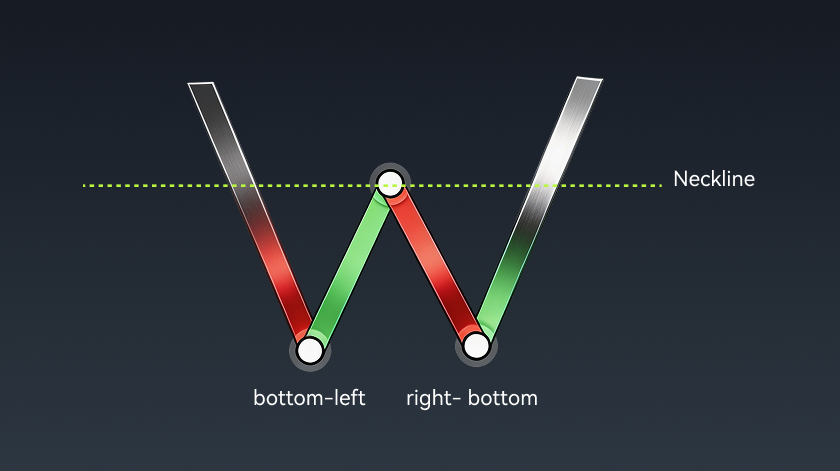
The W bottom pattern, also known as the double bottom pattern, is a common bottom reversal formation in technical analysis. It is named after the way the price trend resembles the English letter "W" on a candlestick chart. It typically appears at the end of a downtrend and is considered one of the key signals that bearish momentum is weakening, bullish strength is emerging, and a market bottom may be forming.
1. Core Structural Components
- Left bottom: After a prolonged and steep price decline, selling pressure gradually weakens. The price stabilizes at a certain low level and forms the first bottom. At this stage, trading volume usually contracts, indicating that short-term bearish momentum has been released.
- Neckline level: After the left bottom forms, bullish momentum begins to build and the price rebounds. The high point of this rebound is known as the neckline, which serves as the boundary between bullish and bearish forces in the W-bottom pattern and is the key level for judging whether the pattern has been established.
- Right bottom: After rebounding to the neckline, the price comes under short-term profit-taking pressure and declines again. However, the low point of this decline is generally similar to the left bottom, or even slightly higher than it, while trading volume is lower than during the formation of the left bottom. This indicates that bears are no longer able to push the price to a new low, and that market selling pressure has been largely exhausted.
- Breakout and rally:After the right bottom stabilizes, bullish momentum strengthens again and the price rises once more. When it breaks above the neckline with increased volume and holds firmly above it, the W-bottom pattern is officially confirmed. This is often followed by an upward move in the market, creating a potential long opportunity in futures trading.
2. Core Technical Features
- The pattern must appear at the end of a downtrend. The more obvious the downtrend, the more reliable the reversal signal.
- The price difference between the lows of the left and right bottoms should not exceed 3%, and a right bottom that is slightly higher than the left bottom indicates a stronger pattern.
- There should be a sufficient time interval between the two bottoms. On the daily chart, a gap of at least 10 candlesticks is recommended to avoid short-term fluctuations creating a false pattern.
- A breakout above the neckline must be accompanied by a clear increase in trading volume, significantly higher than the previous average volume, in order to confirm the validity of the breakout.
II. Rules for Applying the W-Bottom Pattern in Futures Trading
Crypto futures trading involves leverage, and the risks are much higher than in spot trading. Therefore, the W-bottom pattern must be used with strict discipline. Traders should avoid blind entries and carefully balance profit potential with risk control at every step of the process.
1. Pattern Validity Confirmation Rules
- Avoid a false W bottom: The right bottom must not fall below the low point of the left bottom. Once it breaks below that level, the pattern becomes invalid, and traders should not go long against the trend.
- Neckline breakout standard: The closing price must hold firmly above the neckline in order to avoid false breakouts caused by intraday shadows.
- Multi-timeframe verification: Identify the W-bottom pattern on the daily chart, confirm the validity of the breakout on the 4-hour chart, and use the 15-minute chart to find a precise entry point. Combining larger and smaller timeframes can improve signal accuracy.
2.Anticipating Price Movement: Using the Neckline as the Core Reference
The core function of the neckline is to divide bullish and bearish territory.
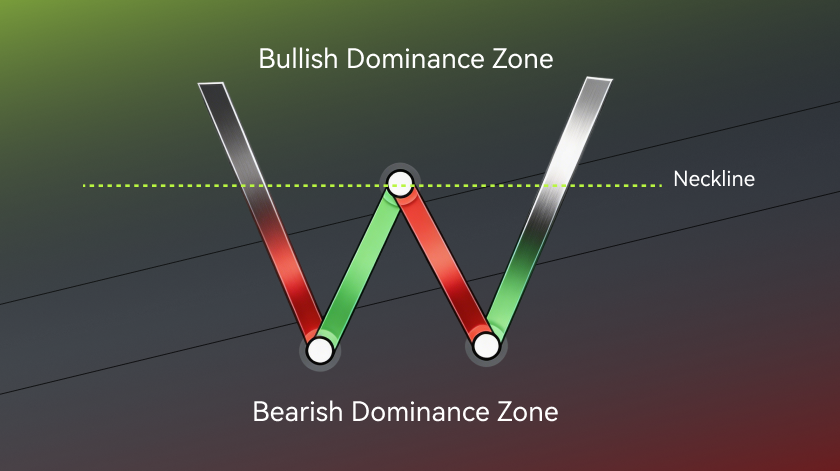
- Above the neckline: This is the bullish advantage area. At this stage, bullish market forces are dominant, so traders should favor long positions rather than short selling.
- Below the neckline: This is the bearish advantage area. At this stage, bearish market forces are dominant, so traders should favor short positions rather than buying at higher prices.
The success or failure of the W pattern is also determined by whether the price breaks through the neckline.
- Successful pattern: If investors continue to enter the market and buying pressure remains stronger than selling pressure, the price will break above the neckline decisively, forming a breakout and upward trend. At that point, the W-bottom pattern is officially established. After the breakout, confidence among bullish traders will increase, encouraging more market participants to buy and further pushing the price higher.
- Pattern failure: If the price continues to trade below the neckline, the neckline becomes a resistance level. At this point, active buying interest near the neckline is significantly weaker than selling pressure, preventing the price from breaking through resistance. The price then continues to decline with the trend. In this case, the W-bottom pattern fails and does not form a valid bottom.
3. Timing for Entering a Long Futures Position (Two Strategies)
Conservative entry (suitable for beginners and low-leverage traders)
- After the price breaks above the neckline on high volume, it pulls back to the neckline and stabilizes, while trading volume contracts during the retracement. At this point, traders can enter a long position. This entry is relatively safe and can effectively reduce the risk of a false breakout, making it the preferred entry point in futures trading.
- At this stage, it is recommended to use Bitunix’s price alert function. When the price breaks above the neckline, traders can participate in long positions more effectively and capture trend-following opportunities more accurately.
Aggressive entry (suitable for experienced traders with strong leverage and risk-control skills)
- The price breaks directly above the neckline on high volume, closes with a large bullish candlestick, and holds firmly above the neckline. Traders can then enter a long position immediately with a light position. This approach allows traders to capture the early stage of the upward move, but it also involves the risk of a pullback after the breakout, so a strict stop loss must be set.
- At this stage, it is also recommended to use Bitunix’s price alert function 。When the price breaks above the neckline, traders can participate in long positions promptly and capture trend-following opportunities more accurately.
4. Stop-Loss Rules
In futures trading, stop loss is essential, and the stop loss for the W-bottom pattern must be set precisely.
- Conservative strategy: Place the stop loss 3% to 5% below the neckline. If the price falls back below the neckline, exit immediately with a stop loss.
- Aggressive strategy: Place the stop loss 3% to 5% below the low point of the right bottom. Once the pattern becomes completely invalid, exit decisively to avoid amplified losses caused by leverage.
5. Take-Profit Target Rules
A laddered take-profit approach can be used to adapt to swing trading in futures.
- First take-profit target: Measure the vertical distance from the neckline to the low point of the left bottom, then project the same distance upward from the neckline.
- Second take-profit target: Set the target at one additional multiple of the first take-profit level, which is suitable for strong market trends and large-scale W-bottom patterns.
- Dynamic take profit: If the market continues to rise on high volume, traders can continue holding the position by following the 5-day moving average, and then take profit and exit once the price falls below the 5-day moving average.
6. Leverage Rules
- Conservative trading: Leverage should not exceed 10x. Position sizing should be strictly controlled, and any single position should not exceed 10% of total capital.
- Aggressive trading: Leverage should not exceed 20x, and any single position should not exceed 10% of total capital. Full-position trading and heavily leveraged positions are strictly prohibited.
III. Practical Examples
1.BTC/USDT Perpetual Futures (Daily Timeframe) ✅
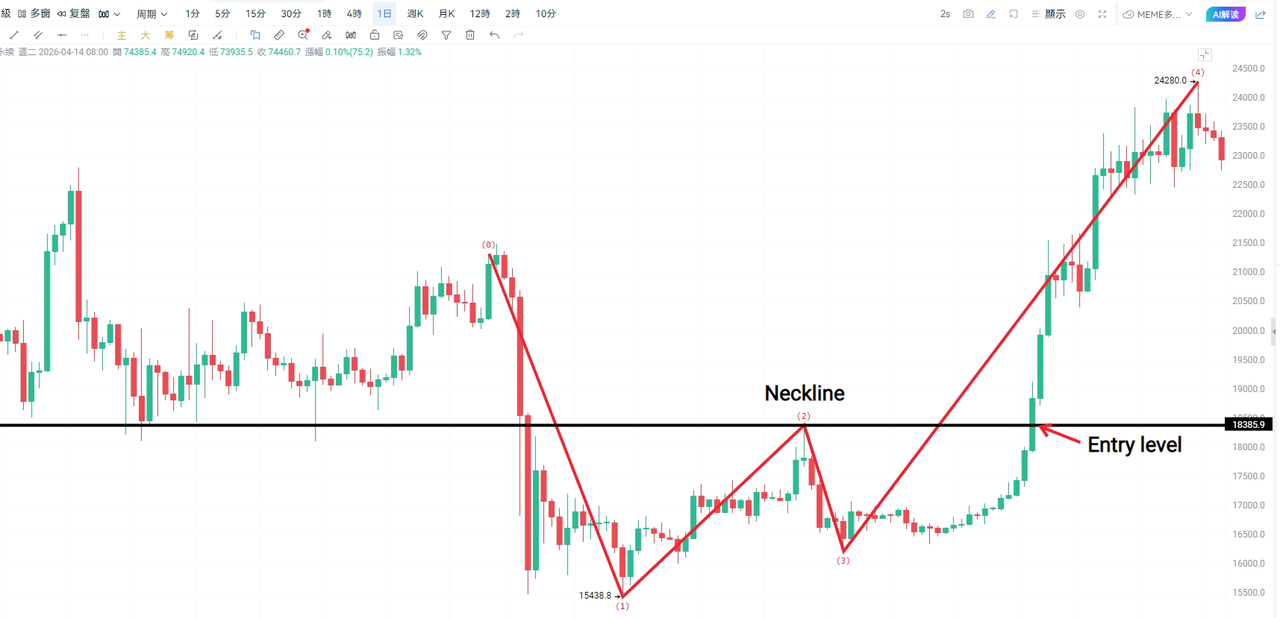
Based on the BTC trend shown in the chart, the complete W-bottom trading process is as follows:
1. Pattern confirmation: After a sharp price decline, the market formed the left bottom ① (15438.8), rebounded to the neckline ②, and then pulled back. The right bottom ③ did not fall below the left bottom, confirming the W-bottom structure.
2. Entry timing: The price breaks above the neckline on strong volume and stabilizes after a pullback (marked as the "position" in the chart). At this point, a long position can be opened to reduce the risk of a false breakout.
3. Take profit and stop loss: According to the previous rules, the stop loss is set 3% to 5% below the neckline. The first take-profit target is projected by taking the distance between the neckline and the left bottom and measuring the same distance upward from the neckline. After that, traders can use the 5-day moving average for dynamic take-profit management.
4. Market validation: After the breakout, the price continued to rise and eventually reached 24280, fully validating the bullish move implied by the W-bottom pattern.
2.ETH/USDT Perpetual Futures (Daily Timeframe) ✅
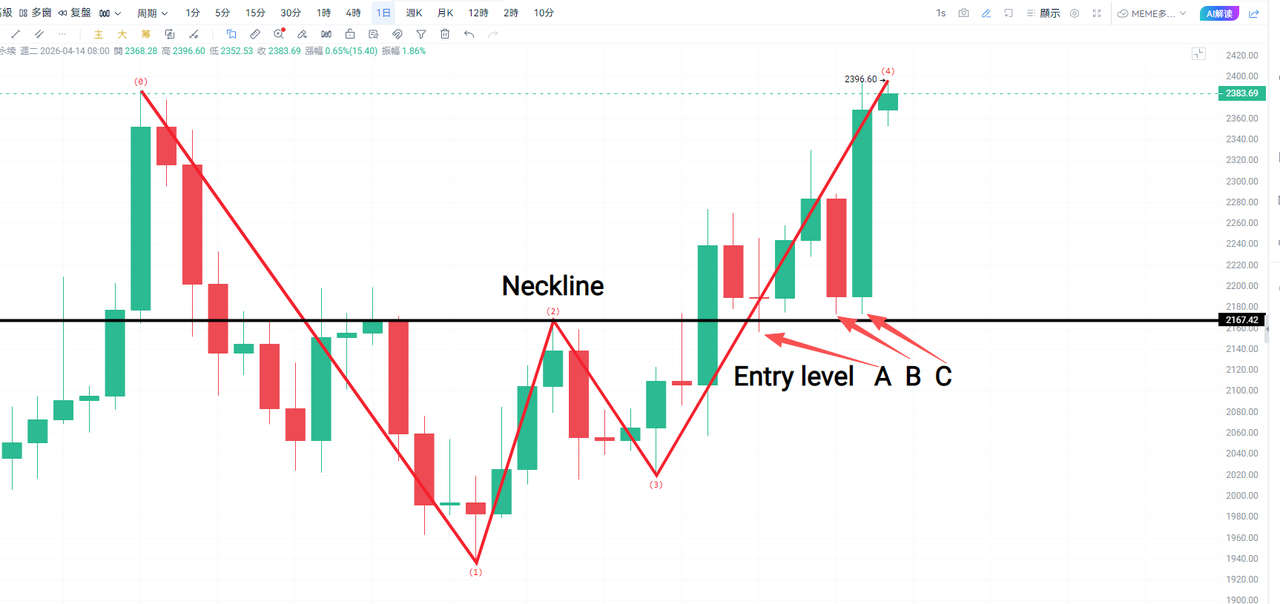
Based on the ETH trend shown in the chart, the complete W-bottom trading process is as follows:
1. Pattern confirmation: After a sharp decline, the market formed the left bottom ① (1936.00), rebounded to the neckline ②, and then pulled back again. The right bottom ③ did not fall below the left bottom, confirming the W-bottom structure.
2. Entry timing: The price breaks above the neckline on high volume and stabilizes after a pullback (marked as "position A/B/C" in the chart). At this point, a long position can be opened to reduce the risk of a false breakout.
3. Take profit and stop loss: According to the previous rules, the stop loss is set 3% to 5% below the neckline. The first take-profit target is projected by taking the distance between the neckline and the left bottom and measuring the same distance upward from the neckline. After that, traders can rely on the 5-day moving average for dynamic take-profit management.
4. Market validation: After the breakout, the price continued to rise, with the current price reaching a high of 2396.60. Further upside may still be possible, and the bullish logic of the W-bottom pattern has been clearly validated.
3.RIVER/USDT Perpetual Futures (4-Hour Timeframe) ❌
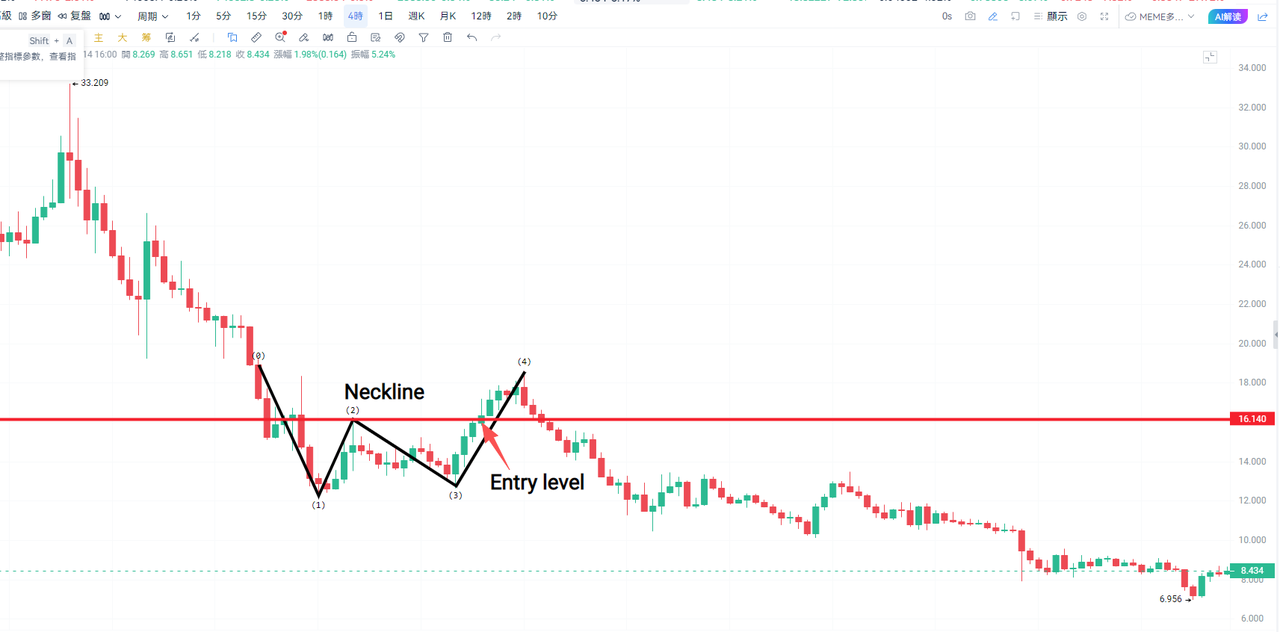
Based on the 4-hour chart trend, the trading process followed the same W-bottom logic as ETH, but ultimately failed completely:
1. Pattern confirmation: After falling sharply from its historical high of 33.209, the price formed a 4-hour left bottom ① at around 11.5, rebounded to the neckline ② at 16.14, and then pulled back again. The right bottom ③ did not fall below the left bottom. Structurally, this fully matched the classic characteristics of a W bottom and met the conditions for a reversal pattern.
2. Entry timing: Under standard W-bottom trading logic, after the price breaks above the 16.14 neckline, a long position is opened at the "position" marked in the chart, strictly following the standard rule of entering long after a breakout and stabilization.
3. Take profit and stop loss (standard risk-control execution): According to the previous rules, the stop loss is set 3% to 5% below the 16.14 neckline, which is approximately in the 15.0 to 15.3 range. The first take-profit target is projected by taking the distance from the neckline to the left bottom and measuring the same distance upward, giving a target of about 20.78.
4. Market validation (complete failure): The price only rose briefly to point ④, around 18, before turning downward. It quickly fell back below the 16.14 neckline, completely losing pattern support, and eventually dropped all the way to a new low of 7. The bullish logic of the W-bottom pattern failed entirely, making this a typical case where the pattern was valid, the trade followed the rules, but the market reversed anyway.
5. Key reason for failure: RIVER’s 4-hour W bottom was a case of a false breakout combined with persistent bearish dominance. The breakout lacked sufficient volume, the price quickly broke down after the pullback, and within the broader long-term downtrend, the rebound was only a temporary pause in the decline. This ultimately led to the failure of the pattern.
Disclaimer
This article is not intended to provide
(I) investment advice or investment recommendations;
(Ii) an offer or solicitation to buy, sell or hold digital assets;
(Iii) Financial, accounting, legal or tax advice. Digital assets held (including stablecoins and NFTs) involve a high level of risk and may fluctuate significantly. You should carefully consider whether trading or holding digital assets is appropriate for you based on your financial situation. Please consult your legal/tax/investment professional for your specific situation. Please be responsible for understanding and complying with relevant local applicable laws and regulations.
About Bitunix
Bitunix is a global cryptocurrency derivatives exchange trusted by over 3 million users from over 100 countries. Bitunix is committed to providing a transparent, compliance and secure trading environment for every user. The platform has a fast registration process and friendly verification system, and enforces KYC to ensure security and compliance.
Through global-level protection standards such as Proof of Reserve (PoR) and Bitunix Care Fund, Bitunix puts user trust and money security first.The K-Line Ultra charting system provides a seamless trading experience for both novice and advanced traders, with up to 200 times leverage and deep liquidity, making Bitunix one of the most dynamic platforms in the market.
Bitunix Global Account
X | Telegram Announcements | Telegram Global | CoinMarketCap | Instagram | Facebook | LinkedIn | Reddit | Medium