Article Summary
- This article provides a comprehensive explanation of trading signals in the context of cryptocurrency trading.
- It breaks down what trading signals are, how they are generated, and the different types of signals available to traders.
- The guide explores how to evaluate the reliability of trading signals and how to avoid false signals.
- It highlights practical applications for traders, including how to use signals in conjunction with other technical tools and risk management.
- The article concludes with actionable advice for incorporating trading signals into a comprehensive trading strategy.
Every day, the cryptocurrency market produces more trading opportunities than one person can track. Prices move across hundreds of assets, news shifts sentiment, and technical setups appear across different timeframes simultaneously. Trading signals help traders filter that information by turning market data into clearer entry, exit, or warning points.
A trading signal is a trigger that suggests a potential trade action. It can come from technical analysis, price action, volume, news, or on-chain data. Some signals show that momentum is improving, while others warn that a trend is losing strength.
Crypto traders often rely on signals because the market runs nonstop, and no one can watch every chart, alert, and price move at once. On a crypto exchange like Bitunix, those signals become more useful when traders connect them with chart analysis, alerts, planned orders, and clear risk limits, rather than treating them as automatic trade instructions.
This guide explains what trading signals are, how different signal types work, and how to use them inside a structured trading strategy. It also covers the main limits of signals, because no alert, indicator, or pattern can remove risk from trading.
What Is a Trading Signal?
When traders ask what is a trading signal, they are usually asking how market information becomes a practical decision point. A trading signal is a market trigger that tells you to consider entering, exiting, reducing, or avoiding a trade based on a specific condition.
These signals are designed to help traders spot potential opportunities without staring at charts all day. A signal can alert you when Bitcoin breaks above resistance, when RSI enters an oversold zone, when volume rises sharply, or when a major news event changes market sentiment.
Most trading signals are generated through technical indicators, price action, volume changes, fundamental events, or on-chain activity. Technical indicators such as moving averages, RSI, and MACD use price data to show trend, momentum, or possible exhaustion.
Price action signals come from chart structure, including support and resistance breaks, trend line breaks, and candlestick patterns.
Buy signals and sell signals are the two most common categories traders use. Buy signals suggest that conditions support a possible long entry, while sell signals suggest that it may be time to exit a long position or consider a short setup. In crypto futures, the same signal can mean different things depending on whether you trade spot, go long, go short, or manage an existing position.
Signal reliability depends on market conditions, timeframe, confirmation, and execution. A moving average crossover during a strong trend can be useful, but the same crossover inside a choppy range can produce repeated false entries.
Recent market activity shows why signal quality changes over time. In Q3 2025, CoinGecko reported that the top centralized exchanges recorded $5.1 trillion in spot trading volume, up 31.6% from Q2's $3.9 trillion, although still slightly below Q1's $5.4 trillion. That type of shift changes how traders should read breakouts, volume spikes, and momentum signals.
Types of Trading Signals
Different signal types tell you different things about the market, so traders should avoid treating every alert as equal. A strong trading strategy usually combines multiple types of signals because no single indicator can capture trend, momentum, liquidity, and sentiment simultaneously.
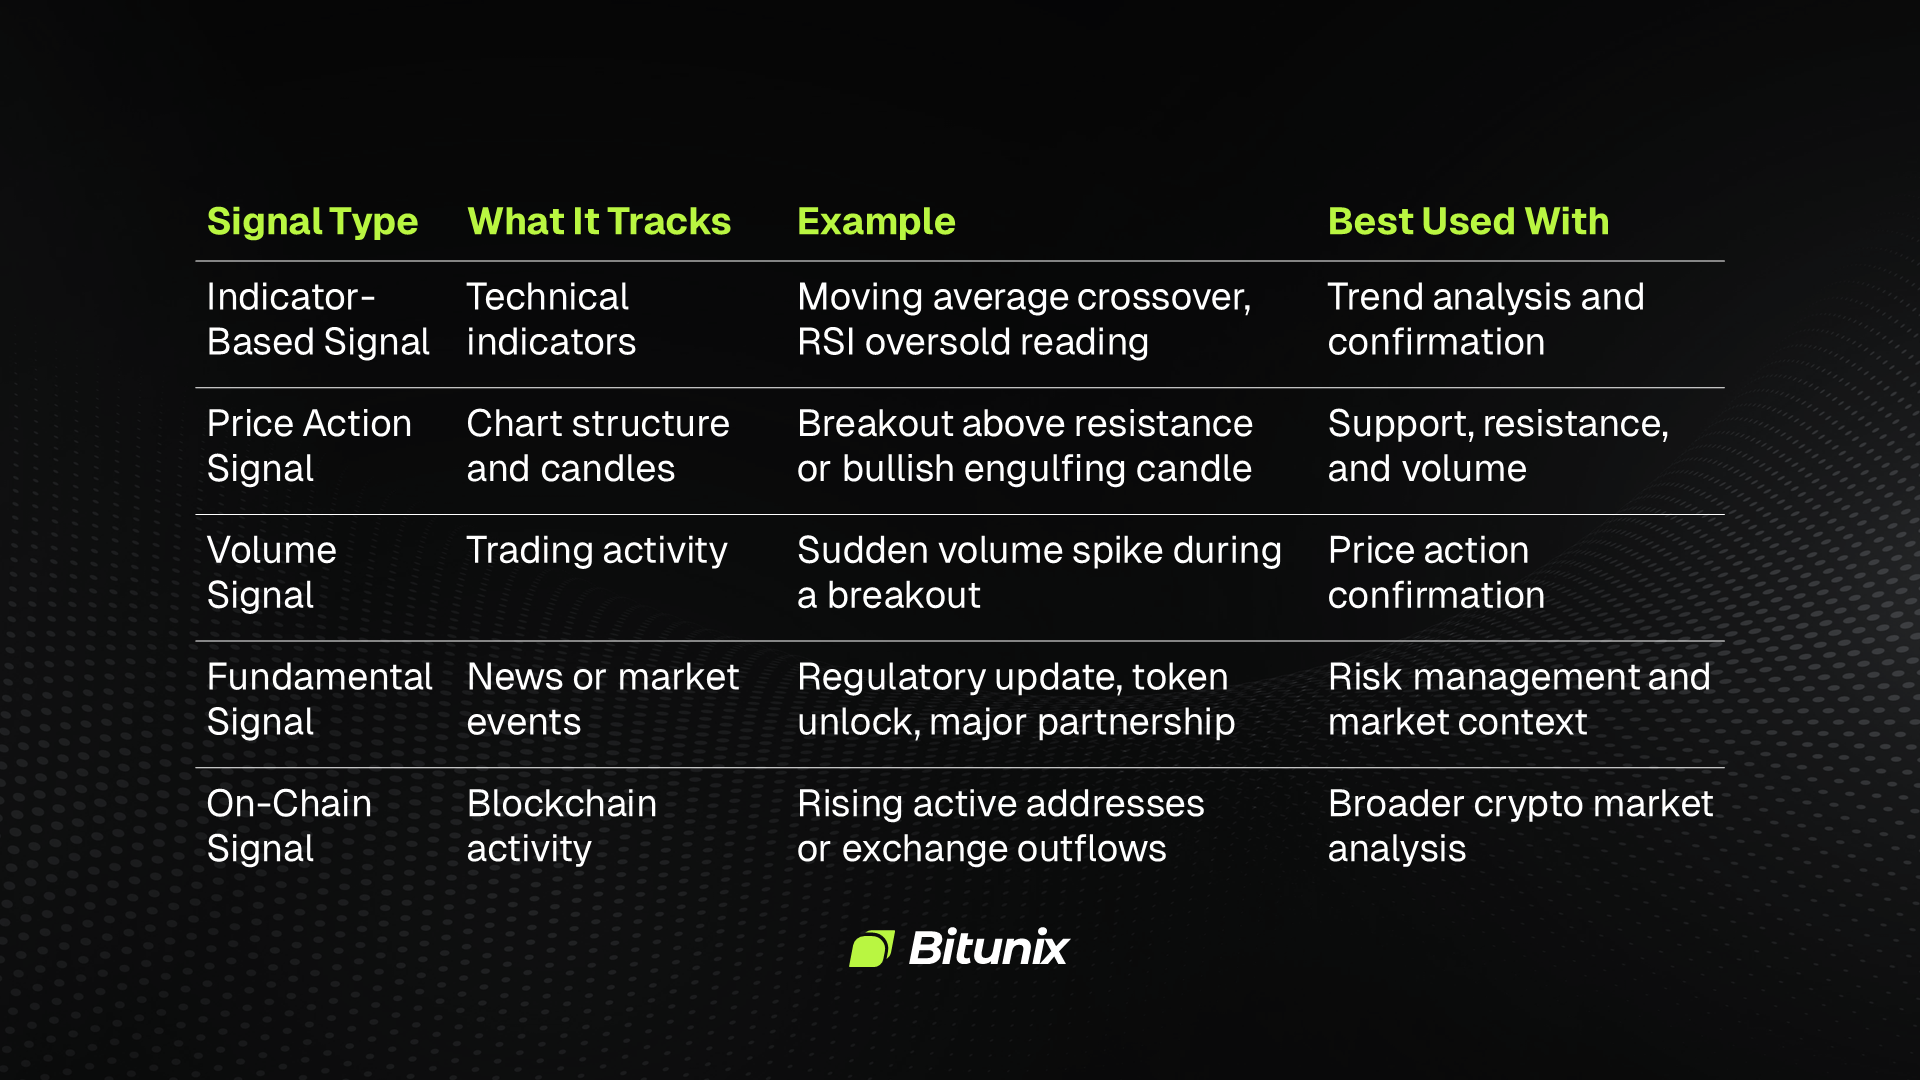
Common trading signal types and the tools traders can use to confirm them.
Indicator-Based Signals
Indicator-based signals use technical indicators to translate price data into potential trade triggers. A moving average crossover can suggest a trend shift, RSI can show overbought or oversold conditions, and MACD can highlight changes in momentum.
A 2025 Swissquote technical analysis guide gives a useful reminder about confirmation:
"Chart patterns and technical indicators are invitations to look closer at a signalled opportunity to trade. To confirm such indications, use several signals."
Indicator signals should support analysis rather than replace it. An RSI oversold reading is more useful near a known support level because the chart already shows a possible buyer reaction area. In the middle of a falling trend with no support reaction, the same reading is weaker and needs more confirmation.
Price Action Signals
Price action signals come directly from the chart rather than from a separate indicator. Traders watch for breakouts above resistance, breakdowns below support, trend line breaks, rejection candles, engulfing candles, and failed breakouts. These signals focus on what buyers and sellers are doing at key levels.
A breakout above resistance can act as a buy signal when the price closes strongly above the level, and volume supports the move. A breakdown below support can act as a sell signal when the market accepts lower prices instead of quickly reclaiming the level. The close matters because short spikes can trick traders into entering too early.
Price action signals are often easier to understand than indicator signals, but they still need context. A bullish candle after a deep selloff means less if the broader trend remains weak. A bearish rejection near resistance is more significant if it occurs after several failed attempts to move higher.
Volume Signals
Volume signals track trading activity and help confirm whether a price move has support behind it. A breakout with rising volume suggests more participation, while a breakout on weak volume can fade quickly. In crypto, volume is especially useful because speculative moves often need participation to continue.
A sudden volume spike can also warn that a market is entering a high-risk phase. Sometimes volume confirms a trend. Other times, it marks exhaustion after a sharp move. That is why traders usually compare current volume with the recent average volume rather than looking at a single candle in isolation.
Decentralized exchange activity adds another useful layer for crypto traders. In Q2 2025, the top 10 decentralized exchanges recorded $876.3 billion in spot trading volume, up 25.3% from $699.2 billion in Q1, while the DEX-to-CEX ratio rose from 0.13 to a record 0.23. This matters for signals because increased on-chain trading activity can affect liquidity, price discovery, and volume confirmation across assets.
Fundamental Signals
Fundamental signals come from news, regulation, network updates, macro conditions, and project-specific events. In crypto, these can include token unlocks, ETF flows, protocol upgrades, security incidents, exchange listings, governance decisions, or regulatory announcements.
A major partnership can create short-term demand, but traders still need to check liquidity, trend, and timing. A token unlock can put pressure on the price if the market expects new supply to be sold. A regulatory update can affect an entire sector, especially if it changes access, compliance expectations, or institutional participation.
Fund flows can also work as a fundamental signal because they show where capital is moving. CoinShares' 2025 report shows that global digital asset investment products attracted $47.2 billion in inflows during the year, close to the 2024 record of $48.7 billion. The report also noted that Bitcoin flows declined sharply while Ethereum, XRP, and Solana recorded strong growth, signaling a rotation toward select altcoins.
Evaluating and Using Trading Signals
Trading signals work best when you treat them as part of a process. A signal should lead to a question: Does this setup fit my plan? The answer should come from confirmation, timeframe alignment, market context, and risk management.
1. Signal Confirmation
Signal confirmation means checking whether more than one piece of evidence supports the trade. A trader may combine a moving average crossover with a resistance breakout and rising volume. Each added layer helps reduce the risk of acting on a weak or isolated signal.
Confirmation should keep the setup clearer, not heavier. Using too many indicators can create conflicting signals, slower decisions, and late entries. Hence, a simple setup often works better when the signal, key price level, volume, and risk plan all support the same trade idea.
2. Timeframe Alignment
Signals on higher timeframes are usually more reliable than signals on lower timeframes because they include more market data. A daily breakout often carries more weight than a one-minute candle pattern.
A practical approach is to start with the higher timeframe trend and then use a lower timeframe for entry. If the daily chart is trending upward, a bullish signal on the four-hour chart has better support. If the daily trend is weak, a short-term buy signal needs extra caution. Timeframe alignment also reduces emotional trading. When you know the larger trend, you are less likely to overreact to every small candle.
3. Market Context
Market context tells you whether a signal appears in a supportive environment. A bullish signal in a strong uptrend means something different from the same signal inside a choppy range. A bearish signal near major resistance means more than a bearish signal after price has already fallen sharply.
Market context also includes the asset itself. A BTC signal usually behaves differently from a low-liquidity altcoin signal. Major assets tend to have deeper liquidity, while smaller tokens can move sharply on thinner order books. The signal may look the same on the chart, but the execution risk can be very different.
4. Risk Management
Risk management turns signals into controlled trades. A signal can identify a possible entry, but your stop loss, position size, and invalidation level decide whether the trade makes sense.
A good signal-based trade should answer four questions before entry:
- Where is the entry?
- Where is the stop loss?
- What is the target or management plan?
- How much of the account is at risk?
Spot trading signals help traders evaluate entry points, exit points, risk, and potential upside before entering a trade, but remember that signals do not automate decision-making, which is the right way to frame them for beginners and experienced traders alike.
Limitations and Considerations
False signals are part of trading, especially in unstable or ranging markets. A breakout can fail, RSI can stay overbought during a strong trend, and MACD can flip back and forth when momentum is weak.
Signal lag is another common issue. Many indicator-based signals use historical price data, so they confirm moves after part of the move has already happened. Moving averages and MACD can help confirm trend direction, but they can also produce late entries after the price has already stretched.
Traders who rely too much on signals often enter positions without understanding market structure or defining the conditions under which the trade idea becomes invalid. That turns the signal into a shortcut rather than part of a trading plan, and shortcuts in trading usually create problems when market conditions change.
A strategy can also become unreliable when a trader keeps adjusting indicator settings until the backtest looks almost perfect. Strong historical performance does not guarantee live results, especially when the system is overly fitted to past data. Research on algorithmic trading notes that overfitting often leads to strong backtests but weak live-market performance.
Conclusion: Using Trading Signals Effectively
Trading signals are useful tools because they help traders identify potential opportunities without relying only on instinct. They can highlight momentum shifts, trend changes, breakout attempts, volume spikes, and news-driven setups. Used well, they make your analysis more organized.
The best results come from combining trading signals with market context, confirmation, and risk management. A signal should never be treated as a guaranteed outcome. It should fit your trading strategy, match your timeframe, and give you a clear point where the idea is wrong.
Ready to start using trading signals? Download the Bitunix app and register an account to access charting tools, alerts, spot and futures markets, and trade management features that can help you build a more structured trading process.
FAQ Section
What exactly is a trading signal?
For most traders, a trading signal is a trigger that suggests a possible action, such as entering, exiting, reducing, or avoiding a position. It can come from indicators, price action, volume, news, or on-chain data, but it still needs confirmation before use.
What are the different types of trading signals?
The main types include indicator-based, price action, volume, fundamental, and on-chain signals. Each one tracks a different part of the market, so a useful setup often combines several inputs rather than relying on a single alert.
How reliable are trading signals?
Trading signals vary in reliability depending on the market, timeframe, asset, and confirmation method. A signal in a strong trend with volume support is usually more useful than the same signal in a choppy range.
Can I trade every signal I receive?
Traders should not trade every signal because many alerts appear in weak or unstable conditions. A signal should match your trading plan, timeframe, risk limit, and market view. Filtering signals helps reduce overtrading and keeps decisions more consistent.
What is the difference between buy signals and sell signals?
Buy signals suggest that conditions support a possible long entry or accumulation, while sell signals suggest that conditions support an exit, reduction, or short setup. The meaning depends on your position, timeframe, and whether you trade spot or futures.
How do I confirm a trading signal?
You confirm a trading signal by checking whether other evidence supports it. A breakout signal becomes stronger when price closes above resistance, volume increases, and the broader trend agrees. Confirmation helps reduce false entries, but it cannot remove risk completely.
What is signal lag, and why does it matter?
Signal lag happens when an indicator reacts after the price has already moved. Moving averages and MACD often confirm trends, but they can enter late because they use past price data. Lag matters because late entries can reduce reward and increase stop pressure.
Can I use trading signals on all timeframes?
Trading signals can work across many timeframes, but lower ones often produce more noise and false alerts. Higher timeframes include more data and often provide stronger context. Many traders use higher timeframes for direction and lower timeframes for entry timing.
Should I rely solely on trading signals?
You should not rely solely on trading signals, as they do not capture the full market picture. A good trading process also includes trend analysis, support and resistance, liquidity, volatility, position sizing, and stop losses. Signals work best as part of a broader plan.
Where can I find reliable trading signals?
Reliable signals come from transparent tools, tested strategies, and platforms that let you verify the chart yourself. You can use indicators, alerts, TradingView-style charts, exchange tools, and market data platforms, but you should always check the signal logic before placing a trade.
Glossary
- Trading signal: A trigger that suggests a possible trade entry, exit, reduction, or warning based on market data.
- Technical indicator: A chart-based tool that uses price, volume, or other data to measure market behavior.
- Buy signal: A trigger suggesting that market conditions support a long entry or position increase.
- Sell signal: A trigger suggesting that conditions support an exit, reduction, or short setup.
- RSI: A momentum indicator that measures whether an asset appears overbought or oversold.
- MACD: A momentum indicator that compares moving averages to identify trend and momentum changes.
- Moving average: An indicator that smooths price data to show trend direction over a selected period.
- Price action: Trading analysis based on candles, structure, support, resistance, and chart behavior.
- Support: A price area where buyers have previously stepped in and slowed or reversed declines.
- Resistance: A price area where sellers have previously limited or rejected upward movement.
- Breakout: A move above resistance or below support that suggests a possible trend continuation or shift.
- Volume: The amount of an asset traded during a specific period, often used to confirm price moves.
- On-chain data: Blockchain activity data, such as active addresses, exchange inflows, and network usage.
- Signal lag: The delay between a market move and an indicator's response to that move.
- Risk management: The process of controlling trade size, stop losses, and account exposure to limit losses.
Disclaimer
This article does not provide:
(i) investment advice or investment recommendations;
(ii) an offer or solicitation to buy, sell, or hold digital assets;
(iii) financial, accounting, legal, or tax advice.
Digital assets, including stablecoins and NFTs, involve high risk and may fluctuate significantly. Consider whether trading or holding digital assets is appropriate for you given your financial situation. Consult a qualified legal, tax, or investment professional when needed. You are responsible for understanding and complying with applicable local laws and regulations.
About Bitunix
Bitunix is a global cryptocurrency derivatives exchange trusted by over 3 million users across more than 100 countries. At Bitunix, we are committed to providing a transparent, compliant, and secure trading environment for every user. Our platform features a fast registration process and a user-friendly verification system supported by mandatory KYC to ensure safety and compliance. With global standards of protection through Proof of Reserves (POR) and the Bitunix Care Fund, we prioritize user trust and fund security. The K-Line Ultra chart system delivers a seamless trading experience for both beginners and advanced traders, while leverage of up to 200x and deep liquidity make Bitunix one of the most dynamic platforms in the market.
Bitunix Global Accounts
X | Telegram Announcements | Telegram Global | CoinMarketCap | Instagram | Facebook | LinkedIn | Reddit | Medium