Article Summary
- This article provides a comprehensive explanation of price action trading in the context of cryptocurrency markets.
- It breaks down the fundamental principles of price action and how to interpret raw price movement without relying on indicators.
- The guide explores key price action concepts, including support and resistance, trend lines, candlestick patterns, and market structure.
- It highlights practical applications for traders, including how to identify high-probability price action setups and execute trades.
- The article concludes with actionable advice for developing a price action-based trading strategy.
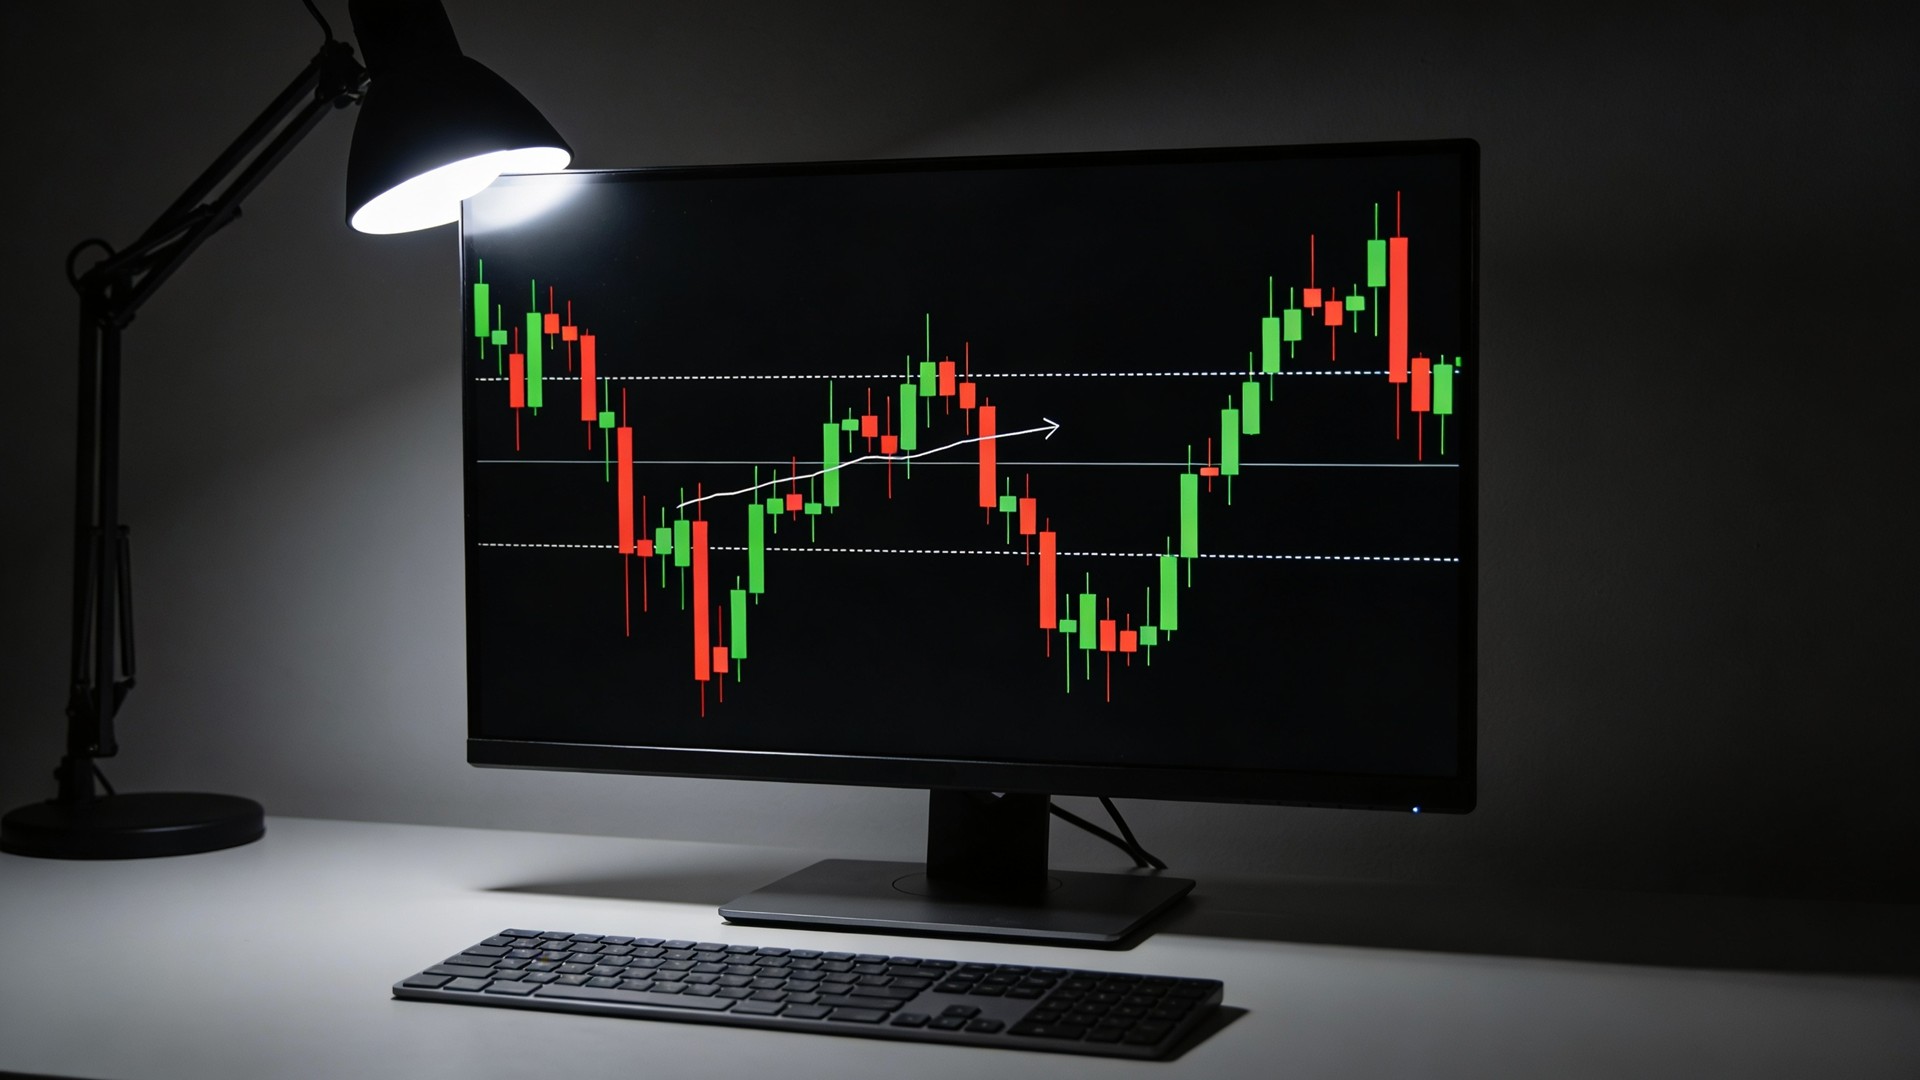
- What if you could trade by reading the price chart itself, without covering it with dozens of indicators? Price action trading does exactly that. It focuses on how prices move, where buyers and sellers react, and what patterns form around key levels.
- Price action trading is a trading approach based on raw price movement and historical chart behavior. Instead of relying heavily on technical indicators, traders study market structure, candlestick patterns, support and resistance, trend lines, breakouts, and reversals.
- For crypto traders, this approach is useful because digital asset markets move quickly and often react sharply around major price levels. A trader using a crypto exchange such as Bitunix can use price action to plan entries, exits, and risk before placing a trade.
- This guide explains the core principles of price action, how to read common chart patterns, and how to build a practical strategy based on the chart itself.
Understanding Price Action Trading Principles
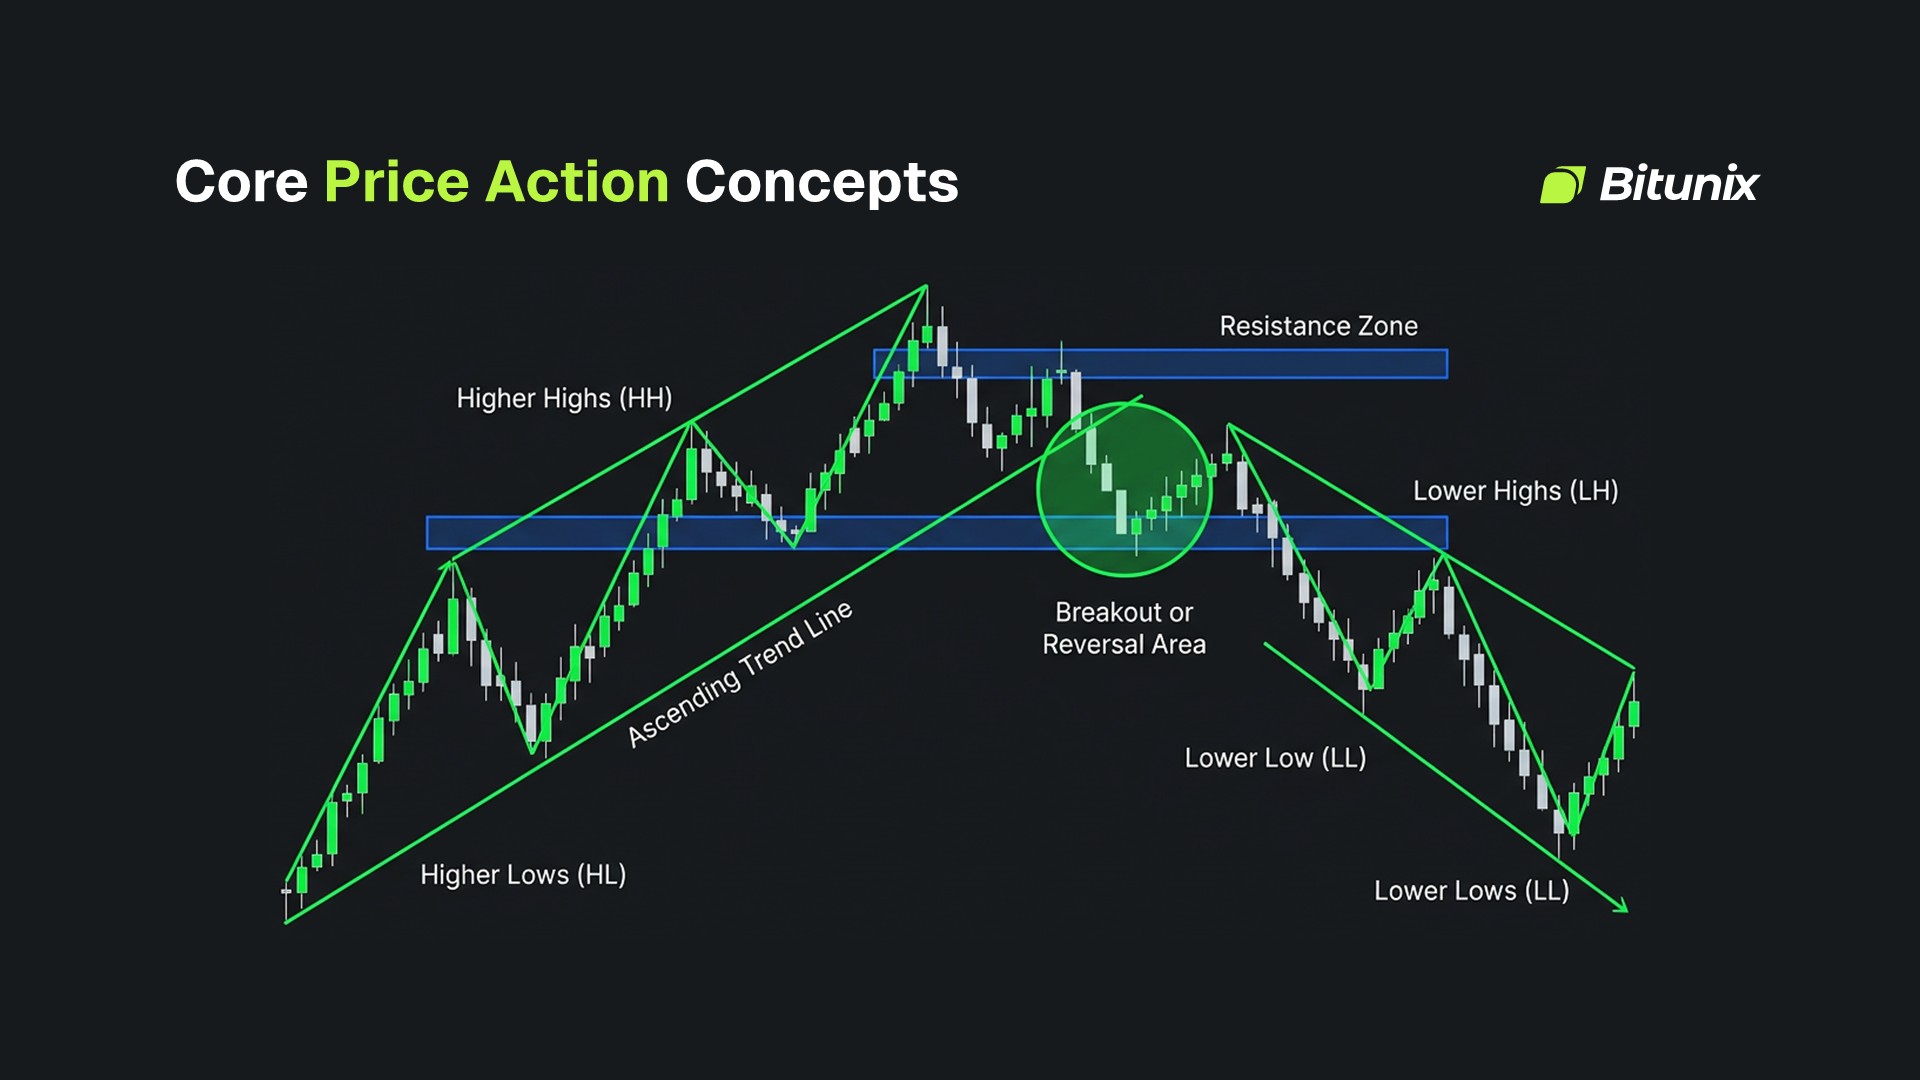
The foundation of price action trading is the idea that price already reflects market behavior. Each candle records where the price opened, how far it moved, where it was rejected, and where it finally closed. Swing highs and swing lows show where momentum changed, while breakouts show when one side pushed through a level the other side had been defending.
The answer to what is price action trading starts with market structure. In an uptrend, the price usually forms higher highs and higher lows, while in a downtrend, it usually forms lower highs and lower lows. When those patterns break, the market may be shifting.
A 2025 XS guide summarizes the method well: "The price action strategy relies on analyzing candlestick patterns, support and resistance levels, and market structure to determine optimal entry and exit points." That works because it focuses on the three building blocks traders actually use on the chart: structure, levels, and candles.
Support and resistance give those building blocks a location. Support is an area where buyers previously stepped in, while resistance is an area where sellers previously took control. These zones help traders identify where the price may react again, but they should be treated as areas rather than lines.
Candlestick patterns add detail by showing how buyers and sellers behaved during a specific trading period. Engulfing candles can show a shift in control, doji candles often show indecision, hammers can show rejection of lower prices, and shooting stars can show rejection of higher prices. These patterns become more useful when they appear near key levels, align with market structure, and receive confirmation from volume or the next candle.
The market context then determines how much trust you should place in the setup. Reuters reported in February 2026 that Bitcoin's market depth had fallen from more than $8 million in 2025 to about $5 million, making prices more sensitive to smaller trades. In thinner markets, price action traders need stronger confirmation before trusting breakouts, reversals, or support retests, especially on smaller altcoins where liquidity can evaporate more quickly.
Key Price Action Concepts and Patterns
Price action trading becomes easier when you break the chart into a few core concepts. You need to understand trends, levels, candles, and the way the price behaves around important areas.
Price action trading uses market structure, trend lines, support and resistance, and breakout or reversal areas to read price movement without relying heavily on indicators.
1. Reading Trend Lines
Trend lines help traders see the direction and strength of a move. In an uptrend, you can draw a line connecting higher lows, and in a downtrend, you can draw a line connecting lower highs.
A trend line becomes more useful when the price respects it several times. If the price keeps bouncing off the same rising line, buyers are still defending the trend, and if it breaks below that line with strong momentum, the trend may be weakening.
Remember that trend lines should not be forced. If you need to adjust the line repeatedly to make it fit, the structure is probably not clean enough. Clear trend lines connect obvious swing points and help you read momentum without cluttering the chart.
2. Mapping Support and Resistance
Support and resistance levels are among the most important parts of a price action strategy. Traders use historical price action to find areas where price previously bounced, rejected, consolidated, or reversed.
A useful support level often forms where the price stops falling and moves higher with strength, and a reliable resistance level often forms where the price stops rising and moves lower. Crypto prices can wick through a level and still respect the broader area.
The best levels usually appear clearly on higher timeframes. A daily support zone carries more weight than a random 3-minute bounce, while lower timeframes help with execution, but higher timeframes usually define the most important price levels.
3. Breakouts and Breakdowns
Breakouts and breakdowns indicate that the price has moved beyond an important level, which can signal a change in market structure. A breakout occurs when the price moves above resistance, while a breakdown occurs when the price falls below support. Traders should still wait for confirmation, such as a strong candle close, rising volume, or a successful retest, because unsupported breakouts can fail quickly and return to the prior range.
A strong breakout usually closes above the level, shows increased volume, and holds on a retest. A weak breakout often pushes through the level, fails to attract follow-through, and falls back into the prior range.
This is where many traders get trapped. They buy the first candle above resistance, then the price snaps back. Waiting for a close, a retest, or a volume increase can reduce that risk.
4. Consolidation and Range Behavior
Consolidation happens when the price moves sideways between support and resistance, meaning that the market is deciding whether buyers or sellers have more control. A range can create two types of opportunities. Traders can buy near support and sell near resistance as long as the range holds. They can also wait for a breakout or breakdown when the price leaves the range with strength.
Range trading works best when traders wait for the price to reach a clear boundary rather than reacting to every small move within the range. Sideways markets often create false breakouts, where the price briefly moves beyond support or resistance and then returns to the prior range. A cleaner setup usually appears when price rejects the range edge with a strong candle, confirms the move with volume, or breaks out and holds beyond the level.
Practical Price Action Trading Strategies
Price action trading works best when it becomes a repeatable process. You need clear rules for where to enter, where to exit, and where the trade idea fails.
1. Support and Resistance Trading
Support and resistance trading starts with marking key levels. A trader may look for long positions when the price returns to support and shows buyer rejection. A trader may look for short positions when the price reaches resistance and shows seller rejection.
For a long setup, confirmation can include a bullish engulfing candle, a long lower wick, or a higher low forming near support. For a short setup, confirmation can include a bearish engulfing candle, a shooting star, or a lower high near resistance.
Stop losses usually sit beyond the level that supports the trade idea. For long trades, traders often place the stop below support because a break below that level indicates that buyers failed to defend it. For short trades, the stop often sits above resistance because a move above that level shows sellers lost control. This placement gives the trade a clear invalidation point and helps limit losses if the setup fails.
2. Trend Following
Trend following means trading in the direction of the current structure. In an uptrend, traders look to buy pullbacks, and in a downtrend, they look to sell rallies. The main goal is to avoid fighting the market. If price keeps making higher highs and higher lows, buying near support or a rising trend line often makes more sense than trying to call the top. If price keeps making lower highs and lower lows, selling near resistance often makes more sense than trying to guess the bottom.
A trend-following price action setup becomes stronger when the pullback is controlled, the key level holds, and the price resumes in the trend direction with a strong candle.
3. Breakout Trading
Breakout trading focuses on price moving through an important level. The setup works best when price consolidates near resistance and then breaks above it with momentum, or consolidates near support and then breaks below it with force. Volume helps confirm the move. A breakout with weak volume can fail quickly because there is not enough participation behind it. A breakout with strong volume and a successful retest gives traders more evidence.
4. Reversal Trading
Reversal trading means looking for signs that a trend is losing strength, which happens when the price reaches a major support or resistance level and forms a clear rejection pattern.
A bullish reversal can form when the price reaches support, creates a long lower wick, and then follows with a strong bullish candle. A bearish reversal can form when the price reaches resistance, fails to break higher, and then closes lower with strong selling pressure.
Reversal trading needs caution because trends can last longer than expected. The best reversal setups usually appear at important levels, with clear rejection and confirmation from the next candle.
Limitations and Considerations
Price action trading involves some subjectivity because traders can interpret the same chart differently. One trader may draw support slightly lower, while another may treat the same area as a broader demand zone. This is why consistent rules matter. Use the same method for marking levels, reading candles, and confirming setups, so your decisions do not change from trade to trade.
Developing skill with price action also takes time. You need to review charts, study how prices react around key levels, and track which patterns work best in different market conditions. A setup that works well in a clean trend can fail in a choppy range, so experience helps you separate useful signals from market noise.
The broader market context should guide how much trust you place in any setup. Reuters reported that Bitcoin saw a sharp rebound in February 2026 after hitting a 16-month low, while the broader crypto market had lost about $2 trillion in value from its October peak. In conditions like that, breakouts, reversals, and support retests need stronger confirmation because volatility can distort short-term price action.
False signals are another major limitation. A breakout can fail, a reversal candle can lose follow-through, and a support level can break after several clean reactions. Traders can reduce weak entries by waiting for candle closes, retests, volume confirmation, and clear invalidation points before entering a trade.
Conclusion: Mastering Price Action Trading
Price action trading is a practical approach that focuses on reading raw price movement to identify trading opportunities. It helps traders understand market structure, support and resistance, candlestick behavior, breakouts, reversals, and consolidation without relying heavily on indicators.
By mastering price action concepts and patterns, you can build a more responsive trading strategy that adapts to changing market conditions. The goal is to wait for clean setups, define risk, and avoid reacting to every candle.
Ready to develop your price action trading skills? Create an account on Bitunix to access charting tools and practice identifying price action setups in real time.
FAQ Section
What exactly is price action trading?
Price action trading is a method that uses raw price movement, candlestick patterns, market structure, and key levels to make trading decisions. It focuses on what price is doing now and how it reacted in the past, instead of relying heavily on indicators.
Do I need indicators to trade price action?
You do not need indicators to trade price action, but you can use them as support tools. Many traders keep charts simple and focus on candles, levels, and structure. Others add volume, moving averages, or RSI for extra confirmation.
What are the key price action concepts I need to understand?
The main concepts are market structure, support and resistance, trend lines, candlestick patterns, breakouts, breakdowns, consolidation, and reversals. These help you understand whether buyers or sellers have control and where the price may react next.
How do I identify support and resistance levels using price action?
Look for areas where price previously reversed, paused, bounced, or rejected strongly. Support forms where buyers stepped in, while resistance forms where sellers took control. Higher-timeframe levels usually matter more than short-term intraday levels.
What candlestick patterns are most important for price action trading?
Common patterns include engulfing candles, doji candles, hammers, shooting stars, pin bars, and inside bars. These patterns become more useful when they appear near support, resistance, trend lines, or breakout areas, rather than randomly in the middle of a range.
How reliable are price action patterns?
Price action patterns are useful, but they are not guaranteed. Their reliability depends on market context, trend direction, timeframe, volume, and where they appear on the chart. Patterns at major levels with confirmation are stronger than isolated signals.
Can I combine price action with indicators?
Yes, price action can work well with simple indicators. Moving averages can help confirm trend direction, RSI can show momentum exhaustion, and volume can confirm participation. The key is to use indicators as confirmation, not as a replacement for reading price.
How long does it take to master price action trading?
Mastering price action takes time because it depends on pattern recognition, discipline, and repeated chart review. A trader can learn the basics quickly, but reading prices well across different market conditions often takes months or years of consistent practice.
What is the difference between price action trading and technical analysis?
Price action trading is a type of technical analysis focused mainly on raw price movement. Technical analysis is broader and can include indicators, chart patterns, volume tools, market breadth, and other data-based methods.
Where can I practice price action trading?
You can practice by reviewing historical charts, marking key levels, and tracking how the price reacts to them. Bitunix charting tools can help you study crypto pairs, draw support and resistance, compare timeframes, and practice identifying setups before trading live.
Glossary
- Price Action Trading: A trading method based on raw price movement, chart patterns, and market structure.
- Price Action Strategy: A structured plan that uses price behavior to define entries, exits, and risk.
- Candlestick Patterns: Candle formations that show buyer and seller behavior during a specific period.
- Support: A price area where buying pressure has previously slowed or reversed a decline.
- Resistance: A price area where selling pressure has previously slowed or reversed a rally.
- Technical Analysis: The study of price charts, volume, and market behavior to evaluate possible future movement.
- Trading Signals: Chart clues that suggest a possible entry, exit, continuation, or reversal.
- Market Structure: The sequence of highs and lows that shows trend direction.
- Higher High: A price peak that forms above the previous peak in an uptrend.
- Higher Low: A pullback low that forms above the previous low in an uptrend.
- Lower High: A bounce peak that forms below the previous high in a downtrend.
- Lower Low: A price low that forms below the previous low in a downtrend.
- Trend Line: A diagonal line connecting swing highs or lows to show trend direction.
- Breakout: A move above resistance that can signal stronger buyer control.
- Stop Loss: A planned exit level used to limit losses when the price moves against the trade.
Disclaimer
This article does not provide:
(i) investment advice or investment recommendations;
(ii) an offer or solicitation to buy, sell, or hold digital assets;
(iii) financial, accounting, legal, or tax advice.
Digital assets, including stablecoins and NFTs, involve high risk and may fluctuate significantly. Consider whether trading or holding digital assets is appropriate for you given your financial situation. Consult a qualified legal, tax, or investment professional when needed. You are responsible for understanding and complying with applicable local laws and regulations.
About Bitunix
Bitunix is a global cryptocurrency derivatives exchange trusted by over 3 million users across more than 100 countries. At Bitunix, we are committed to providing a transparent, compliant, and secure trading environment for every user. Our platform features a fast registration process and a user-friendly verification system supported by mandatory KYC to ensure safety and compliance. With global standards of protection through Proof of Reserves (POR) and the Bitunix Care Fund, we prioritize user trust and fund security. The K-Line Ultra chart system delivers a seamless trading experience for both beginners and advanced traders, while leverage of up to 200x and deep liquidity make Bitunix one of the most dynamic platforms in the market.
Bitunix Global Accounts
X | Telegram Announcements | Telegram Global | CoinMarketCap | Instagram | Facebook | LinkedIn | Reddit | Medium