Basic Definitions of Support and Resistance Levels
Support Level
A support level is a price zone where a declining market tends to pause, stabilize, or rebound. When buying interest is strong enough to absorb selling pressure, the price is less likely to continue falling.
The logic behind support is based on the market’s consensus cost basis. When the price approaches an area where many traders or investors entered previously, holders are often less willing to sell at a loss, while new buyers may see the level as an attractive entry point. This creates a price floor, which is commonly referred to as support.
Resistance Level
A resistance level is a price zone where a rising market tends to pause, stall, or reverse. When selling pressure increases and outweighs buying demand, the price may struggle to move higher.
The logic behind resistance is tied to trapped positions and profit-taking behavior. When the price approaches an area where many traders previously bought and are now looking to exit at break-even, or where existing holders are ready to lock in profits, selling pressure tends to increase. This creates a price ceiling, which is commonly referred to as resistance.
Why Is It Necessary to Learn How to Use Support and Resistance Levels?
Buy Low and Sell High: Traders can look for long entries near confirmed support levels, with stop-loss orders placed below support. Profit targets can then be set near resistance. For short positions, traders may look for entries near resistance, with stop-loss orders placed above that level.
Breakout Follow-Through: If price breaks above a resistance level with strong volume, that former resistance may become new support. Traders often look for a retest of that level before adding to long positions. Similarly, if price breaks below support with strong volume, that former support may become new resistance, which can provide a potential short-entry zone on a rebound.
Trend Confirmation: In an uptrend, support levels often continue to move higher, showing that buyers remain in control. In a downtrend, resistance levels often continue to move lower, showing that sellers remain in control.
Profit Protection: Short-term highs and lows can be used as reference points for managing positions. If price reaches a local high and fails to break through, it may act as short-term resistance, which can be used as a signal to reduce exposure. If price forms a local low and holds, it may act as short-term support.
Additional Position Management Tips
- In a bull market, once a support level is confirmed as valid, such as when price stabilizes and volume improves, it is generally safer to add to positions after confirmation rather than during the initial test.
- In a bear market, once a resistance level is confirmed as valid, such as when price stalls and volume weakens, it is generally safer to reduce exposure or consider short positions after confirmation rather than during the initial test.
Core Guide to Support Levels: How to Identify and Draw Them
The Core Logic Behind a Support Level
The formation of a support level comes from market recognition and capital acceptance at a specific price area. In general, this can be understood from two main dimensions:
First, there is the transaction-intensive zone, or chip concentration area. The longer price trades within a range and the more volume that accumulates there, the stronger that support zone tends to be.
Second, there is market consensus. Whether the level is formed by a prior accumulation range, a key moving average, or a trendline that traders widely watch, the essence is the same: the market collectively recognizes that zone as an important price area.
The Core Methods for Drawing Support Levels
1.Identify High-Volume Consolidation Zones: When price declines into a previous consolidation range or into an area with heavy historical trading activity, that zone often acts as support. These are areas where many market participants previously built positions, making them important cost-basis zones.
2.Use Moving Averages as Reference Levels: Moving averages reflect the average cost basis over a selected period. In general, longer-period moving averages tend to provide stronger support than shorter-period ones. For example, the 120-day moving average is often stronger than the 60-day, which is often stronger than the 30-day or 20-day. In trending markets, prices may also repeatedly respect a key moving average, creating dynamic support.
3.Draw Trendlines: By connecting multiple swing lows in an uptrend, traders can draw an upward trendline. When price pulls back to that trendline, it may act as support. The more times the trendline is tested and respected, the more significant it becomes.
4.Use Technical Indicators as Support References: Certain technical tools can help identify potential support zones, such as the lower band or middle band of Bollinger Bands, the lower boundary of channel-based indicators, or key Fibonacci retracement levels such as the 61.8% retracement.
5.Watch Psychological Price Levels: Round-number price levels often act as psychological support or resistance because they attract attention from a large number of market participants. In crypto, common examples include BTC at 50,000, 60,000, or 100,000.
Suggestion: You can use the Bitunix K-Line chart to mark psychological support zones, as shown in the example below.
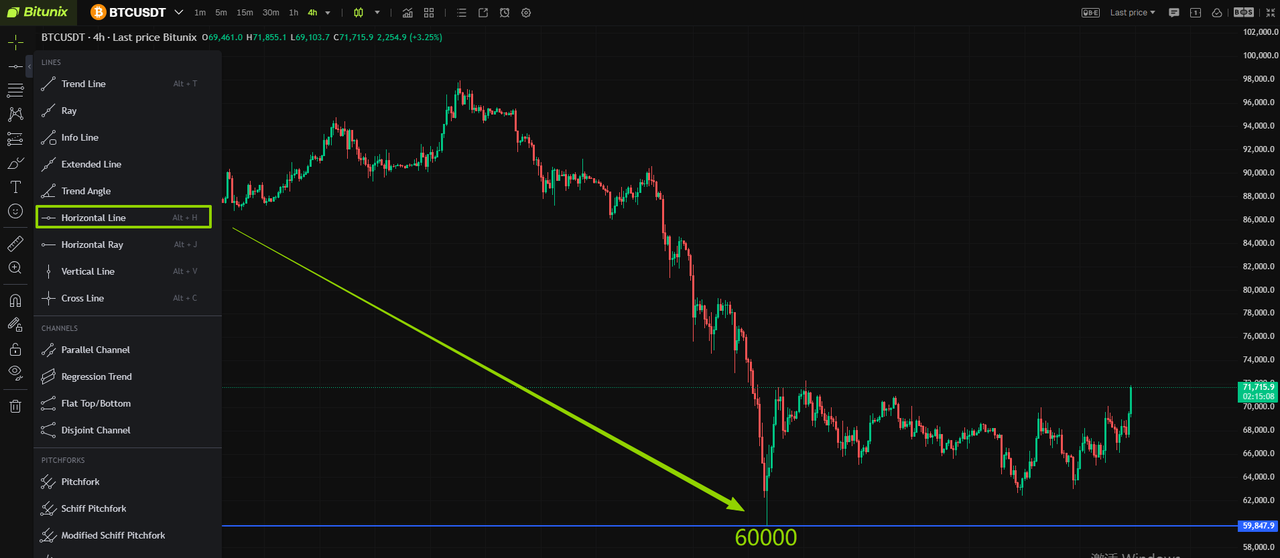
BTCUSDT daily level K-line chart
Criteria for Judging Whether the Support Level Is Valid
To determine whether a support level is effective, the two key factors are trading volume and price stabilization time. A valid support level can generally be evaluated using the following three criteria:
1.Price Pulls Back to Support While Volume Declines and Stabilizes When the price falls back to a support zone and trading volume contracts, it usually indicates that selling pressure is weakening while buying interest remains relatively strong.
2.Price Holds Above Support for 2 to 3 Consecutive Trading Days If the price remains above the support zone for 2 to 3 consecutive trading days, the support is considered more reliable. Even if the price briefly breaks below the level intraday and then quickly recovers, this can be viewed as a false breakdown, which still supports the validity of the support zone.
3.Volume Increases After Price Rebounds From Support If the price rebounds after testing support and is accompanied by rising volume, it provides stronger confirmation that the support level is effective and that a short-term bullish reversal may be taking shape.
Core Guide to Resistance Levels: Full Analysis of Drawing and Judging
The Core Logic Behind Resistance Levels
A resistance level forms because of selling pressure and the concentration of potential sellers. The key is to identify areas where trapped positions and profit-taking positions are heavily clustered. The more concentrated these selling positions are, the stronger the resistance tends to be.
At the same time, the density of trading activity in that price zone also affects the strength of the resistance. The longer the market has traded in that area, the harder it usually is for price to break through it decisively.
The Core Methods for Drawing Resistance Levels
1.Identify Trapped-Position Zones and Heavy Selling Areas When price rebounds into a previous distribution range, a prior failed rally zone, or an earlier high that has not been broken for a long time, that area often becomes resistant. These zones tend to contain trapped buyers and profit-takers, making them natural selling-pressure areas.
Suggestion: You can use the Bitunix K-Line chart to mark trapped-position resistance zones, as shown in the example below.
Once Ethereum’s trading volume breaks through the resistance zone highlighted by the white box, the price may have the potential to break above 2,500. Otherwise, it is more likely to continue moving in a downward, range-bound pattern.
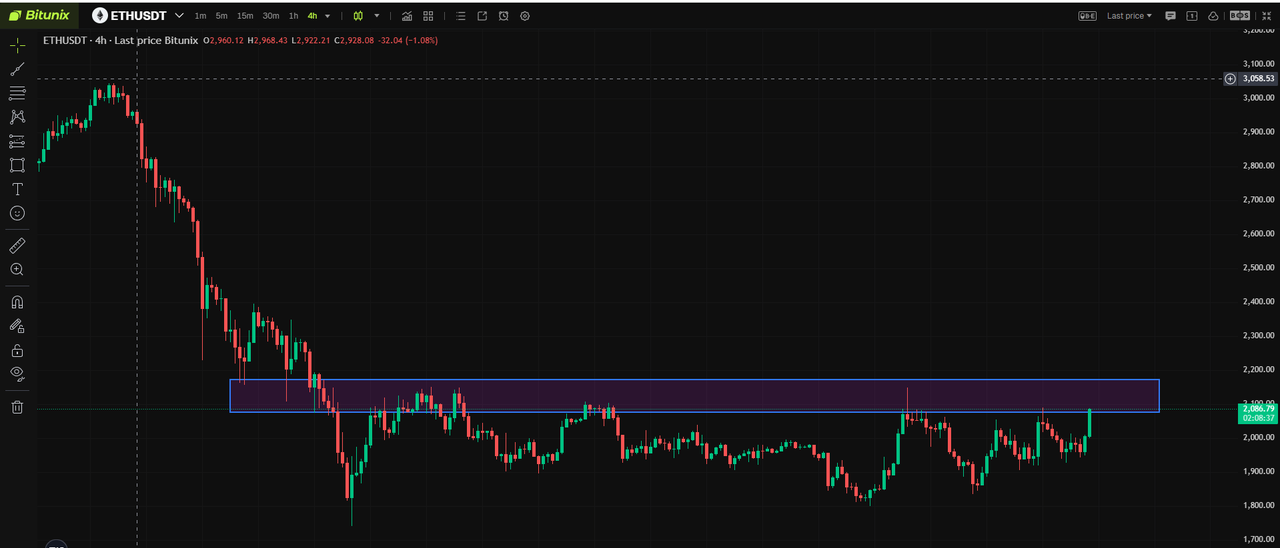
ETHUSDT 4-hour level K-line chart
2.Use Moving Averages as Resistance References When price rises into medium-term or long-term moving averages, such as the 120-day, 60-day, or 30-day moving average, and those moving averages are flat or sloping downward, they often act as resistance. In general, the longer the moving average period, the stronger the resistance.
3.Draw Trendlines By connecting multiple swing highs in a downtrend, traders can draw a descending trendline. When price rallies back to that trendline, it often acts as resistance. The more times price tests and respects the trendline, the more significant the resistance becomes.
4.Use Technical Indicators as Resistance References Technical tools can also help identify potential resistance zones, such as the upper band of Bollinger Bands, the upper boundary of channel indicators, or key Fibonacci retracement levels such as the 61.8% retracement.
Suggestion: You can use the Bitunix K-Line chart to draw Fibonacci retracement levels, as shown below.
The 61.8% Fibonacci retracement level above SOL, when combined with the broader downward trend channel, can serve as a meaningful reference zone for strong bearish resistance.
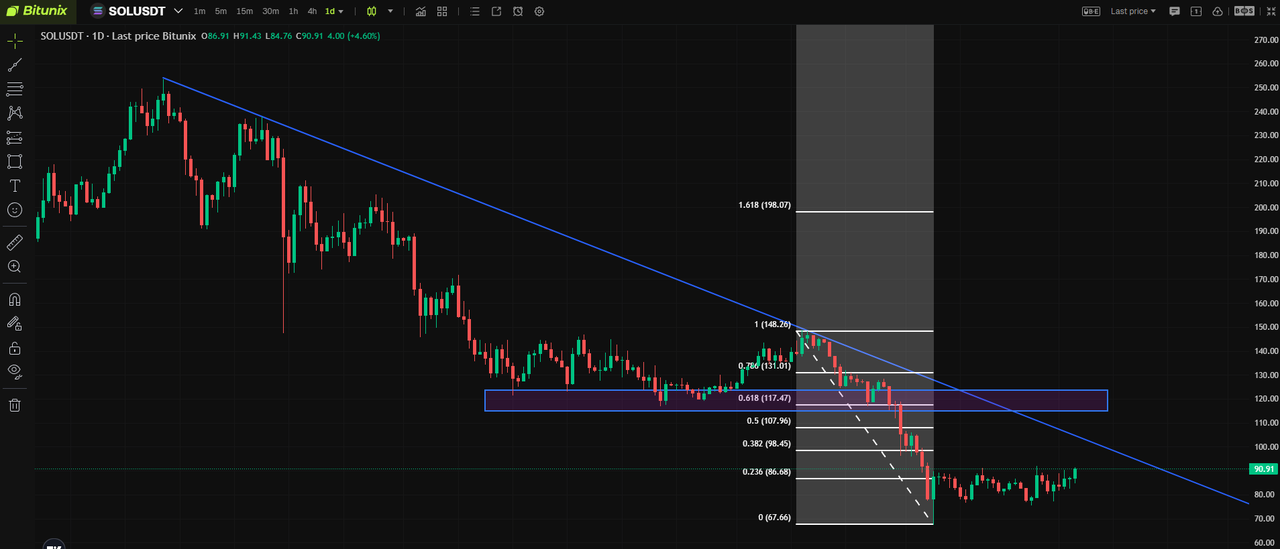
SOLUSDT daily level K-line chart
5.Watch Psychological Price Levels Round-number price levels often act as short-term psychological resistance because they attract attention from a large number of market participants. In crypto, common examples include ETH at 1,000, 1,500, 2,000, or 5,000. Previous swing highs and key milestone levels can also function as psychological resistance.
Criteria for Judging Whether Resistance Levels Are Effective
To determine whether a resistance level is effective, the two key factors are trading volume and price stabilization time. A valid resistance level can generally be evaluated using the following three criteria:
- Price Rebounds Into Resistance While Volume Contracts or Stalls When price rallies into a resistance zone but volume shrinks or remains weak, it suggests that buying momentum is fading while selling pressure remains strong. This strengthens the likelihood that the resistance level will hold.
- Price Fails to Break Above Resistance for 2 to 3 Consecutive Trading Days If the price is unable to close above the resistance zone for 2 to 3 consecutive trading days, the resistance is considered more reliable. Even if the price briefly breaks above it intraday and then quickly falls back, this can be treated as a false breakout, which still confirms the strength of the resistance.
- Price Reverses Lower From Resistance With Rising Sell Volume If the price is rejected from resistance and then declines with an increase in selling volume, it provides stronger confirmation that the resistance level is effective and that bearish momentum may be taking control.
Practical Demonstration of Support and Resistance Levels
Next, we move into practical trading applications. Using the Bitunix K-Line chart as the main tool, we can clearly demonstrate the logic and key techniques behind drawing support and resistance levels, helping traders apply these concepts in real market conditions.
First, open the Bitunix official website and enter the futures trading interface. Select the BTC/USDT perpetual futures as the example market. Then locate the line drawing tools on the left side of the K-Line chart and choose either the horizontal line or parallel channel tool. These are the basic tools used to mark support and resistance levels on the chart.
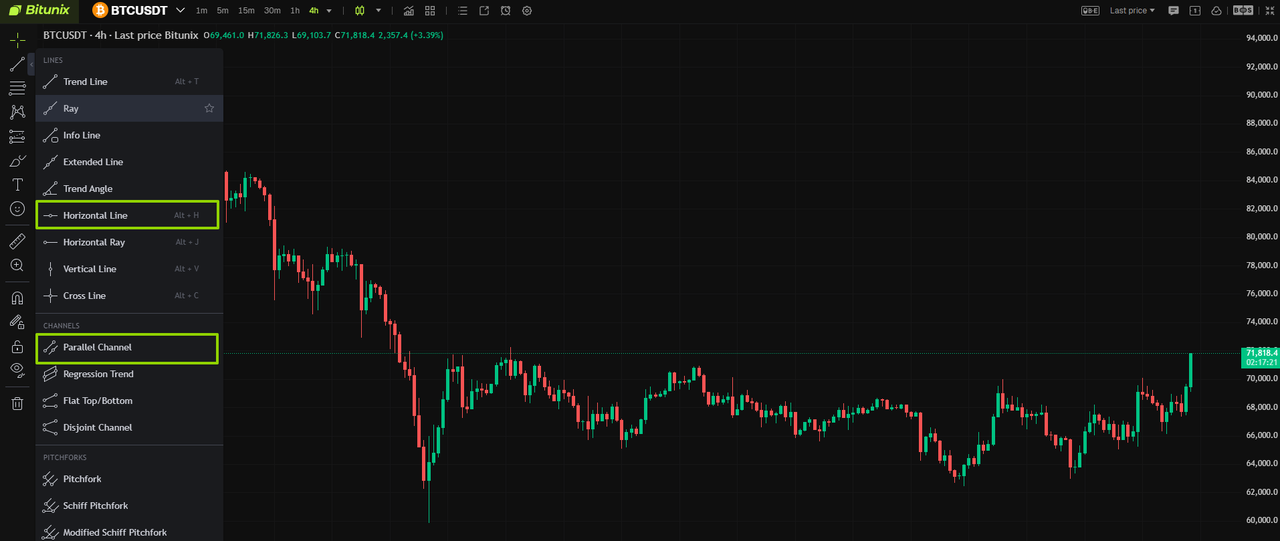
It should be emphasized that the selected timeframe in futures trading directly affects how reliable a trendline is. In most cases, it is recommended to prioritize the 4-hour or daily timeframe. Longer timeframes filter out more short-term noise, reflect market direction more clearly, and provide stronger guidance for trading decisions.
Effective Support Level
- Core Features: When price pulls back to a support zone (such as a high-volume area, moving average, or trendline), selling pressure weakens and volume typically contracts and stabilizes. Across multiple candles, such as on the 4-hour chart, price does not break decisively below support. Even if there is a brief wick below the level, price quickly recovers, and volume often increases during the rebound.
- Practical Case (BTC/USDT 4-Hour Chart): The blue zone below the chart represents a key BTC support area. Price repeatedly retraced into this zone but did not break below its lower boundary. Instead, it stabilized and rebounded. This repeated “test and bounce” behavior confirms the support’s effectiveness, and each pullback into the zone may present a potential opportunity to follow the trend.
- Trading Suggestion: Enable the Bitunix price alert feature. When price retraces into the key support zone (the blue area), consider establishing a small initial position to capture potential range movement. If price later breaks above the resistance zone overhead, you may consider scaling in to participate in a larger upside move.
- Key Conclusion: The core signal of effective support is strong buying acceptance and exhausted selling pressure. When support aligns with the broader trend, it reflects market consensus and improves the probability of a sustained move.
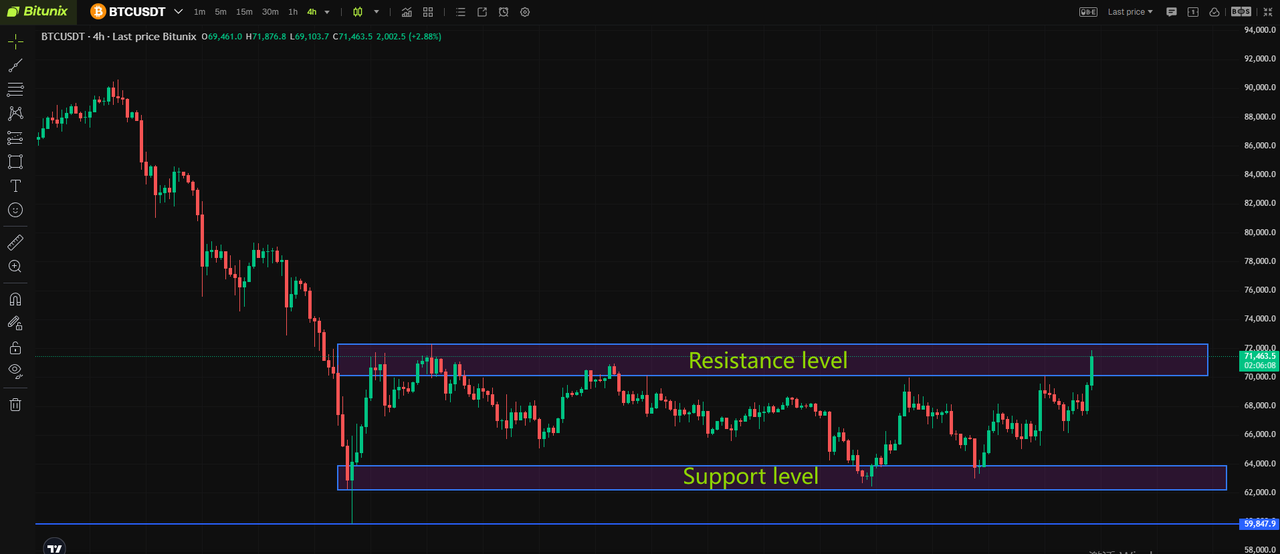
BTCUSDT 4-hour level K-line chart
Invalid Support Level
- Core Features: When price returns to a support zone but breaks below it with follow-through, the support is no longer effective. Multiple candles, such as daily candles, close clearly below the level, and the original support often turns into a new resistance zone.
- Practical Case (MYX/USDT Daily Chart): The blue dashed box marks a prior high-volume consolidation area and a key support zone formed by earlier sideways trading. After price fell below this range, several consecutive daily candles remained below it, indicating that the support failed and has shifted into a resistance zone.
- Trading Advice: Enable the Bitunix price alert feature. If price breaks below the key support zone, it may signal a shift in market structure. Traders who use short strategies may look for opportunities aligned with the new downtrend.
- Key Conclusion: The core signal of invalid support is that buyers can no longer take control and sell orders dominate. This suggests weakening trend strength, a confirmed break of the original support, and a meaningful change in market structure.
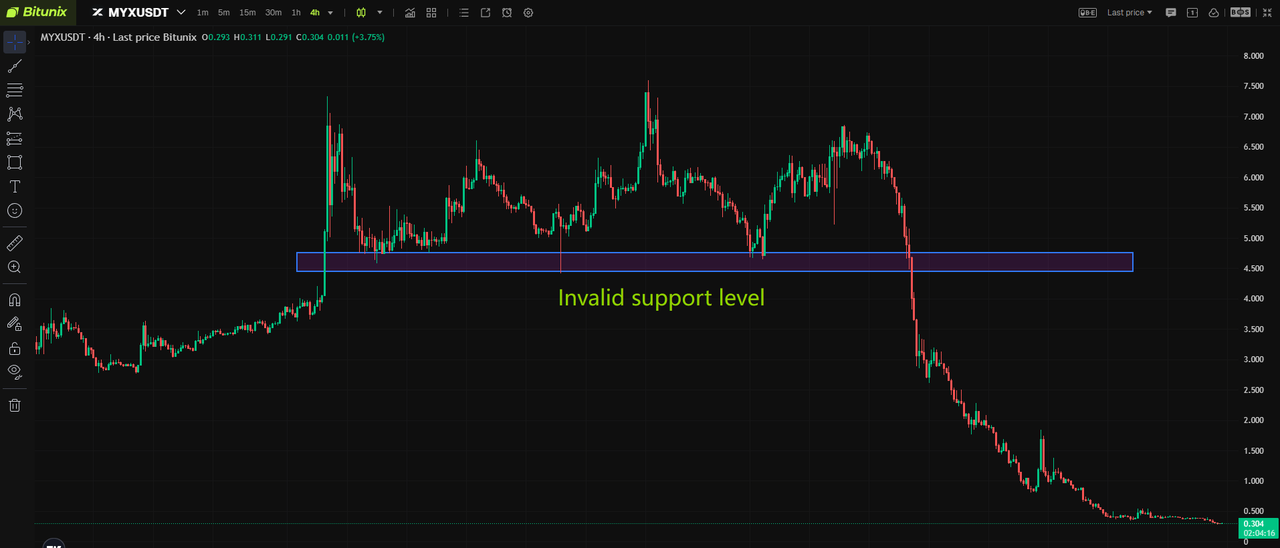
MYXUSDT daily level K-line chart
Effective Resistance Level
- Core Features: When price rallies into a resistance zone (such as a trapped-position zone, moving average, or trendline), buying momentum fades and volume often contracts. Price fails to break above the level for 2 to 3 consecutive trading days. Even if there is a brief wick above resistance, price quickly falls back, confirming a rejection.
- Practical Case (POWER/USDT 4-Hour Chart): POWER traded repeatedly within the 2.0 to 2.5 area with multiple cycles of rising and falling volume. Price briefly pierced resistance but immediately pulled back, and it failed to hold above the key area around 2.15. This behavior confirms the zone as a strong resistance level.
- Trading Advice: Enable the Bitunix price alert feature. If price breaks below the key trendline support near 1.66, it may provide a clearer signal for a short setup aligned with the trend.
- Key Conclusion: The core signal of effective resistance is strong selling pressure and exhausted buying demand. When resistance aligns with the broader trend, it increases the probability of a downside continuation.
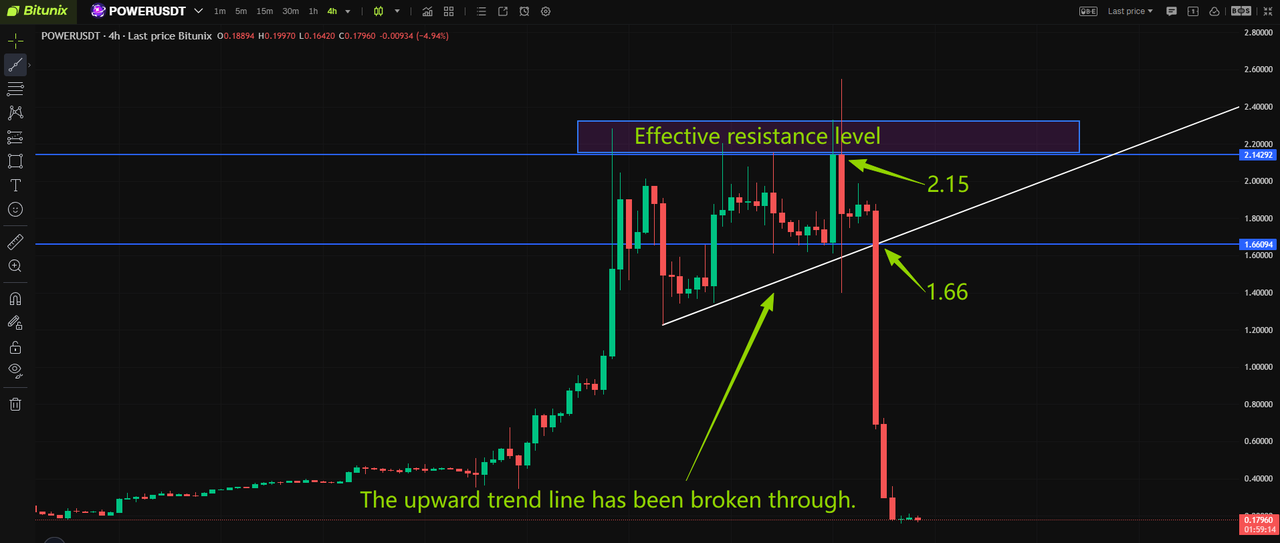
POWERUSDT 4-hour K-line chart
Ineffective Resistance Level
- Core Features: When price reaches resistance and breaks through with strong volume, and then holds above the level for 2 to 3 consecutive candles on a timeframe such as the 4-hour chart, the resistance fails. Even if price pulls back afterward, it does not fall back below the prior resistance. In many cases, the old resistance becomes a new support zone.
- Practical Case (RIVER/USDT 4-Hour Chart): The blue dashed box highlights an important early-stage resistance area. After price broke above this zone with strong momentum, several consecutive 4-hour candles held above it. On the subsequent pullback, price did not fall below the zone, indicating that the resistance failed and has transitioned into a new support area.
- Trading Advice: Enable the Bitunix price alert feature. If price breaks above the key resistance zone (the blue area), traders may look for opportunities to go long in line with the trend.
- Key Conclusion: The core signal of ineffective resistance is strong buying demand and exhausted selling pressure. This indicates the original resistance has been decisively broken and that market structure has shifted.
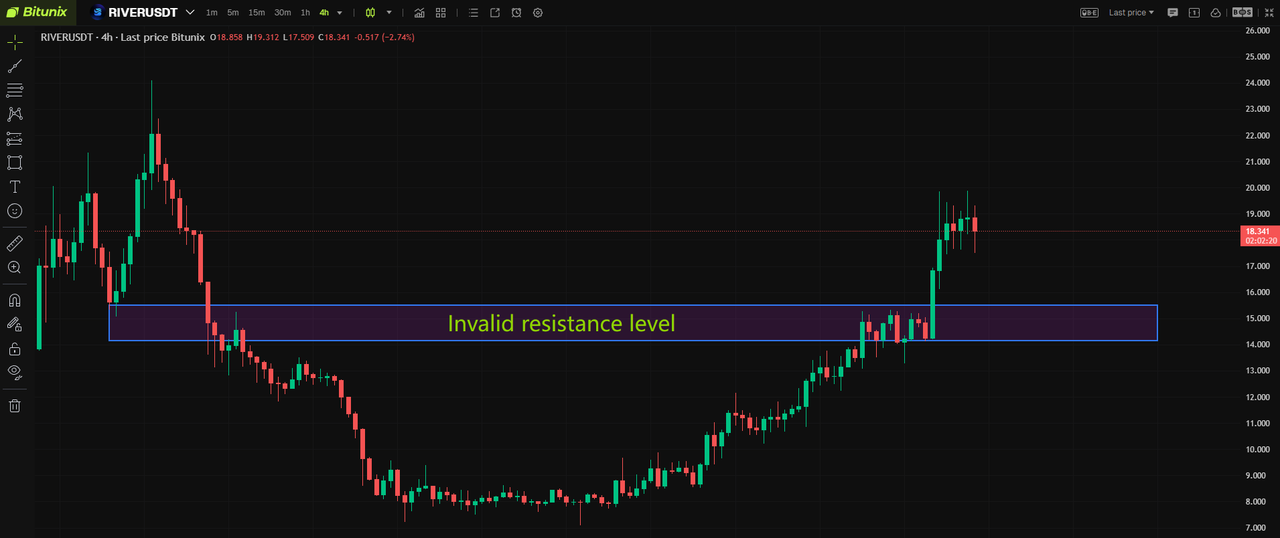
RIVERUSDT 4-hour K-line chart
Disclaimer
This article is not intended to provide:
(i) investment advice or investment recommendations;
(ii) an offer or solicitation to buy, sell, or hold digital assets; or
(iii) financial, accounting, legal, or tax advice.
Digital assets (including stablecoins and NFTs) involve high risk and may be highly volatile. You should carefully consider whether trading or holding digital assets is suitable for you based on your financial situation. For your specific circumstances, consult your legal, tax, or investment professionals. You are responsible for understanding and complying with all applicable local laws and regulations.
About Bitunix
Bitunix is a global cryptocurrency derivatives exchange trusted by over 3 million users across more than 100 countries. The platform is committed to providing a transparent, compliant, and secure trading environment for every user. Bitunix offers a fast registration process and a user-friendly verification system supported by mandatory KYC to ensure safety and compliance. With global standards of protection through Proof of Reserves (POR) and the Bitunix Care Fund, Bitunix prioritizes user trust and fund security. The K-Line Ultra chart system delivers a seamless trading experience for both beginners and advanced traders, while leverage of up to 200x and deep liquidity make Bitunix one of the most dynamic platforms in the market.
Bitunix Global Accounts
X | Telegram Announcements | Telegram Global | CoinMarketCap | Instagram | Facebook | LinkedIn | Reddit | Medium