
Double K-Line Pattern Overview
The Double K-Line pattern is a widely used chart formation in technical analysis that helps traders identify potential entry or exit points. It consists of two consecutive candlesticks (K-lines) — the first reflects the market's initial sentiment, while the second signals a potential shift in direction.
1.Bullish Engulfing Pattern
A Bullish Engulfing pattern occurs when a small bearish K-line (candlestick) is immediately followed by a larger bullish K-line that completely engulfs the body of the previous candle.
This pattern suggests a potential reversal from a downtrend to an uptrend, as buying pressure overpowers previous selling activity. It often appears after a short-term decline and may signal the start of a bullish move.
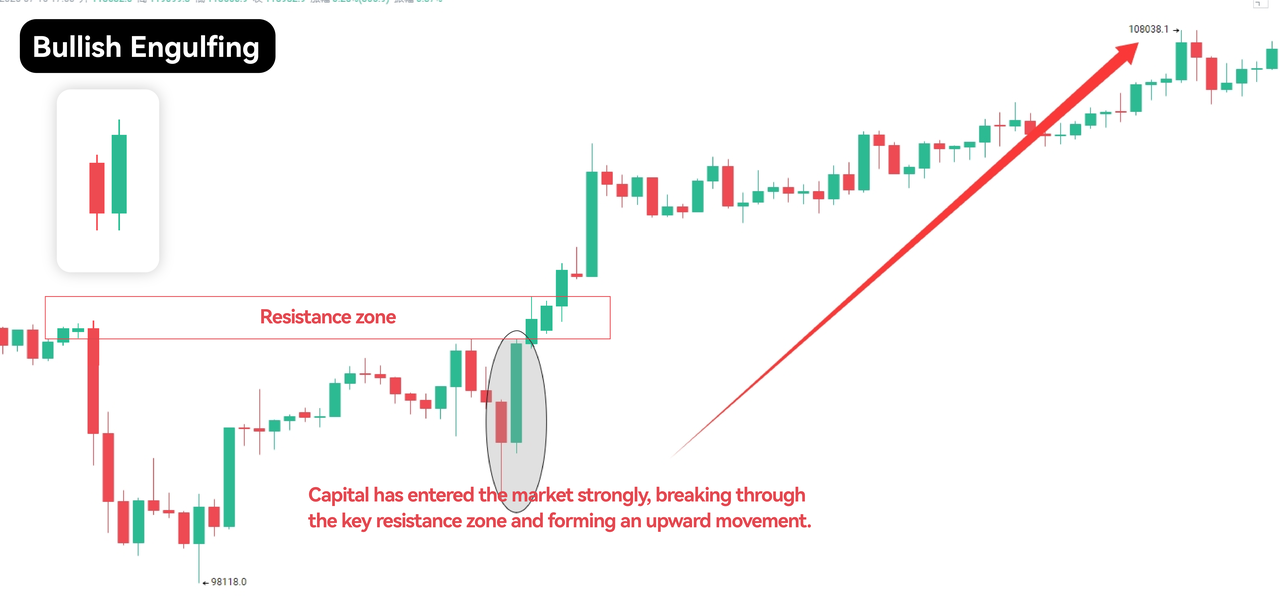
If the Bullish Engulfing pattern appears during a downtrend, it is interpreted as a strong bullish reversal signal, indicating that buyers have taken control and are pushing prices higher.
To act on this pattern, traders should wait for confirmation of the trend reversal — such as a break above the engulfing candle’s high or an uptick in volume — before entering a trade. A stop-loss order should be placed just below the lowest point of the engulfing candlestick to manage downside risk.
Note: For added confirmation, traders can observe bullish continuation signals in the following sessions, such as the formation of higher highs and higher lows. This pattern becomes more reliable on higher timeframes, particularly in derivatives markets like BTC/USDT Futures, where observing it on the 4-hour chart or longer provides better confirmation and reduces noise.
The Bullish Engulfing pattern is considered highly significant, as it often precedes a notable price increase and marks the transition from bearish pressure to renewed bullish momentum.
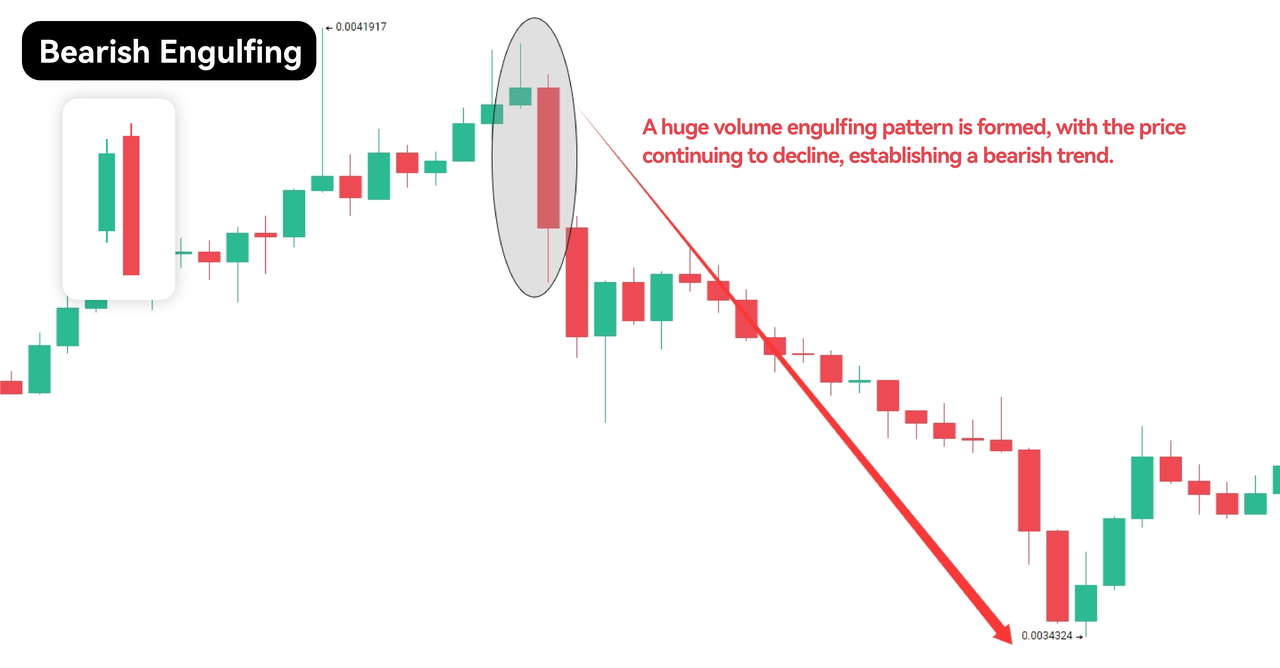
2.Bearish Engulfing Pattern
The Bearish Engulfing pattern is the counterpart to the Bullish Engulfing setup. It forms when a small bullish K-line (candlestick) is immediately followed by a larger bearish K-line that completely engulfs the body of the previous candle.
This pattern often appears at the end of an uptrend or a temporary rally within a broader downtrend, signaling that selling pressure has overtaken buying momentum. The engulfing bearish candle suggests that bears have gained control and may push prices lower.
Note: This pattern reflects weakness in the current uptrend, indicating that selling pressure is building. To confirm the Bearish Engulfing signal, traders should wait for the price to close below the low of the second (bearish) K-line, which confirms the shift in momentum.
In derivatives markets such as BTCUSDT Futures, it’s recommended to observe this pattern on a 4-hour chart or higher, as higher timeframes reduce market noise and improve reliability.
3.Piercing Line Pattern
The Piercing Line pattern is a bullish reversal formation that occurs after a downtrend. It consists of two candles:
- A bearish K-line showing continued downward pressure
- A bullish K-line that opens below the previous low but closes above the midpoint of the previous candle
This formation signals that buyers have stepped in aggressively, reversing early losses and reclaiming control by the close of the session. The deeper the bullish candle pierces into the previous one, the stronger the reversal signal.
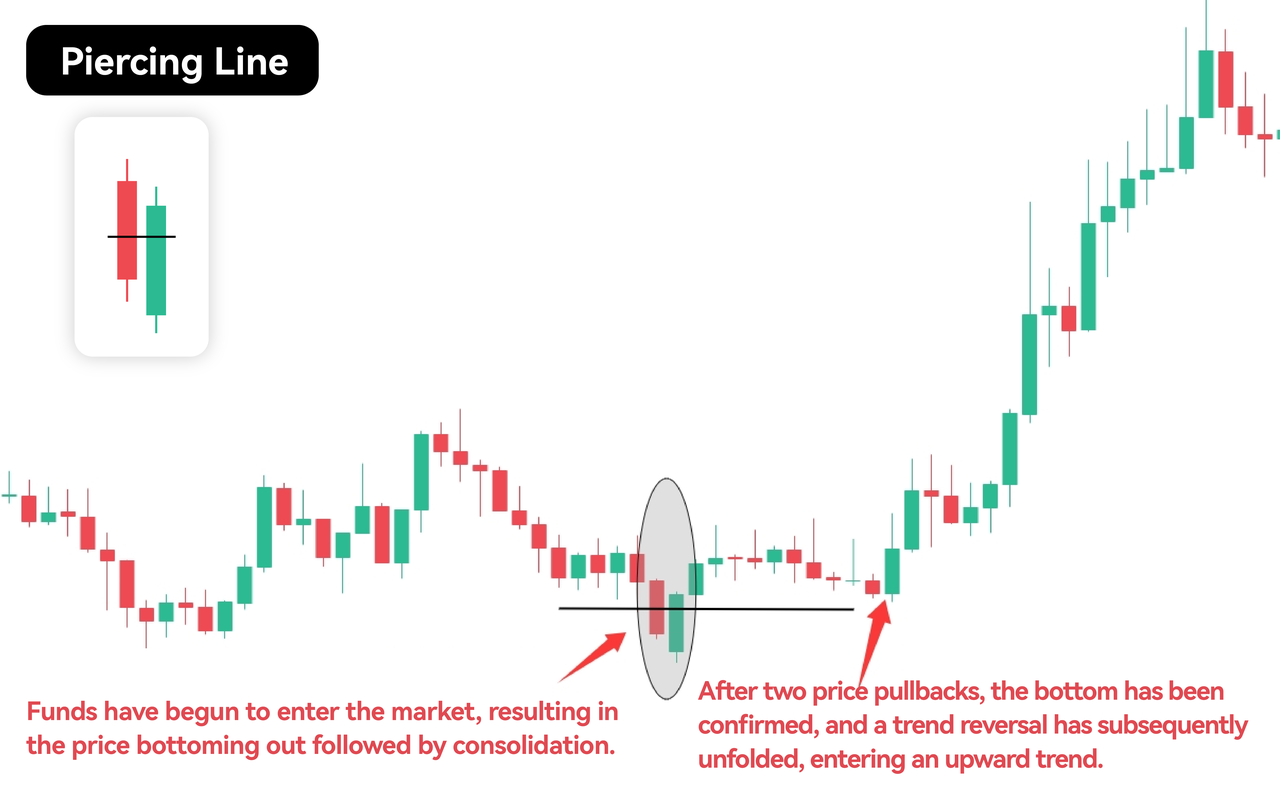
This pattern is often seen as a bullish signal, indicating renewed buying pressure in the market and possibly the beginning of an uptrend. It typically forms at the bottom of a downtrend, where sellers begin to lose control and buyers push prices back up.
However, it's crucial to recognize that this could signal a short-term rebound rather than a full reversal — especially in volatile markets.
Note: To confirm the pattern:
- Look for higher highs in the following sessions
- Monitor volume for signs of accumulation
- Place a stop-loss below the recent low to limit downside risk
- If confirmed, traders can consider entering long positions with tight stops to capture the initial phase of the new trend while maintaining risk management.
4.Dark Cloud Cover Pattern
The Dark Cloud Cover is a bearish reversal pattern, acting as the counterpart to the Piercing Line. It forms when a bullish K-line is followed by a bearish K-line that:
- Closes near or below the midpoint of the previous bullish candle.
- The closing price is close to the midpoint of the previous bullish candle.
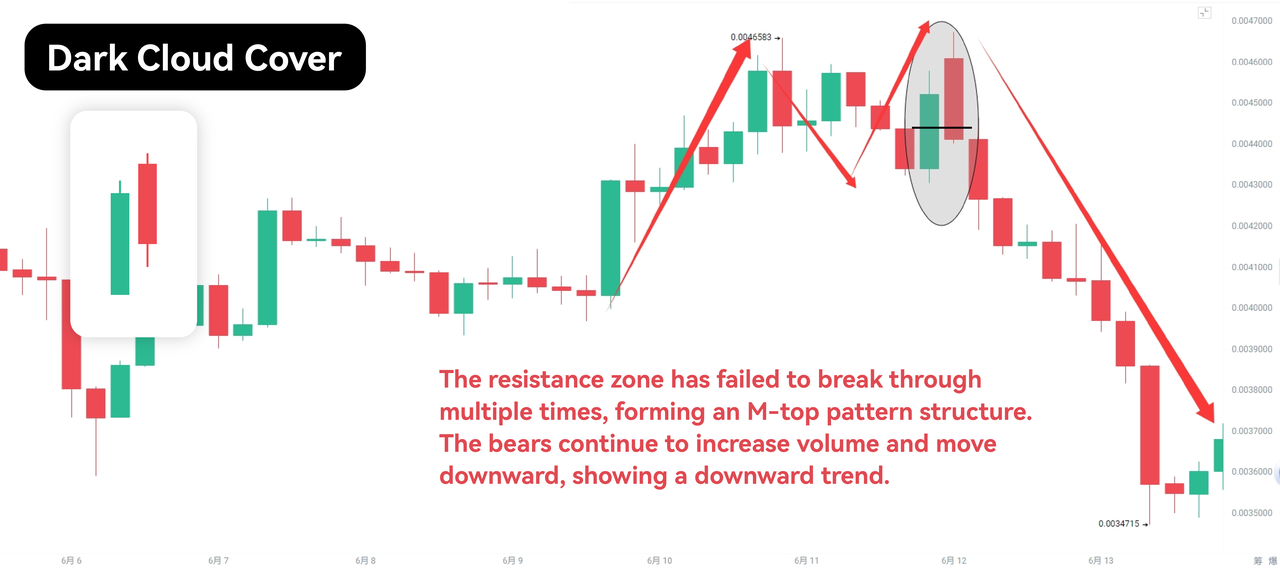
This may indicate that the trend may reverse into a downtrend. In this case, traders should pay attention to changes in market sentiment and act accordingly. Dark cloud cover patterns are considered more reliable when they appear after a prolonged uptrend or near resistance levels, as this suggests increased selling pressure.
Note: Traders can use the dark cloud cover pattern in combination with other indicators such as support and resistance zones, oscillators, or moving averages to identify potential reversals. It is important to note that the dark cloud cover pattern alone is not enough for making trading decisions and should always be confirmed with additional market analysis tools.
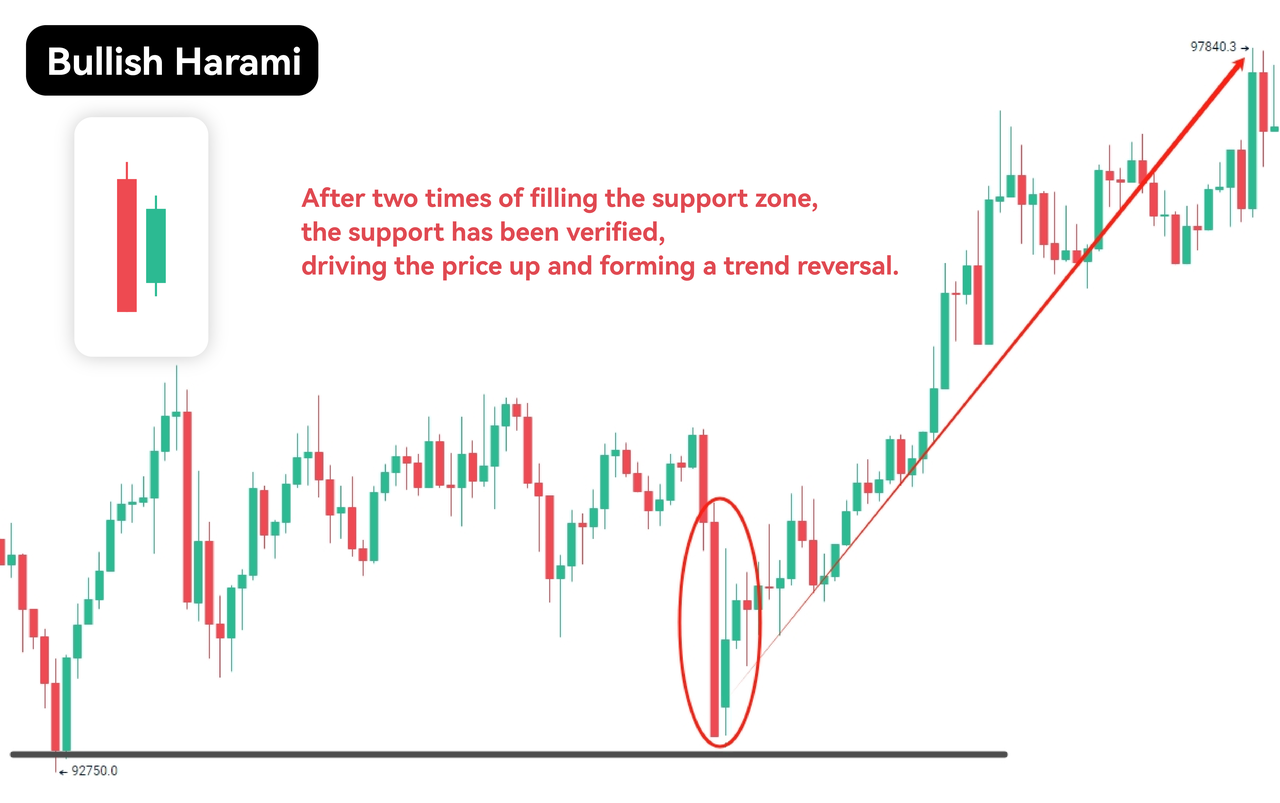
5.Bullish Harami
The bullish harami pattern appears after a large bearish candlestick, followed by a smaller bullish candlestick. The body of the smaller bullish candle is completely contained within the body of the previous day’s bearish candle. This pattern may indicate that the trend could reverse into an uptrend.
However, it’s important to note that the bullish harami does not always guarantee a trend reversal and should be analyzed in conjunction with other market indicators for confirmation.
Note: Traders should also be aware of possible false breakouts, in which the price breaks through the range established by the first and second K-lines and then returns to the range.
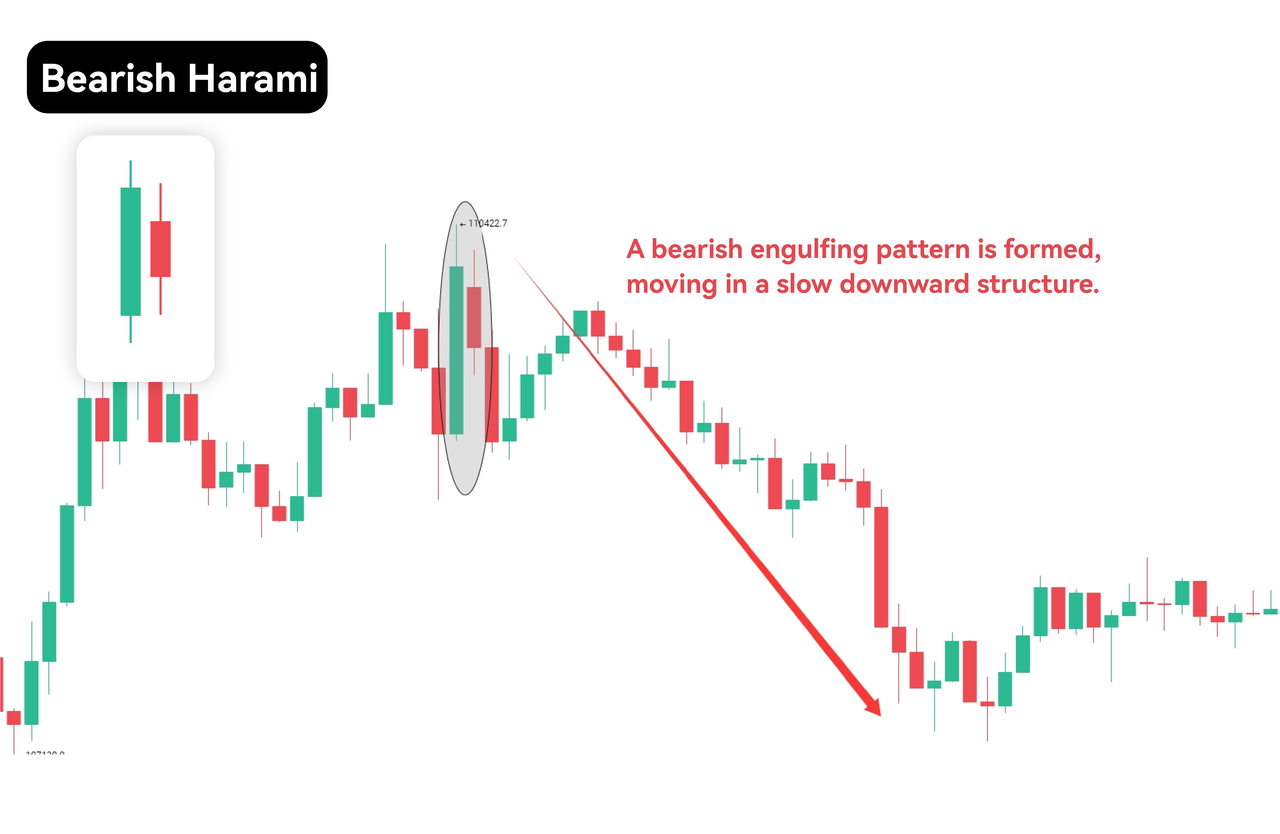
6.Bearish Harami
The bearish harami pattern is the opposite of the bullish harami. It appears after a large bullish candlestick, followed by a smaller bearish candlestick, the body of which is completely contained within the body of the previous day’s candle. This pattern indicates that the trend may reverse into a downtrend.
Traders should pay close attention to potential bearish harami formations and act accordingly. However, it’s important to note that this pattern can fail and does not always signal a trend reversal. Therefore, traders should exercise caution and confirm with additional indicators before making trading decisions.
Note: In addition, reversals should be confirmed in conjunction with other indicators such as volume, moving averages, and oscillators. By integrating these tools, traders can more effectively evaluate their strategies and increase the likelihood of success. A bearish candlestick pattern is generally considered a reliable signal that the price may move lower.
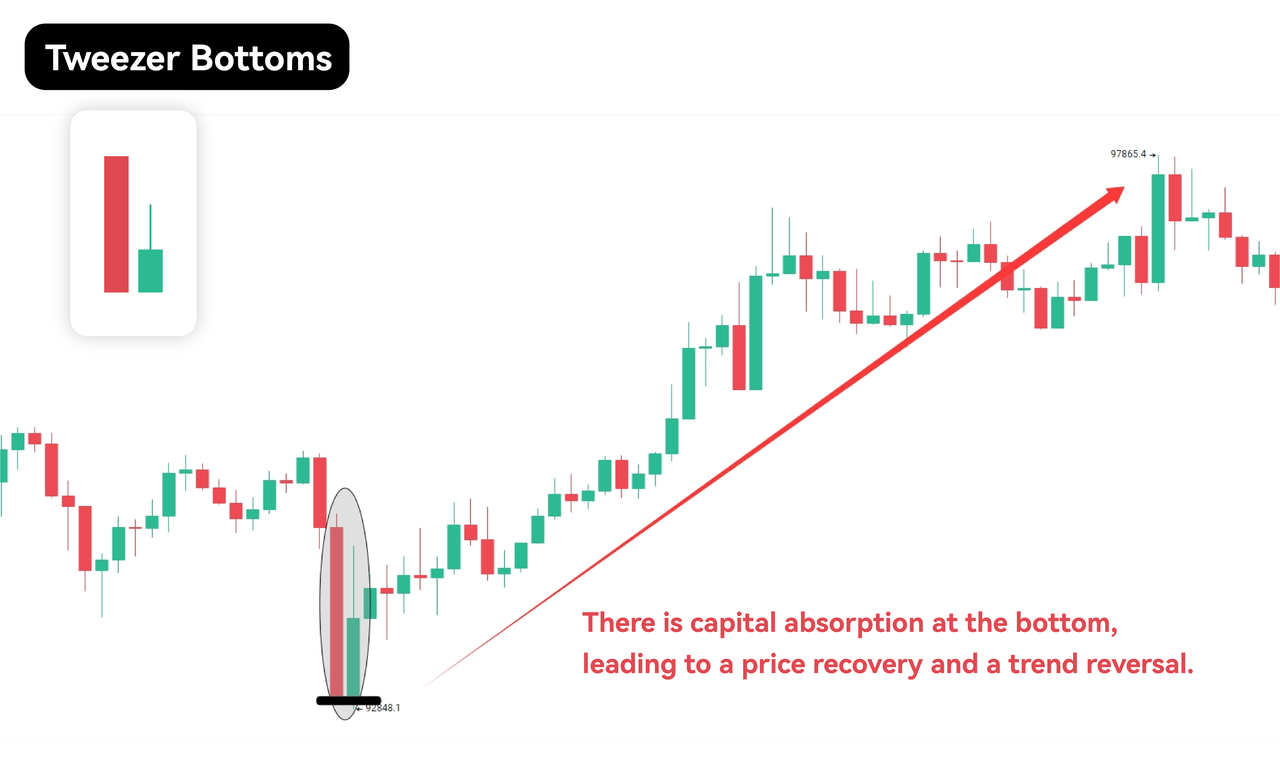
7.Tweezer Bottoms
The Tweezer Bottom pattern forms when two or more candlesticks share the same or very similar low price, indicating that buyers are stepping in at that support level. This pattern suggests that the trend may reverse into an uptrend.
Tweezer Bottoms can help traders identify potential entry points for long trades. However, before taking a position, traders should always look for confirmation signals from other technical indicators such as volume surges, RSI divergences, or moving average crossovers.
Note: In addition, traders should set their stop-loss just below the lowest point of the candlestick that forms the Tweezer Bottom pattern, to limit potential losses if the market does not move as anticipated. While the Tweezer Bottom can signal a potential reversal, it is not always reliable and should be used alongside other technical indicators for confirmation.
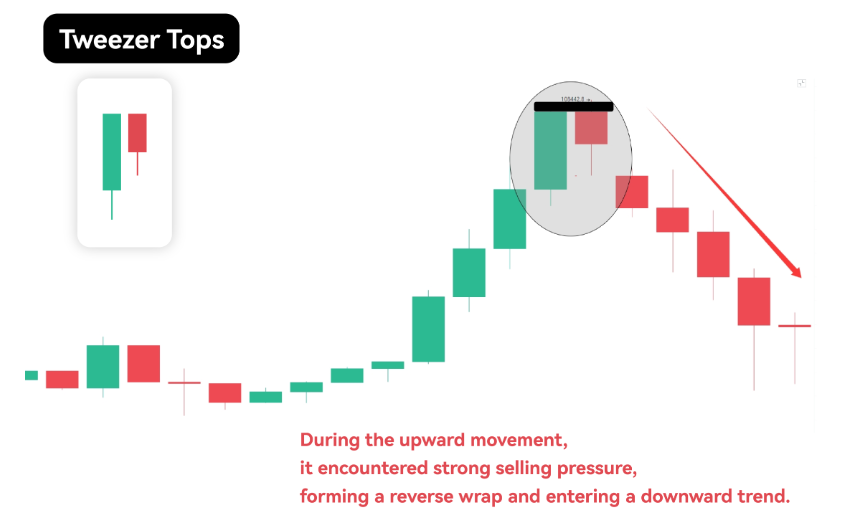
8.Tweezer Tops
The Tweezer Top pattern is the opposite of the Tweezer Bottom. When two or more K-lines share the same highest price, it suggests that sellers are entering the market at that level. This pattern may indicate that the trend could reverse into a downtrend. Traders should look for a bearish K-line to form after the Tweezer Top to confirm a potential reversal.
Once a bearish K-line is confirmed, traders may consider entering a short position at the market open and placing a stop-loss just above the highest point of the Tweezer Top. Monitoring trading volume is essential, a spike in volume often strengthens the signal of a trend reversal.
Note:The Tweezer Top pattern may also act as a sign of strong resistance. If price action is repeatedly rejected at the same level, it can be interpreted as a “ceiling” that limits further gains. In such cases, traders should closely monitor the bearish signal and prepare for potential short positions if the resistance remains unbroken.
Disclaimer
This article does not provide:
(i) investment advice or investment recommendations;
(ii) an offer or solicitation to buy, sell, or hold digital assets;
(iii) financial, accounting, legal, or tax advice.
Digital assets, including stablecoins and NFTs, involve high risk and may fluctuate significantly. Consider whether trading or holding digital assets is appropriate for you given your financial situation. Consult a qualified legal, tax, or investment professional when needed. You are responsible for understanding and complying with applicable local laws and regulations.
About Bitunix
Bitunix is a global cryptocurrency derivatives exchange trusted by over 3 million users across more than 100 countries. At Bitunix, we are committed to providing a transparent, compliant, and secure trading environment for every user. Our platform features a fast registration process and a user-friendly verification system supported by mandatory KYC to ensure safety and compliance. With global standards of protection through Proof of Reserves (POR) and the Bitunix Care Fund, we prioritize user trust and fund security. The K-Line Ultra chart system delivers a seamless trading experience for both beginners and advanced traders, while leverage of up to 200x and deep liquidity make Bitunix one of the most dynamic platforms in the market.
Bitunix Global Accounts
X | Telegram Announcements | Telegram Global | CoinMarketCap | Instagram | Facebook | LinkedIn | Reddit | Medium