
Three K-Line Forms
A three K-line pattern is a technical analysis method used to identify either the formation or reversal of a price trend. This pattern occurs when three consecutive K-lines show gradually rising or falling highs and lows. Depending on the specific formation, it can signal a trend continuation or a possible reversal.
The pattern relies on the idea that prices often follow recognizable movements, making it a useful tool for anticipating future price action. However, like all technical indicators, it should be used alongside other tools for confirmation. Three K-line formations are especially helpful for spotting early trend shifts or momentum changes in the market.
1.Morning Star
The Morning Star is a bullish reversal pattern. It forms when a long bearish K-line is followed by a small-bodied K-line that gaps down, then a long bullish K-line that gaps up. This structure suggests the potential beginning of an uptrend.
The initial bearish K-line represents strong selling pressure. The small-bodied K-line indicates indecision or a pause in downward momentum. Finally, the long bullish K-line reflects renewed buying interest, often signaling that the bulls are regaining control.
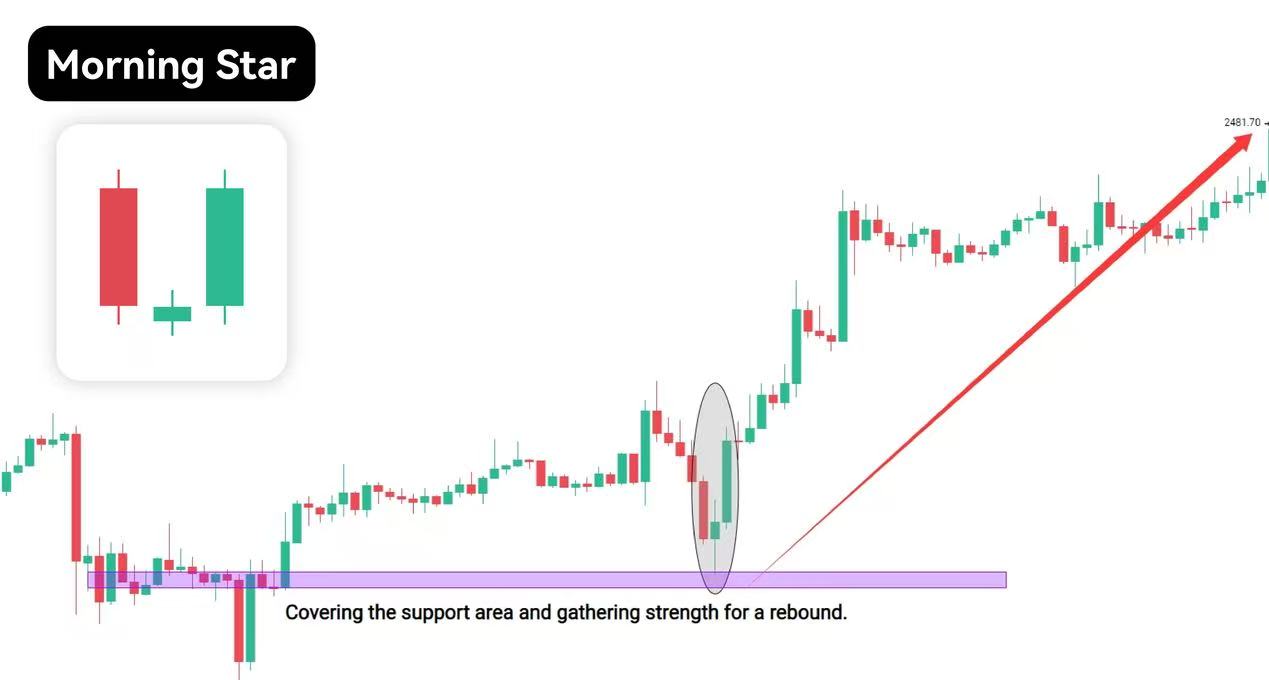
Note: the long bullish candle signals that buying pressure has strengthened and bulls have taken control of the market. Traders should look for potential reversals by observing trading volume and other supporting technical indicators. If the Morning Star appears during an uptrend, it may signal a bullish reversal. Conversely, if it forms during a downtrend, it typically indicates a shift toward a bullish reversal.
2.Evening Star
The Evening Star is the opposite of the Morning Star and represents a bearish reversal pattern. It forms when a long bullish K-line is followed by a small-bodied K-line that gaps up, then a long bearish K-line that gaps down. This setup suggests the potential for a trend reversal to the downside.
Traders should note that the Evening Star is only considered significant when it appears at the top of an uptrend. If it forms at the bottom of a downtrend, it generally lacks predictive value.
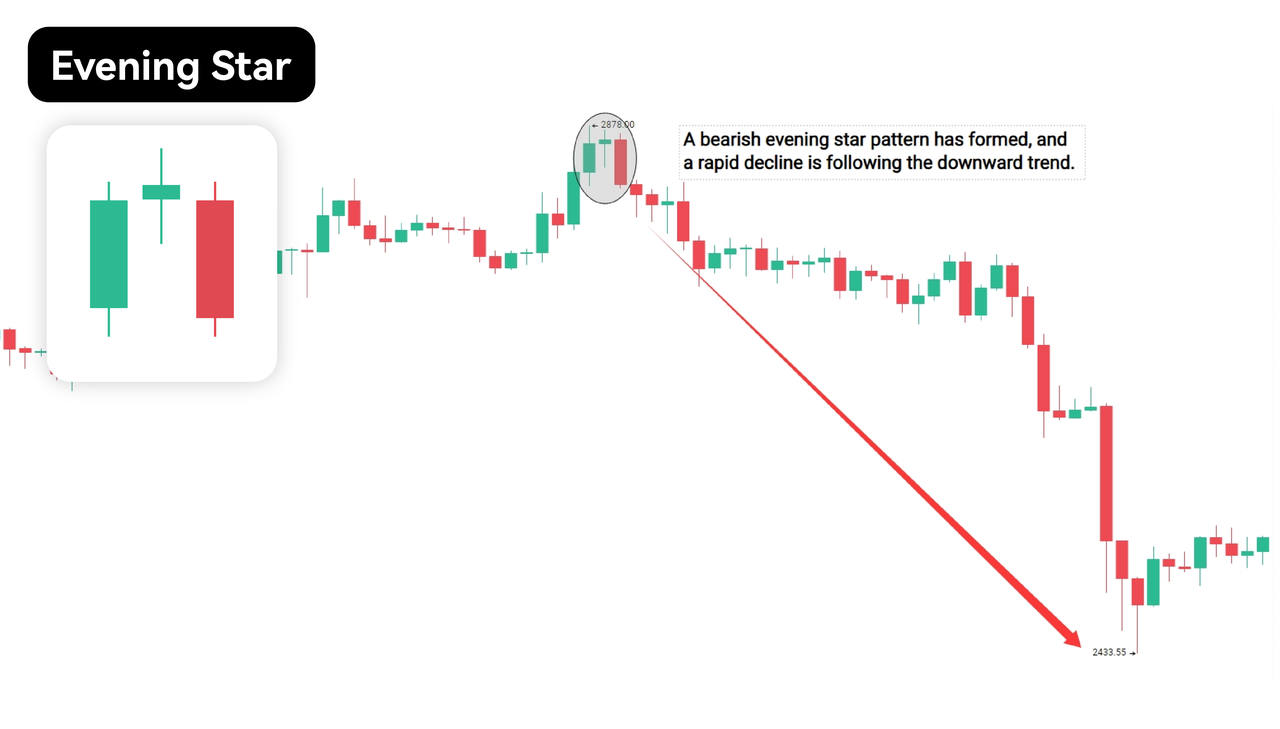
If the price declines after the Evening Star pattern, it often signals that a bearish trend has begun. On the other hand, if the price continues rising, it may suggest that the existing bullish trend remains intact.
Note: Traders should be cautious when interpreting the Evening Star; if there’s no clear confirmation from price action, it could result in a false signal. It’s also important to remember that no single pattern or indicator can fully predict future price movements—confirmation from other tools is essential.
3.Three White Soldiers
Three White Soldiers is a bullish reversal pattern made up of three consecutive bullish (positive) K-lines. Each candle opens within or slightly above the previous candle's body and closes at a higher price, forming a steady upward trend.
This pattern typically appears after a downtrend and signals strong buying pressure, suggesting a potential shift toward an upward trend. Traders often view the Three White Soldiers as an indication that market sentiment has turned positive and a sustained rally may follow.
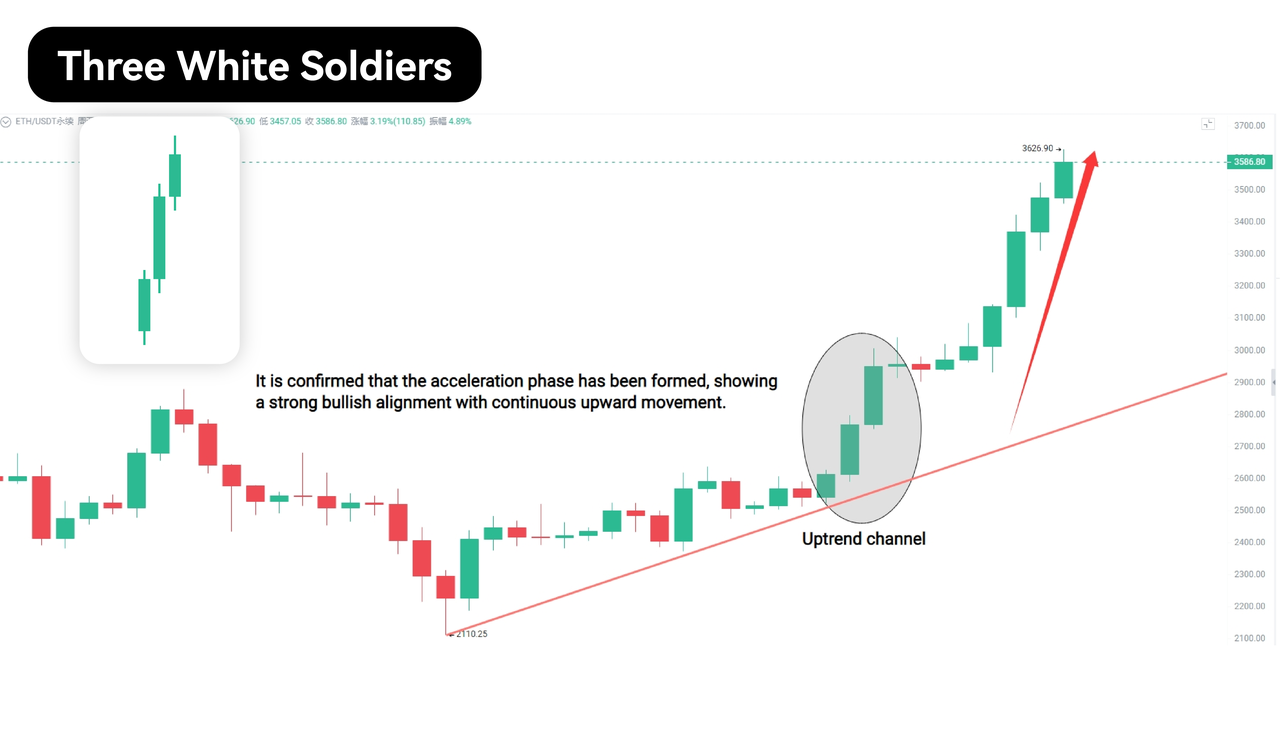
Note: To form the Three White Soldiers pattern, the opening price of each of the three K-lines must fall within the body of the previous candle, showing a steady and controlled rise. Each candle’s closing price should be higher than the previous candle’s opening price, reflecting growing bullish momentum and market confidence.
4.Three Black Crows
The Three Black Crows pattern is the bearish counterpart to the Three White Soldiers. It appears when three consecutive bearish (negative) K-lines form, each opening within or slightly below the previous candle’s body and closing lower.
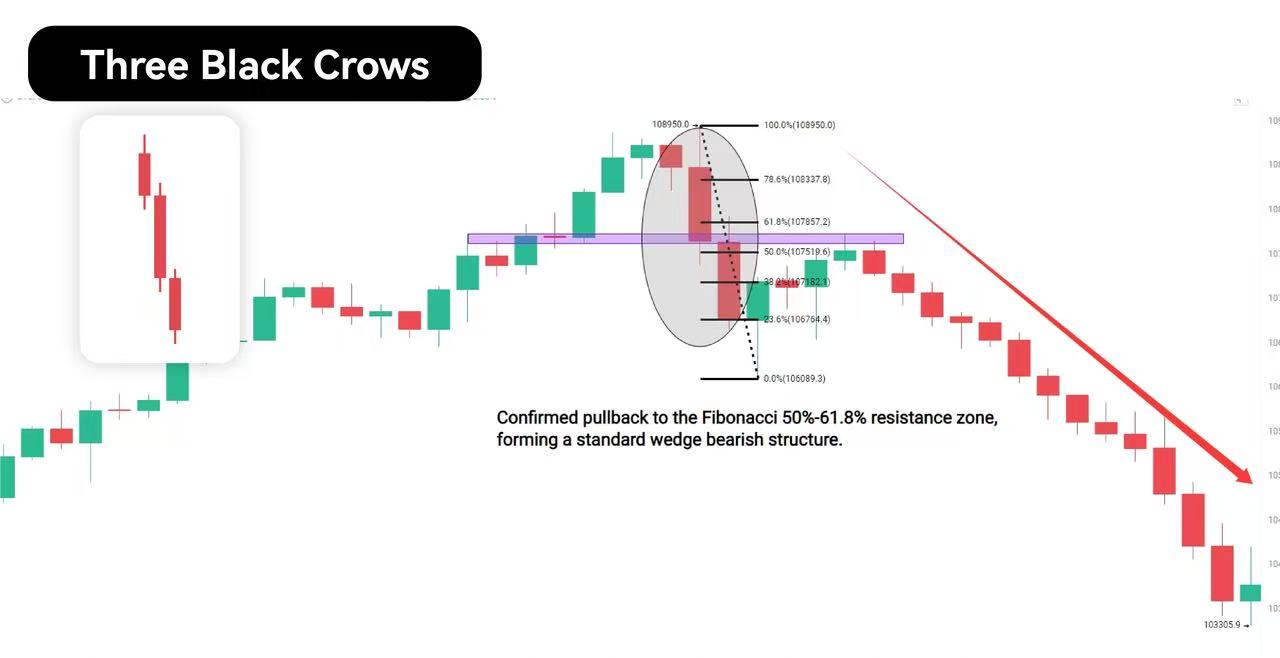
Note: The Three Black Crows pattern is especially significant when it appears after a strong uptrend or a prolonged period of sideways movement. It often serves as a warning that the bullish momentum has weakened and sellers are taking control. However, like all technical signals, this pattern should be confirmed using other indicators or volume analysis to avoid false interpretations.
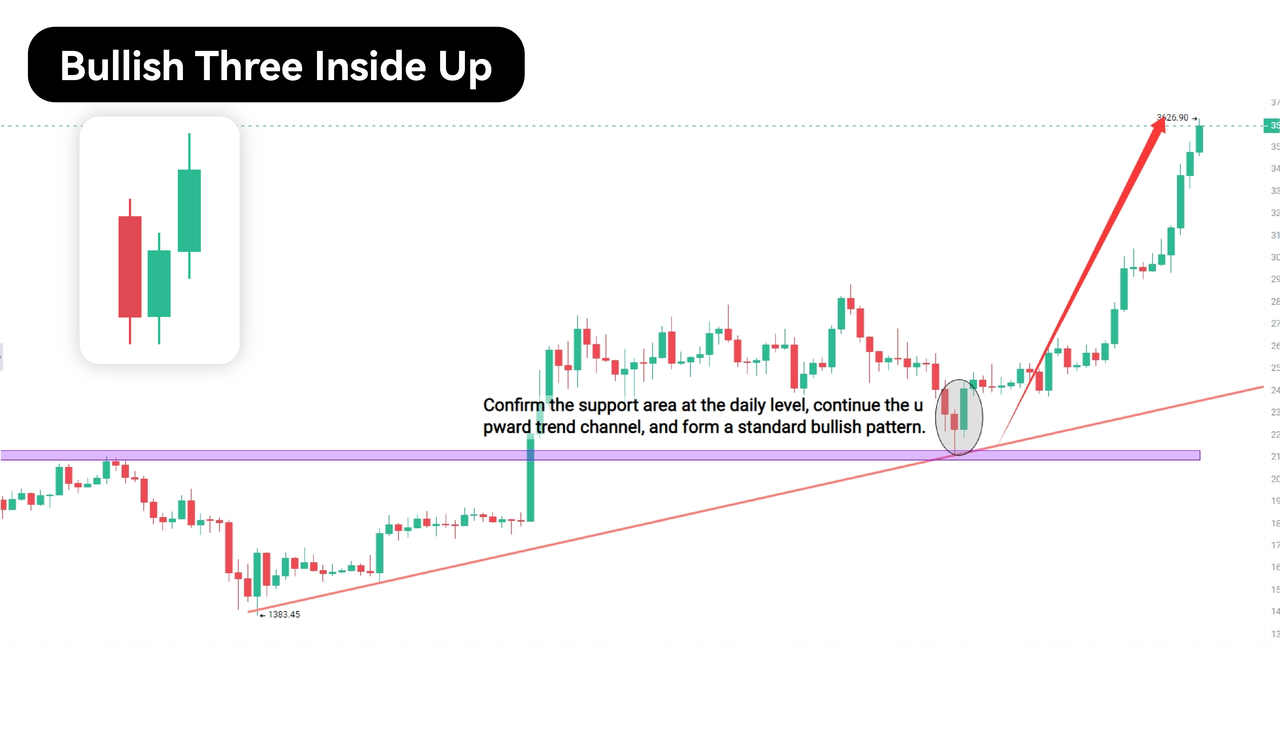
5.Bullish Three Inside Up
The Three Inside Up is a bullish reversal pattern that typically forms after a strong downtrend. It begins with a long bearish K-line, followed by a small bullish K-line that is completely contained within the body of the previous candle. The third candle is a long bullish K-line that closes above the high of the first candle.
This formation suggests that selling pressure is weakening and buyers are starting to regain control. When confirmed by volume or other supporting indicators, it may indicate the start of a new uptrend.
This pattern should be used alongside other technical indicators to confirm the trend direction. Traders are also advised to incorporate fundamental analysis and apply sound risk management strategies when trading this setup.
Note: Steps to trade the Three Inside Up pattern
- Identify the pattern on the chart—typically forming after a prolonged downtrend, suggesting bulls may be entering the market.
- Look for confirmation signals from other technical indicators, such as a moving average crossover or a breakout above a key resistance level.
- Enter a position at the breakout above the pattern’s highest point, and place a stop loss just below the lowest point of the pattern. If executed correctly, this strategy can deliver strong returns in a bullish market.
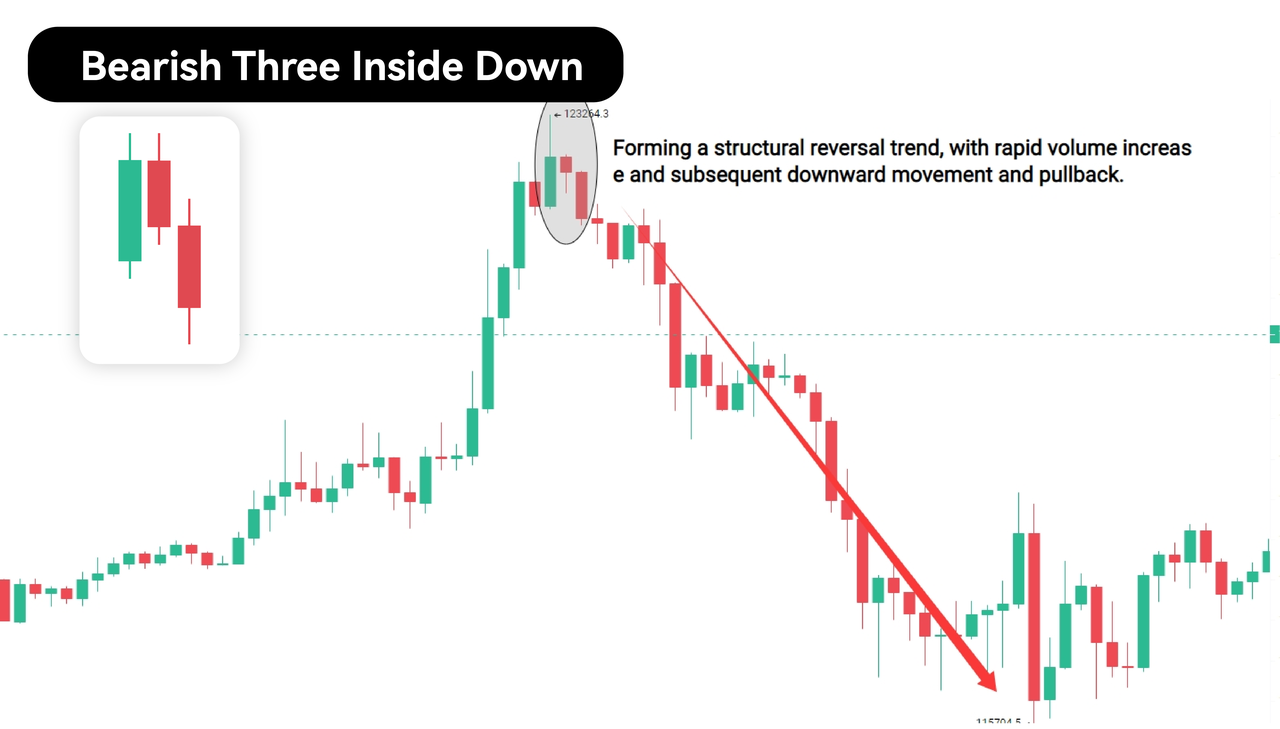
6.Bearish Three Inside Down
The Three Inside Down is the bearish counterpart of the Three Inside Up pattern. It forms after a long bullish K-line, followed by a small bearish K-line that is completely contained within the body of the previous candle, and finally a long bearish K-line that closes below the low of the first candle.
This pattern suggests that upward momentum is weakening and that a downtrend may be emerging. Traders often view it as an early sign of a potential bearish reversal, especially when confirmed by additional technical indicators.
Traders often use this pattern to guide their decision-making. When the Three Inside Down pattern appears, it signals a potential bearish reversal, and traders may consider opening a short position.
Note: this pattern does not guarantee a price decline. It merely suggests that a reversal may be underway and that the probability of further downsides has increased. As always, confirmation from other indicators and proper risk management are essential before taking action.
Disclaimer
This article does not provide:
(i) investment advice or investment recommendations;
(ii) an offer or solicitation to buy, sell, or hold digital assets;
(iii) financial, accounting, legal, or tax advice.
Digital assets, including stablecoins and NFTs, involve high risk and may fluctuate significantly. Consider whether trading or holding digital assets is appropriate for you given your financial situation. Consult a qualified legal, tax, or investment professional when needed. You are responsible for understanding and complying with applicable local laws and regulations.
About Bitunix
Bitunix is a global cryptocurrency derivatives exchange trusted by over 3 million users across more than 100 countries. At Bitunix, we are committed to providing a transparent, compliant, and secure trading environment for every user. Our platform features a fast registration process and a user-friendly verification system supported by mandatory KYC to ensure safety and compliance. With global standards of protection through Proof of Reserves (POR) and the Bitunix Care Fund, we prioritize user trust and fund security. The K-Line Ultra chart system delivers a seamless trading experience for both beginners and advanced traders, while leverage of up to 200x and deep liquidity make Bitunix one of the most dynamic platforms in the market.
Bitunix Global Accounts
X | Telegram Announcements | Telegram Global | CoinMarketCap | Instagram | Facebook | LinkedIn | Reddit | Medium