
How do continuation pattern candlesticks function in technical analysis?
Continuous patterns are technical analysis tools used to determine the future direction of the market. They are based on observing price action over a period of time and using this data to predict the continuation or reversal of a trend.
Continuous patterns can be used to determine entry points for buying or selling and provide an indication of the current trend strength, thus helping traders to determine how long a trend is likely to last. By analyzing sustained patterns, traders can anticipate market movements in advance and make better trading decisions.
1、Rising Three Methods
Rising Three is a bullish continuous pattern. When a long positive line is followed by three small solid negative lines, the range of these negative lines is included in the range of the first positive line, and the last is formed when a long positive line. This pattern indicates the continuation of the upward trend.
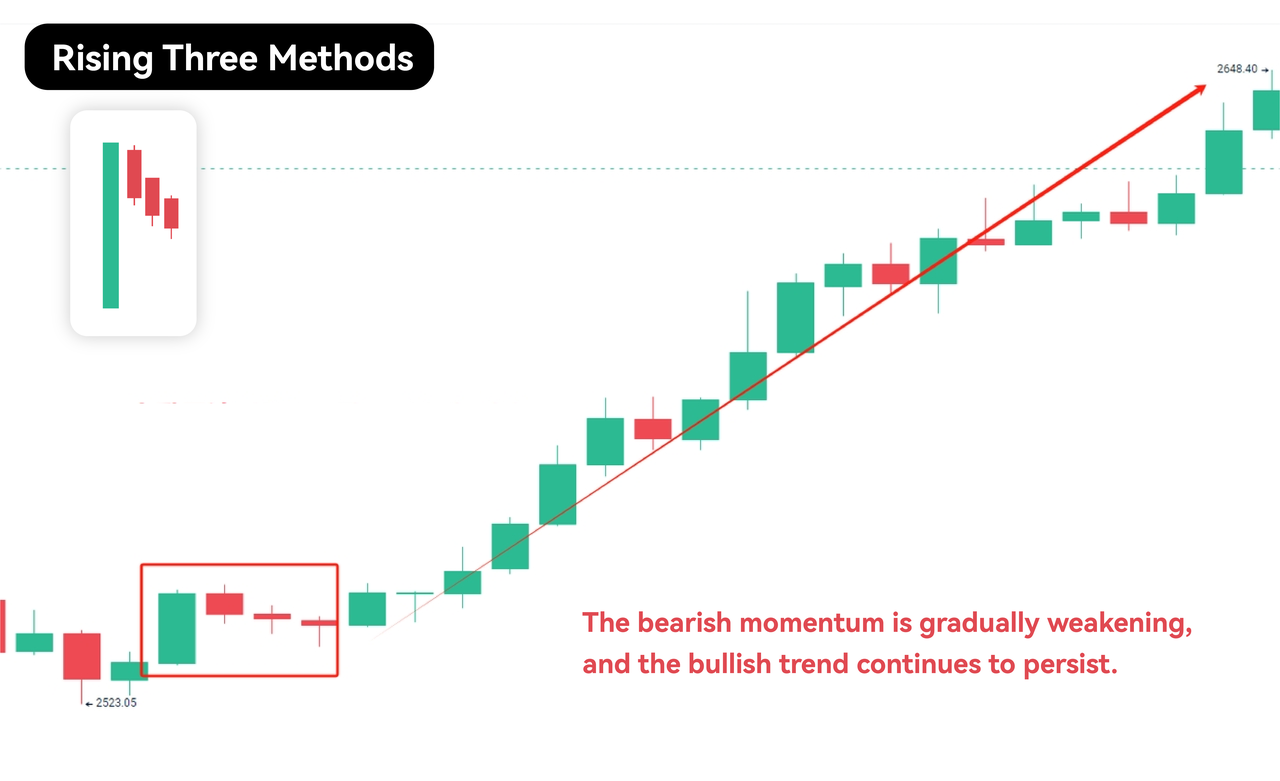
Note:The three-way pattern can also be called the "three-way reversal pattern" and is a strong reversal signal. When the closing price of the third K-line is higher than the high point of the first K-line, the trader should enter a long position. It is important to note that when trading this pattern, further confirmation of the signal may be required before taking action.
2、Falling Three Methods
As opposed to the rising three, the falling three is a bearish continuous pattern. When a long negative line is followed by three small solid positive lines, the range of these positive lines is contained in the range of the first negative line, and the last is formed when a long negative line is formed. This pattern indicates a continuation of the downward trend. When the price falls below the range of the third K line and is below its low, traders should look for bearish signals to establish a short position.
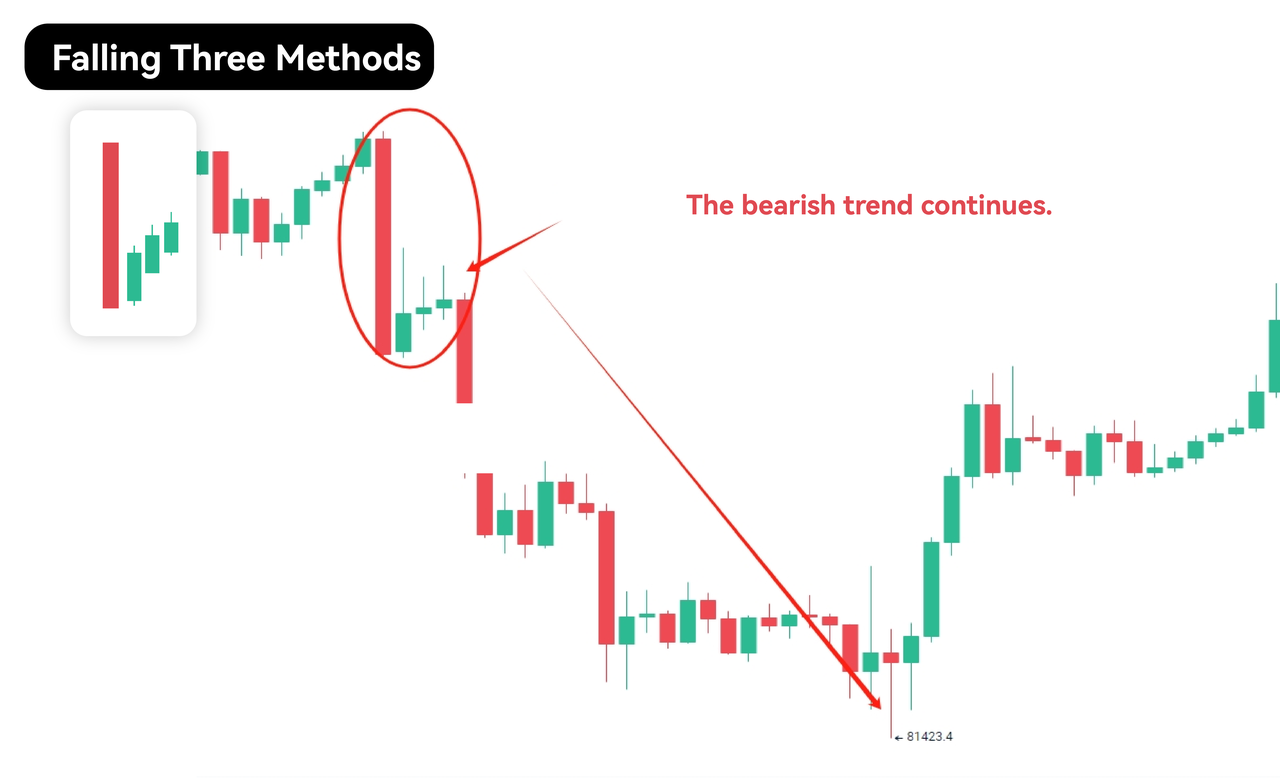
Note:In order to prevent a price reversal, a stop loss can be placed above the high point of the third K-line. The three-down method is considered to be one of the more reliable sustained patterns. However, it is important to note that in a strong uptrend, this pattern may fail, so trade with caution.
3、Bullish Flag Pattern
A bullish flag is a persistent pattern that occurs when a short-term consolidation period follows a sharp uptrend and forms a flag. This pattern may indicate a continuation of an uptrend. The formation of this pattern involves a short period of sideways movement for a few days or weeks after a rapid uptrend, followed by a resumption of upward momentum.
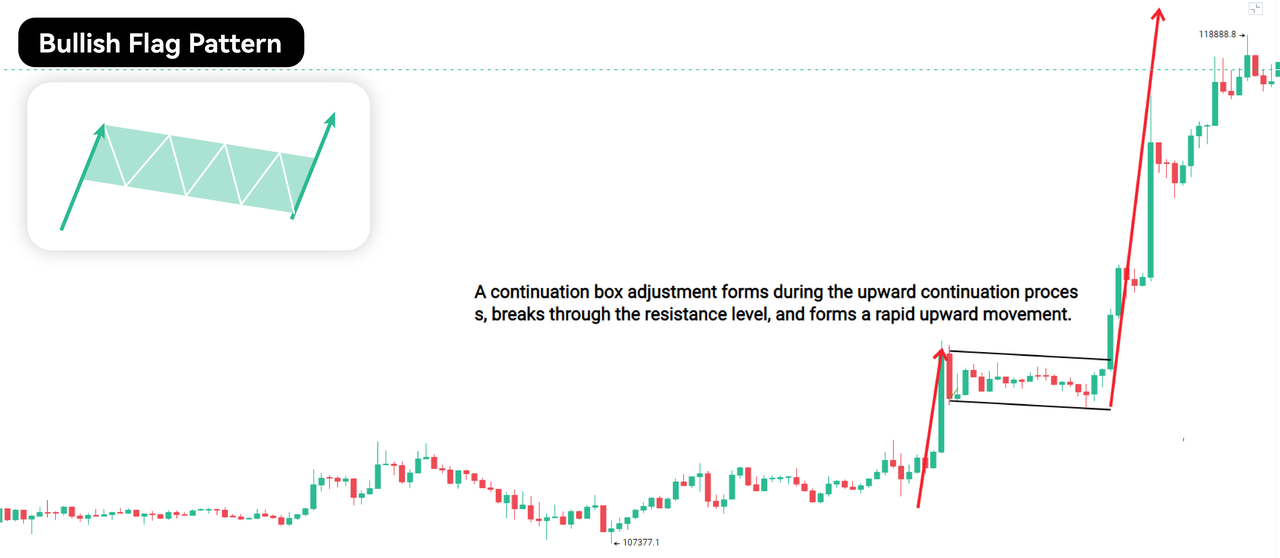
The flag should be formed between two parallel trendlines, where the angle of the lower trendline should exceed 45 degrees. Once the upper trendline is broken, it may indicate the resumption of the uptrend.
Note:Traders should pay attention to the confirmation of volume to ensure that the breakout is effective. When trading the bullish flag, stop-loss orders should be placed below the trend line below to prevent losses due to unexpected price fluctuations. When the price reaches the trend line above the flag or exceeds this point, consider taking profits to maximize gains on successful trades.
4、Bearish Flag
A bearish flag is the opposite of a bullish flag. It occurs when a short-term consolidation period follows a sharp downward trend and a flag is formed. This pattern may indicate a continuation of a downward trend. After the flag is formed, traders may establish a short position in anticipation of further price declines.
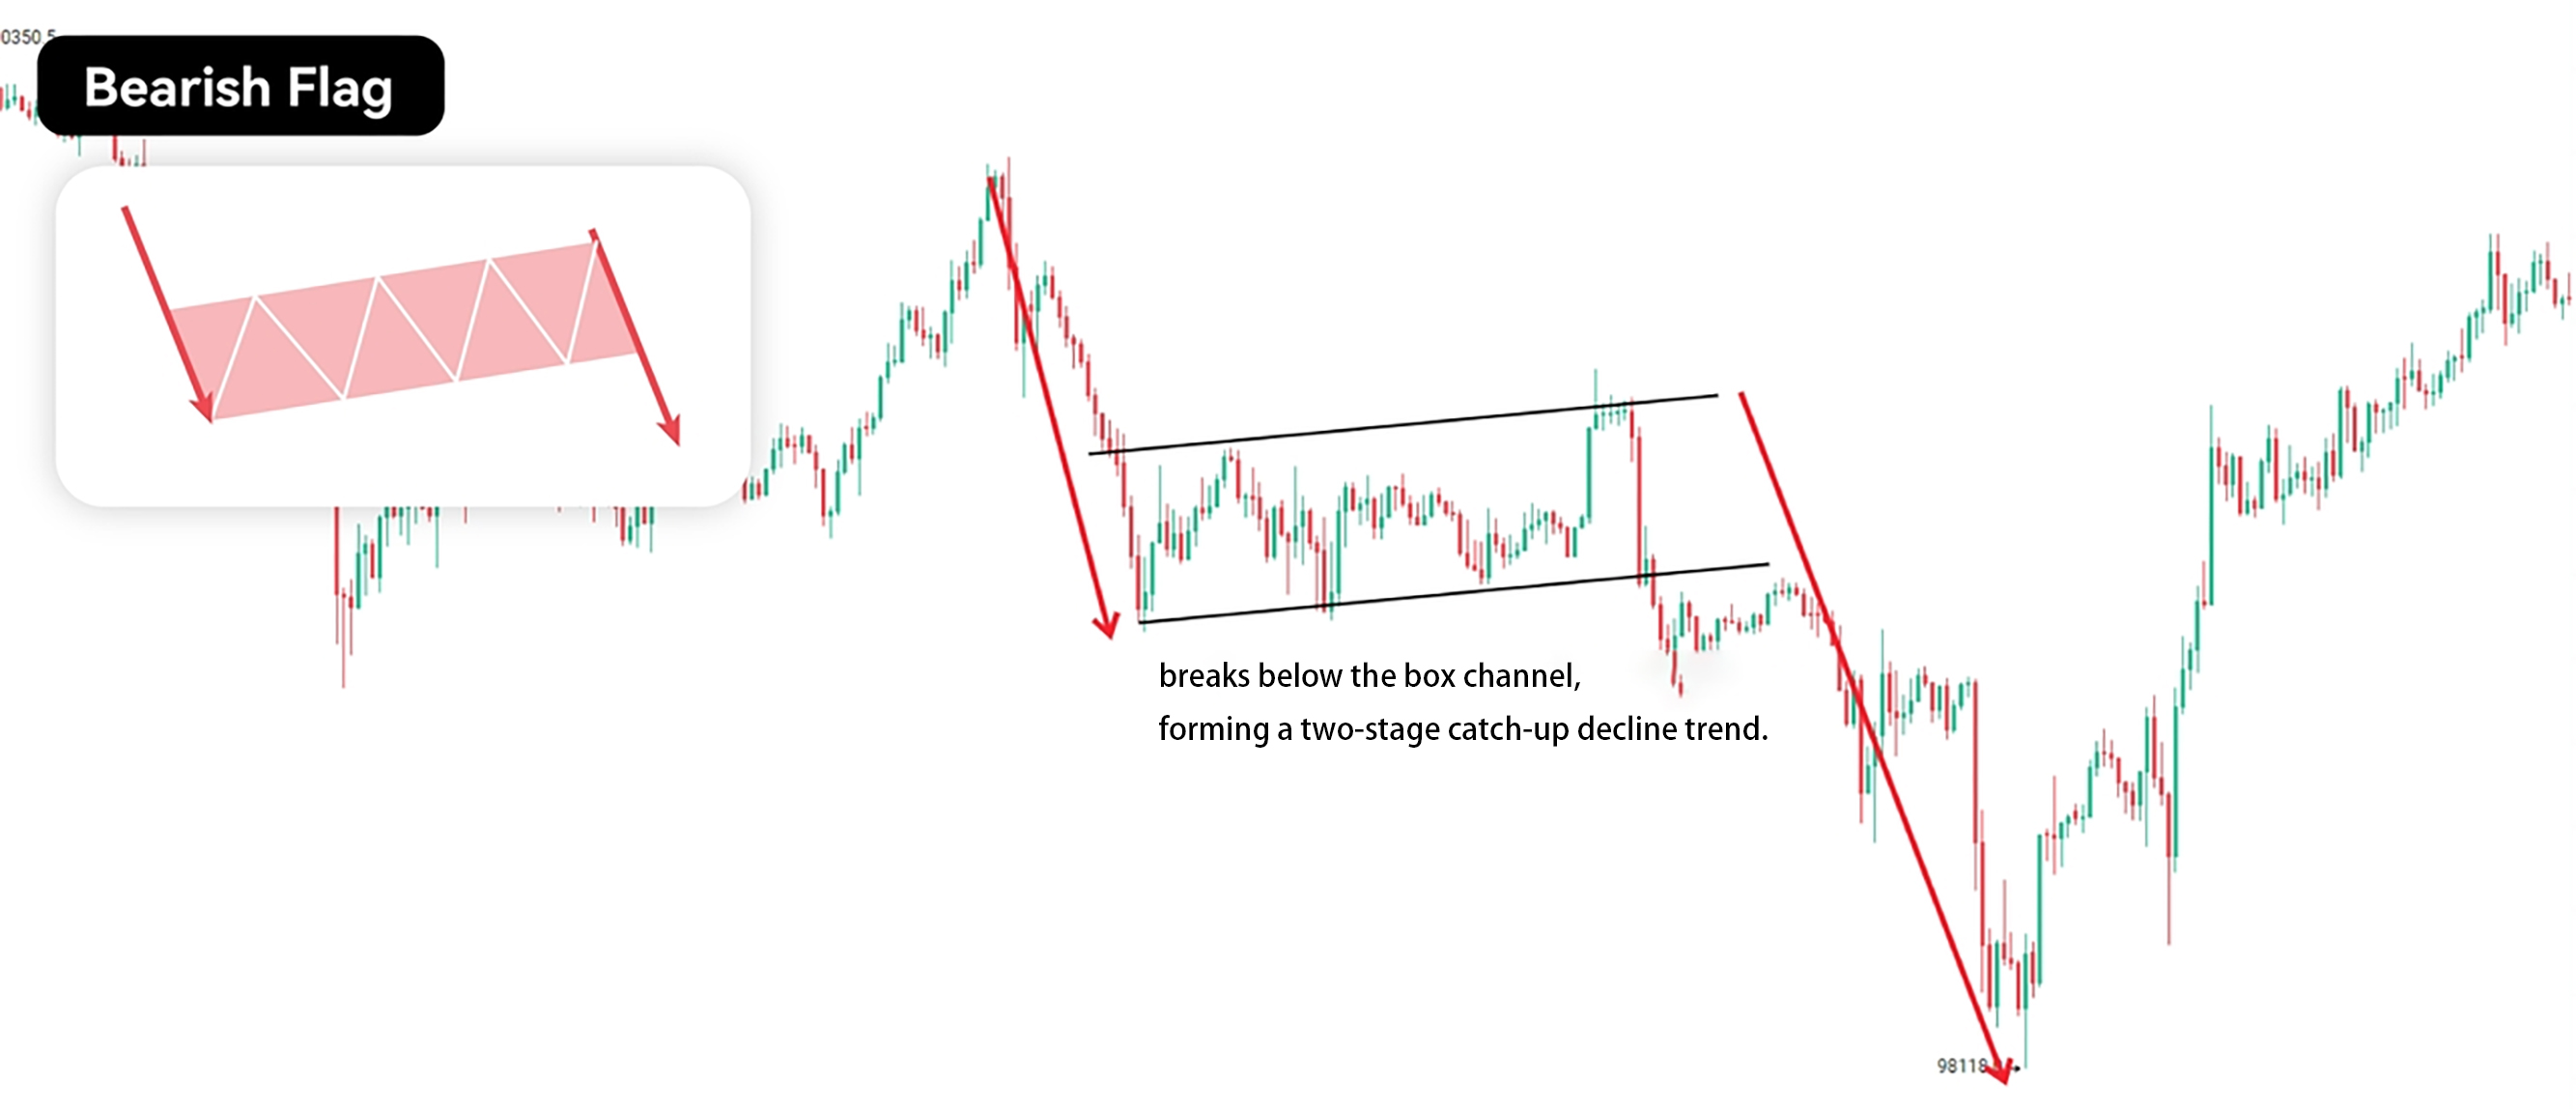
Note:As with all chart patterns, it is important to wait for a confirmation signal before making any trades. Traders should also keep a close eye on volume and momentum to confirm a reversal or continuation of a trend.
5、Bullish Pennant
The bullish pennant pattern is similar to the bullish flag pattern, but its shape is a triangle rather than a rectangle. When a sharp uptrend is followed by a short-term consolidation period and a symmetrical triangle is formed, it may indicate a continuation of the uptrend. Traders should pay attention to the signal of a breakout of the trend line above the triangle and open a long position after confirmation.
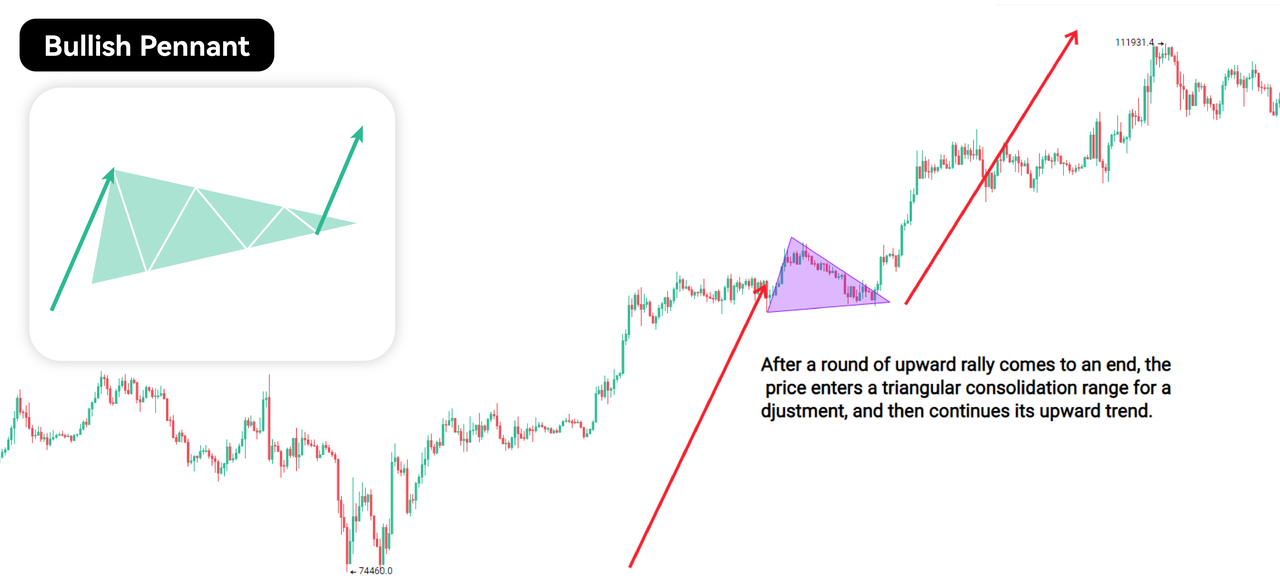
After a breakout, stop losses should be set at the trendline below the flag to prevent further losses. The target price can be calculated by adding the height of the triangle to the breakout point. The target price is usually reached about three weeks after the breakout.
Note:Capturing a market uptrend with the bullish pennant pattern can be a good way to profit. But when trading any pattern, keep in mind that historical performance does not necessarily guarantee future results, and always manage risk carefully.
6、Bearish Pennant
The bearish pennant pattern is the opposite of the bullish pennant pattern. When a sharp downward trend is followed by a short-term consolidation period and a symmetrical triangle is formed, it may indicate a continuation of the downward trend.
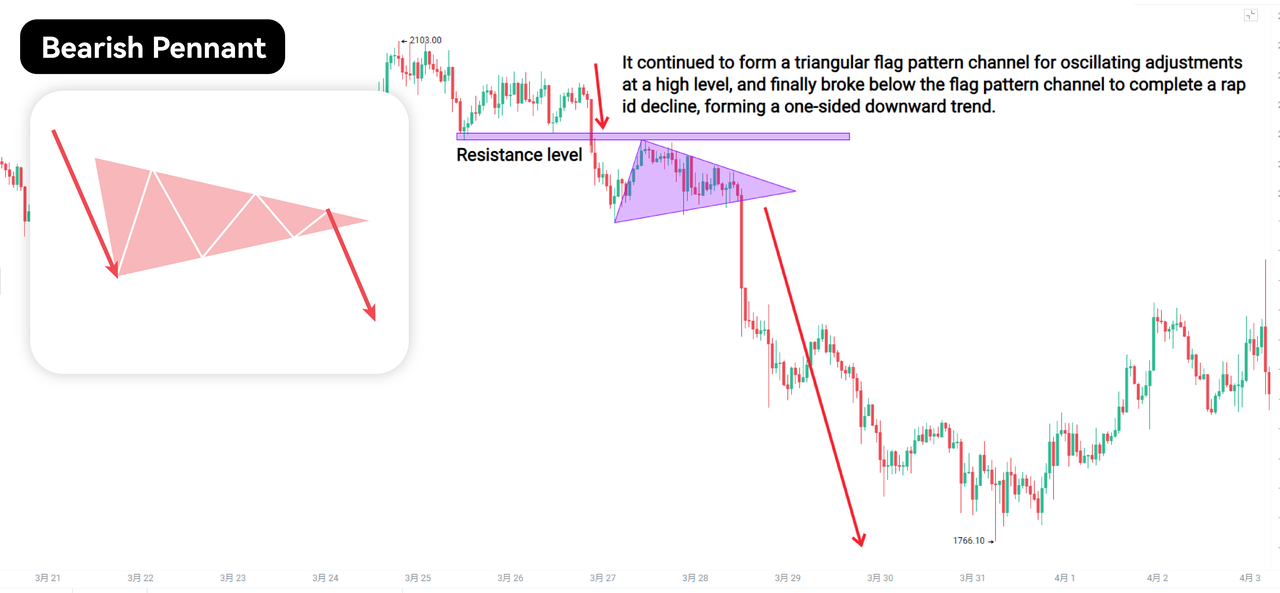
Note:The bearish pennant pattern usually appears in a downtrend and is a signal that the price is likely to fall further. After an initial sharp drop, the bears dominate, pushing the price further down until buying pressure hedging selling pressure. This triggers a brief pause in the price, thus forming a flag shape.
7、Bullish Rectangle
- A bullish rectangle is a continuous pattern that occurs when prices consolidate between two parallel horizontal trendlines. This pattern may indicate a continuation of an uptrend. A rectangle pattern should contain at least two highs and two lows, with the market price fluctuating between trendlines.
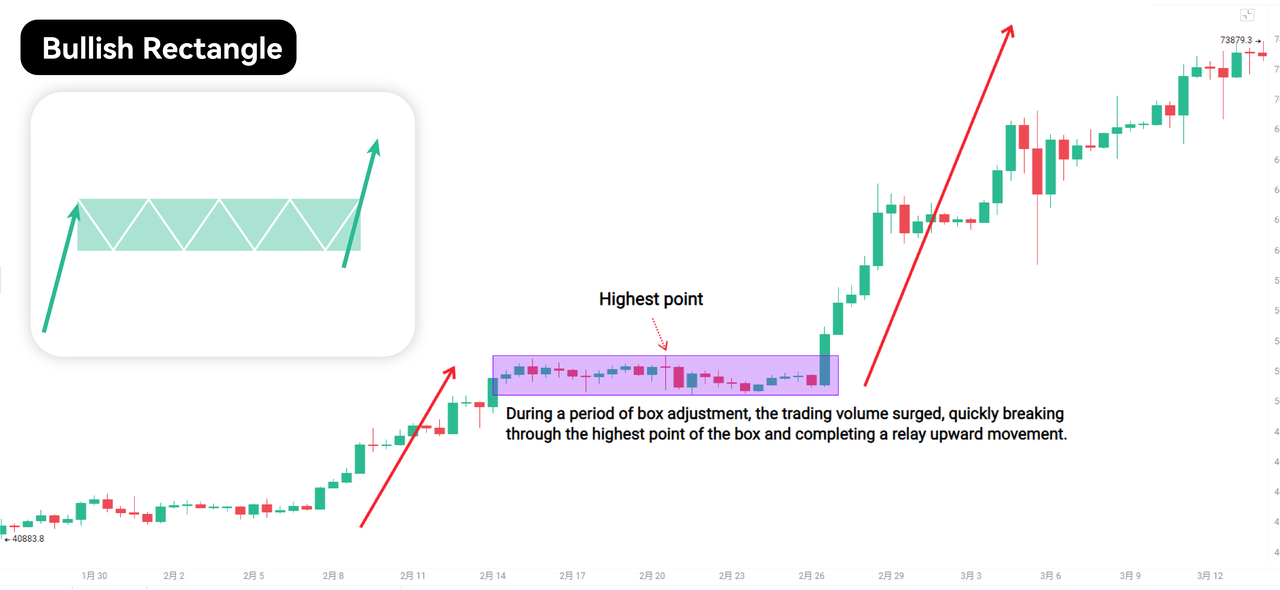
Note:A bullish rectangle is often seen as a sign of a period of uncertainty in market decision-making, when the power of buyers and sellers is relatively balanced. When prices break out of this pattern, it usually indicates an increase in trader motivation, but the direction is usually consistent with the previous trend. Once a breakout occurs, watch for a continuation of the uptrend and consider taking a long position.
8、Bearish Rectangle
A bearish rectangle is the opposite of a bullish rectangle. Formed when the price consolidates between two parallel horizontal trendlines, it may indicate a continuation of a downtrend. A price below the lower trendline confirms a bearish rectangle, which may cause the price to fall further.
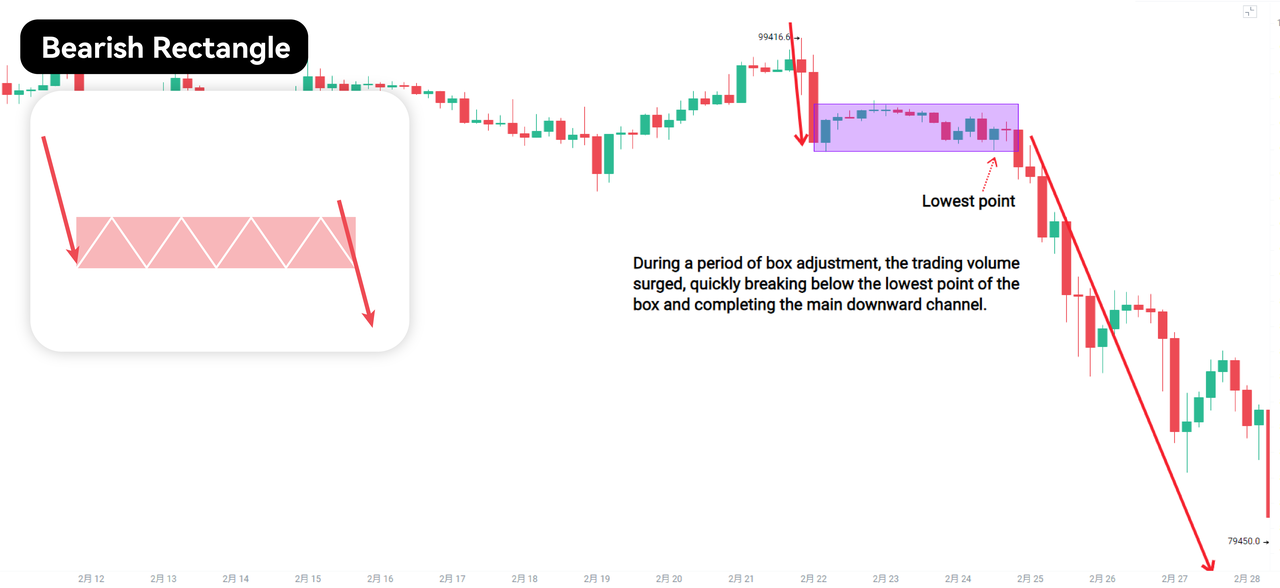
Note:Traders should pay attention to this pattern in order to identify entry and exit points. Before entering a long position, pay close attention to whether the price shows a reversal signal; if the price breaks up from the rectangle pattern, it may indicate that the downtrend has reversed and a new uptrend has begun. By carefully monitoring the rectangle pattern, traders can better prepare entry points and potential reversal signals.
9、Bullish Wedge
A bullish wedge is a persistent pattern that occurs when prices consolidate between two upwardly sloping converging trendlines. This pattern may indicate a continuation of an uptrend.
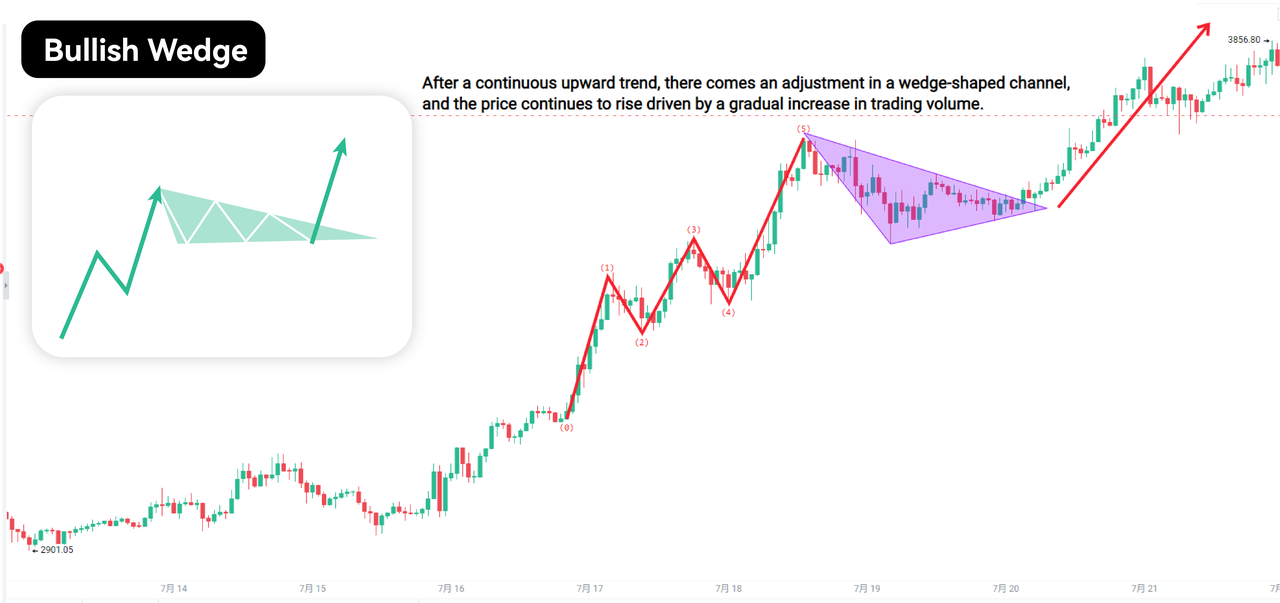
This pattern is usually seen as a strong signal for the price. When the price breaks above the trend line, it indicates that the current uptrend will continue; when the price breaks below the trend line, it indicates that a reversal may occur and turn bearish. In general, the volume should decrease during the formation of the wedge, and the volume will increase again after the break or fall.
Note:Traders should be aware that bullish wedges are not always reliable, and sometimes there may be false breakouts or breaks. Be cautious when trading and confirm with other technical indicators before making a decision.
10、Bearish Wedge
A bearish wedge is the opposite of a bullish wedge. Occurs when prices consolidate between two downwardly sloping converging trendlines. This pattern may indicate a continuation of a downtrend.
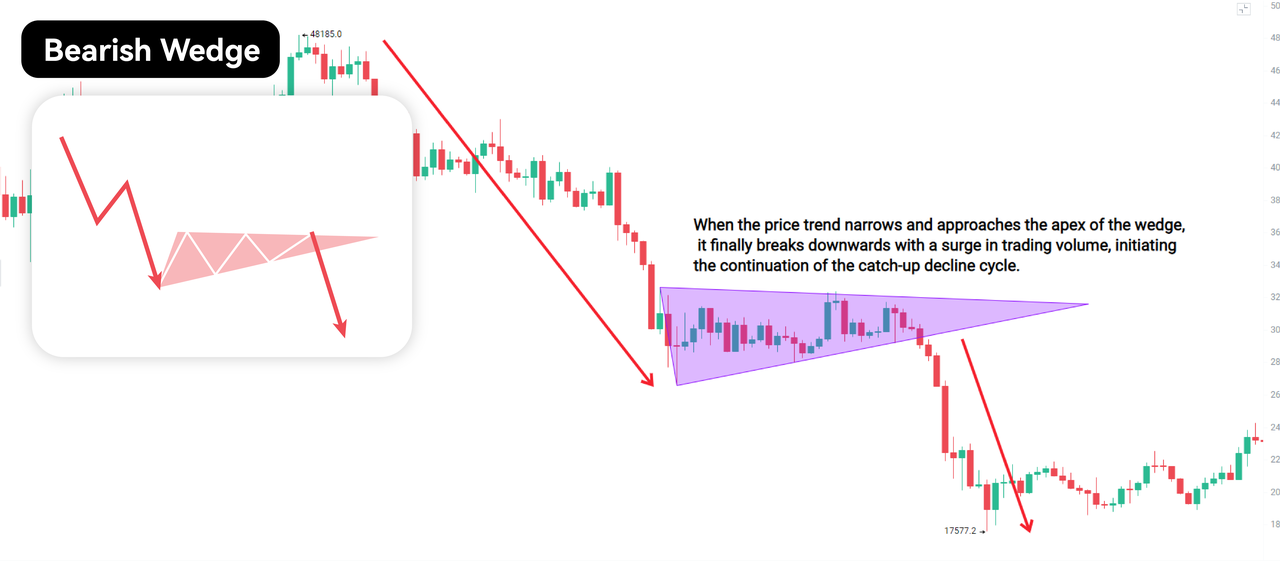
Note:When the price movement narrows and approaches the peak of the wedge, traders should expect the price to break up or down. In most cases, a bearish wedge indicates that the price will fall further. This is usually because the pattern implies a gradual weakening of market momentum as short investors become more cautious.
11、Bullish Cup and Handle
The bullish cup handle pattern is a persistent pattern that occurs when the price undergoes a U-shaped consolidation period followed by a smaller consolidation period forming a "handle". This pattern may indicate a continuation of an uptrend.
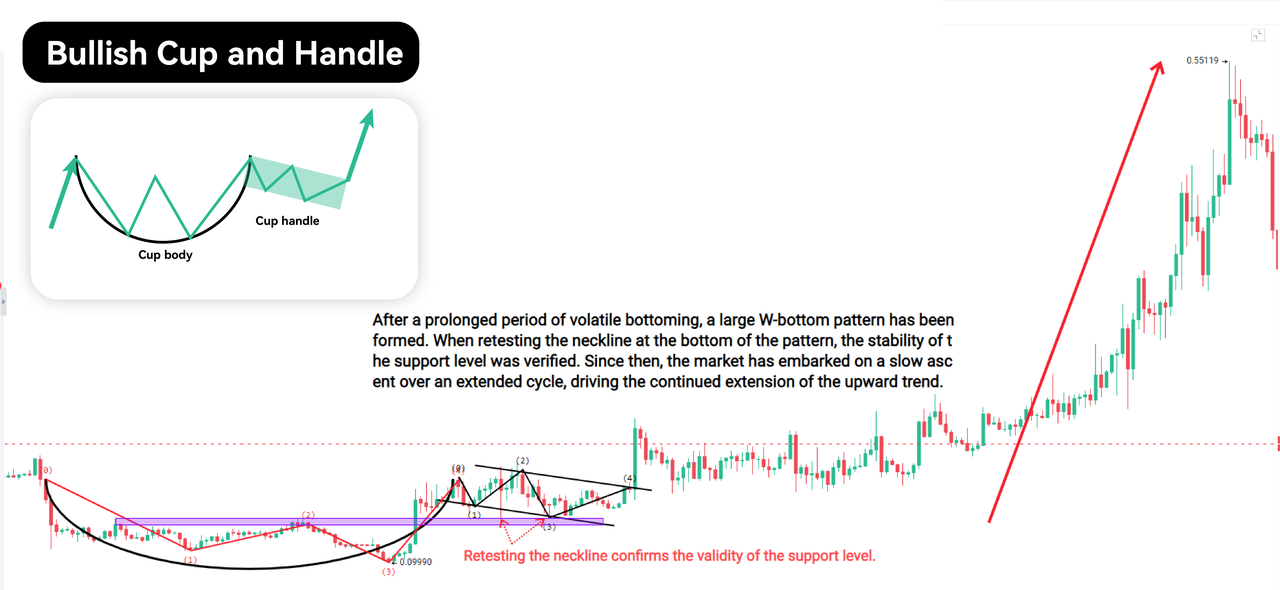
Note:When the price breaks through the handle and continues to rise, the important indicator to confirm whether the breakout is effective is the volume. If the breakout is accompanied by a large volume, this may indicate further upward momentum in the future. In addition to the volume, traders should also combine other technical indicators such as the Relative Strength Index (RSI), Moving Average Convergence-Divergence Indicator (MACD), and whether the resistance level is broken to judge the durability of the breakout.
12、Bearish Cup and Handle
The bearish cup handle pattern is the opposite of the bullish cup handle pattern. It occurs when the price undergoes an inverted U-shaped consolidation period followed by a smaller consolidation period forming a "handle". This pattern may indicate a continuation of a downtrend.
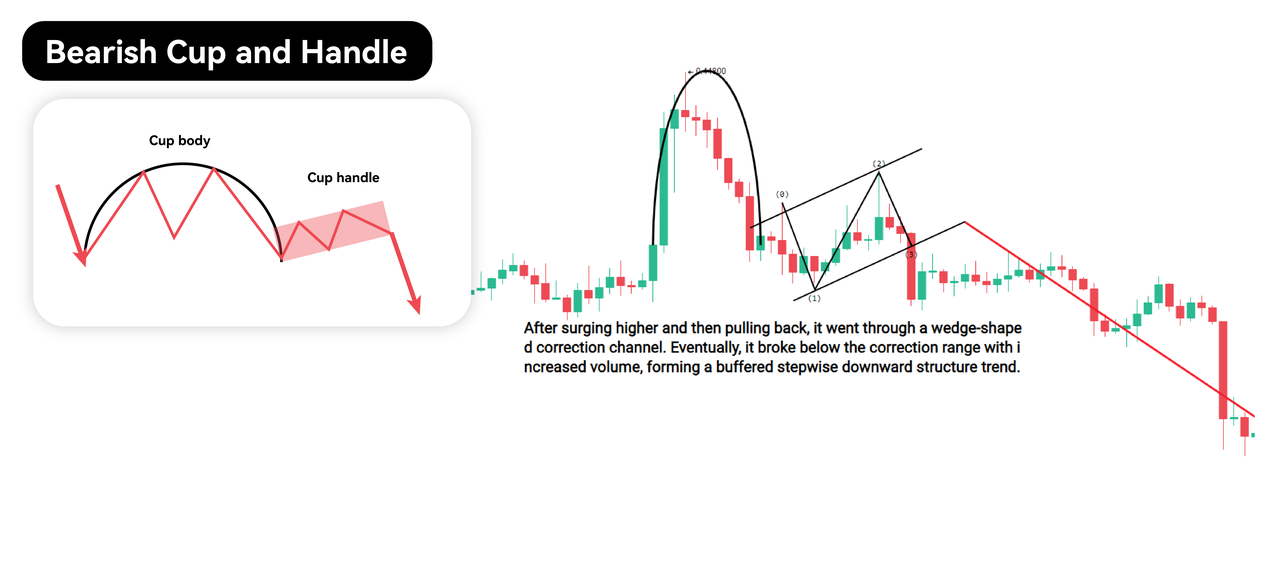
Note:Similar to the bullish cup handle pattern, traders need to pay attention to whether the price breaks through the resistance level formed by the handle to confirm the trend reversal. If the breakout fails to rise further, it may mean that the bearish trend will continue. When trading this pattern, you need to consider factors such as volume and price before entering the market.
In addition, traders should set their stop loss at a reasonable level to manage risk. By taking these precautions, traders can use bearish cup-handle patterns more effectively as a trading strategy.
13、Bullish Rounding Bottom
A bullish arc bottom is a reversal pattern formed when a long downtrend is followed by a U-shaped consolidation period. This pattern may indicate a reversal of the downtrend.
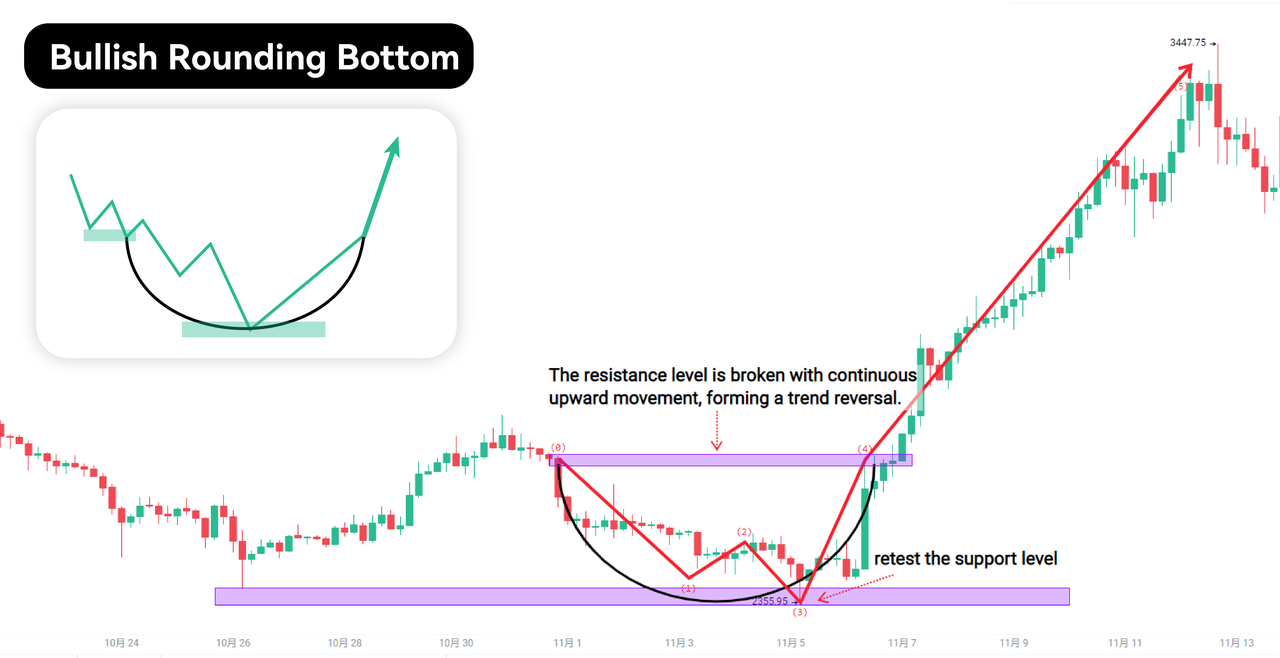
The pattern consists of two significant lows, one below the other, followed by a rise in price and a breakout of the previous resistance level. This breakout can be considered a buy signal. The timing of formation of the pattern varies depending on market conditions and can last from weeks to months. An increase in volume during the consolidation period may indicate an increase in buying activity.
Note:Combining other indicators and market conditions can help traders determine whether to enter the trade. This way, traders can take advantage of potential profit opportunities in the market, whether the market is rising or falling.
The bottom of a bullish arc may also indicate a shift in the downtrend. When prices reach a new low and then rebound, forming a bottom of the arc, this usually indicates that sellers are exhausted and buyers are starting to step in, pushing prices higher.
14、Bearish Rounding Top
A bearish arc top is a chart pattern that indicates a downward trend in the price. A bearish arc top is formed when the price trend follows a series of lower lows, rebounds slightly, and then returns to lower prices again.
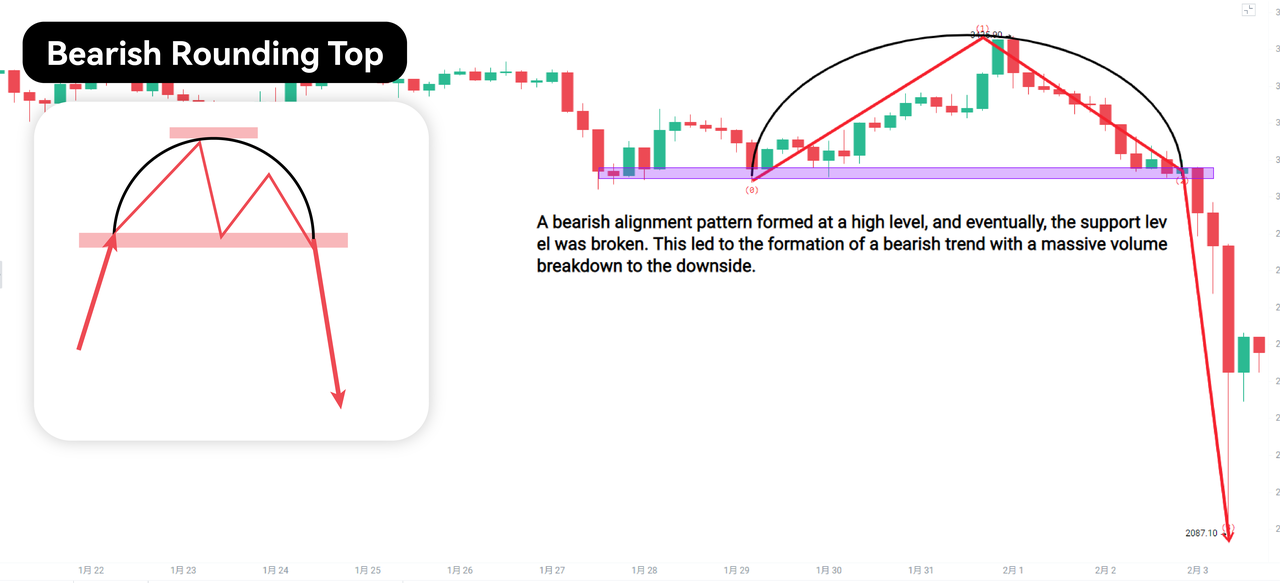
Note:This pattern implies strong selling pressure in the market and indicates that prices may continue to decline in the near term. To identify a bearish arc top, traders look for an arc-shaped top with two significant lows and two significant highs.
The overall trend should be downward, but the price should show some degree of volatility. In addition, the volume of trading activity should show an increasing trend during this period. Combining these factors can provide important insight into the future price of the unerlying asset. Therefore, traders need to pay close attention to the market volume and price movement to correctly identify the top of the bearish arc.
Summary
Now that we have discussed all 34 candlestick patterns in the market, it is important to keep in mind that these patterns should be used in conjunction with other technical analysis tools, rather than relying solely on them to make trading decisions, in order to improve profit opportunities.
Disclaimer
This article does not provide:
(i) investment advice or investment recommendations;
(ii) an offer or solicitation to buy, sell, or hold digital assets;
(iii) financial, accounting, legal, or tax advice.
Digital assets, including stablecoins and NFTs, involve high risk and may fluctuate significantly. Consider whether trading or holding digital assets is appropriate for you given your financial situation. Consult a qualified legal, tax, or investment professional when needed. You are responsible for understanding and complying with applicable local laws and regulations.
About Bitunix
Bitunix is a global cryptocurrency derivatives exchange trusted by over 3 million users across more than 100 countries. At Bitunix, we are committed to providing a transparent, compliant, and secure trading environment for every user. Our platform features a fast registration process and a user-friendly verification system supported by mandatory KYC to ensure safety and compliance. With global standards of protection through Proof of Reserves (POR) and the Bitunix Care Fund, we prioritize user trust and fund security. The K-Line Ultra chart system delivers a seamless trading experience for both beginners and advanced traders, while leverage of up to 200x and deep liquidity make Bitunix one of the most dynamic platforms in the market.
Bitunix Global Accounts
X | Telegram Announcements | Telegram Global | CoinMarketCap | Instagram | Facebook | LinkedIn | Reddit | Medium