
What is K-line?
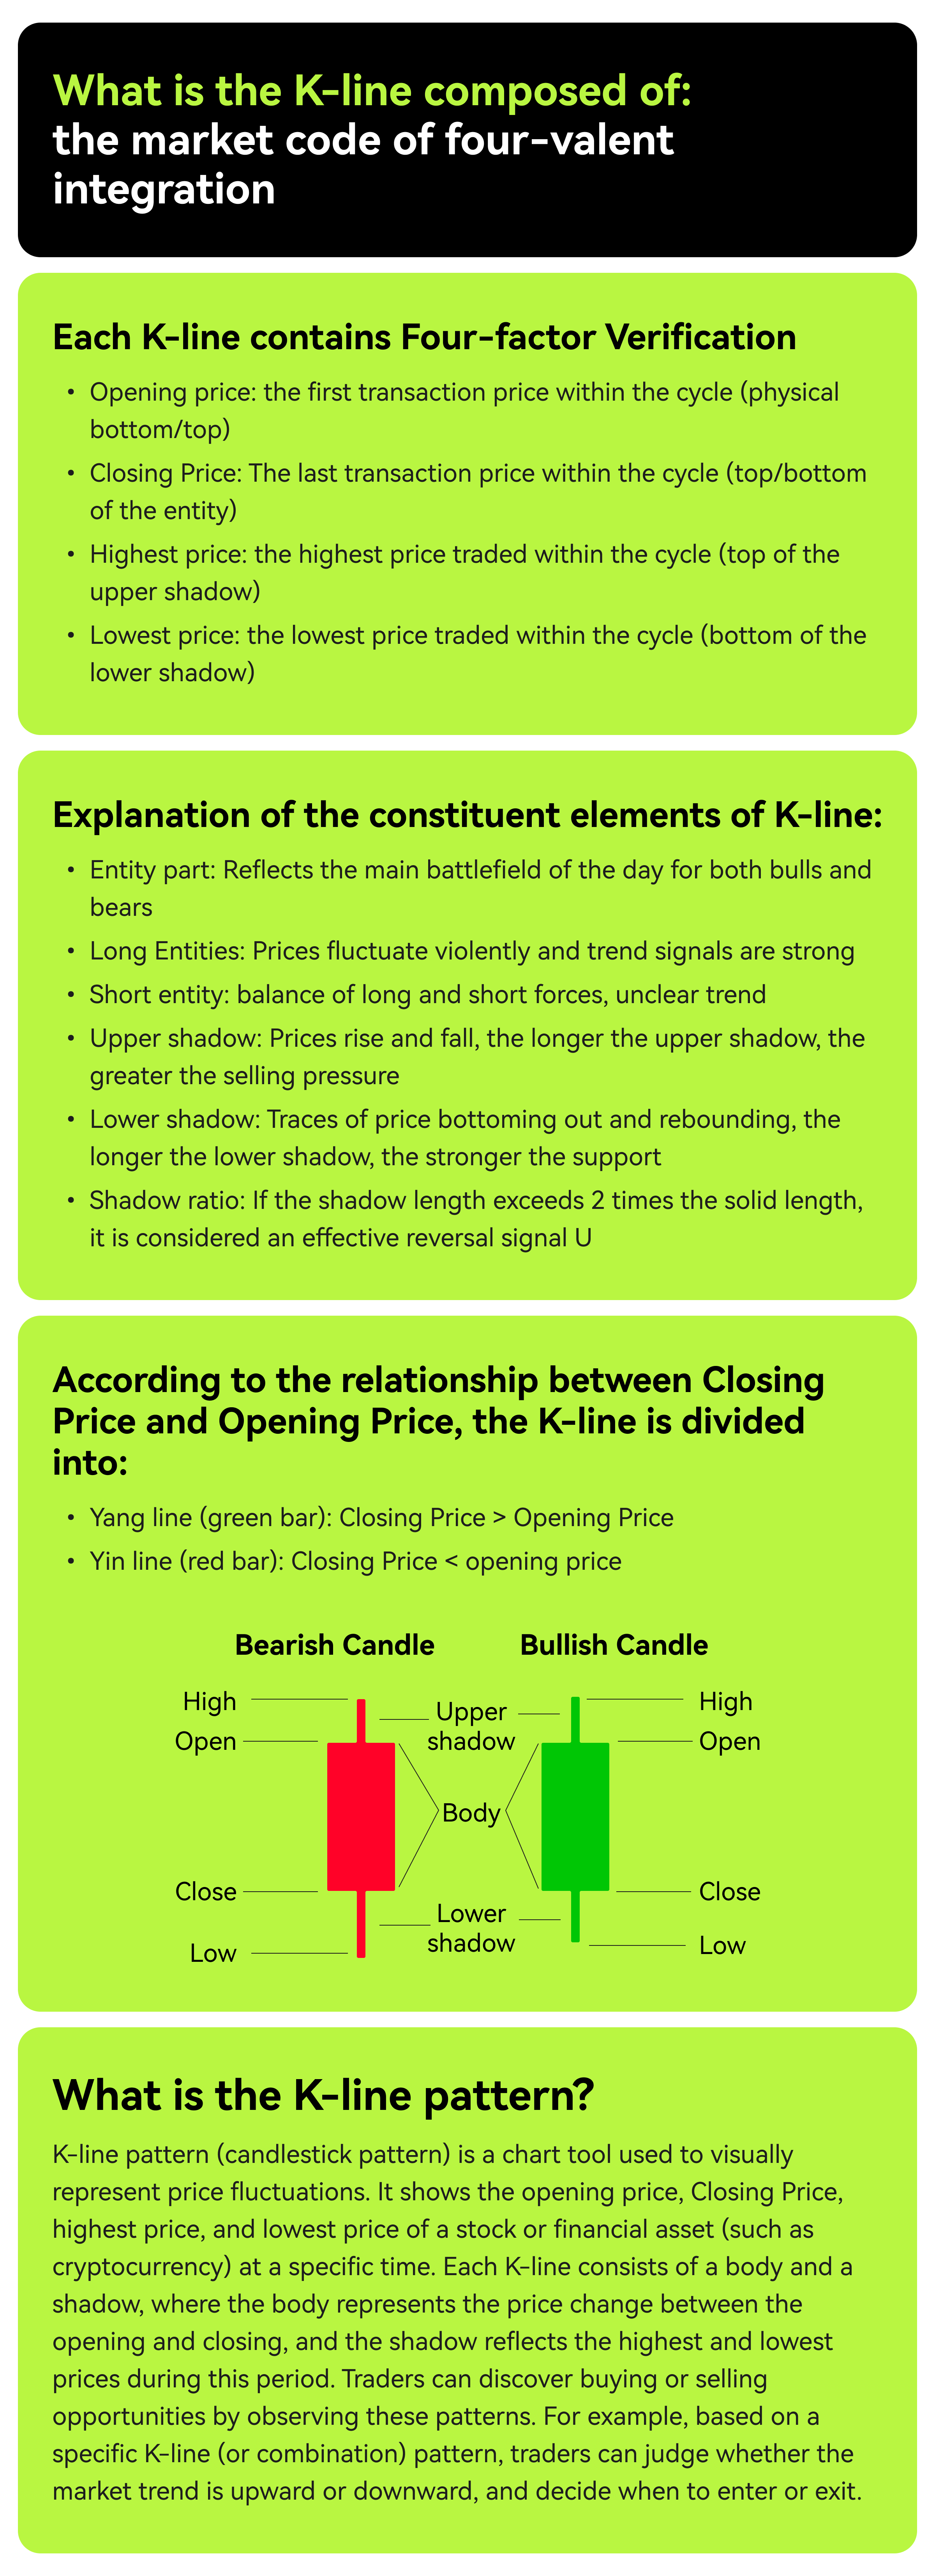
The K-line chart is a graphical tool used to track asset price fluctuations over time, showing the opening price, closing price, highest price, and lowest price of specific time periods (such as daily, weekly, and monthly). Its core function helps investors intuitively understand price fluctuations and market sentiment.
Common single candlestick patterns:
1.Doji
A Doji forms when the opening and closing prices are nearly identical, signaling market indecision, indicating that the market is in a hesitant state and may suggest the potential for a trend reversal.
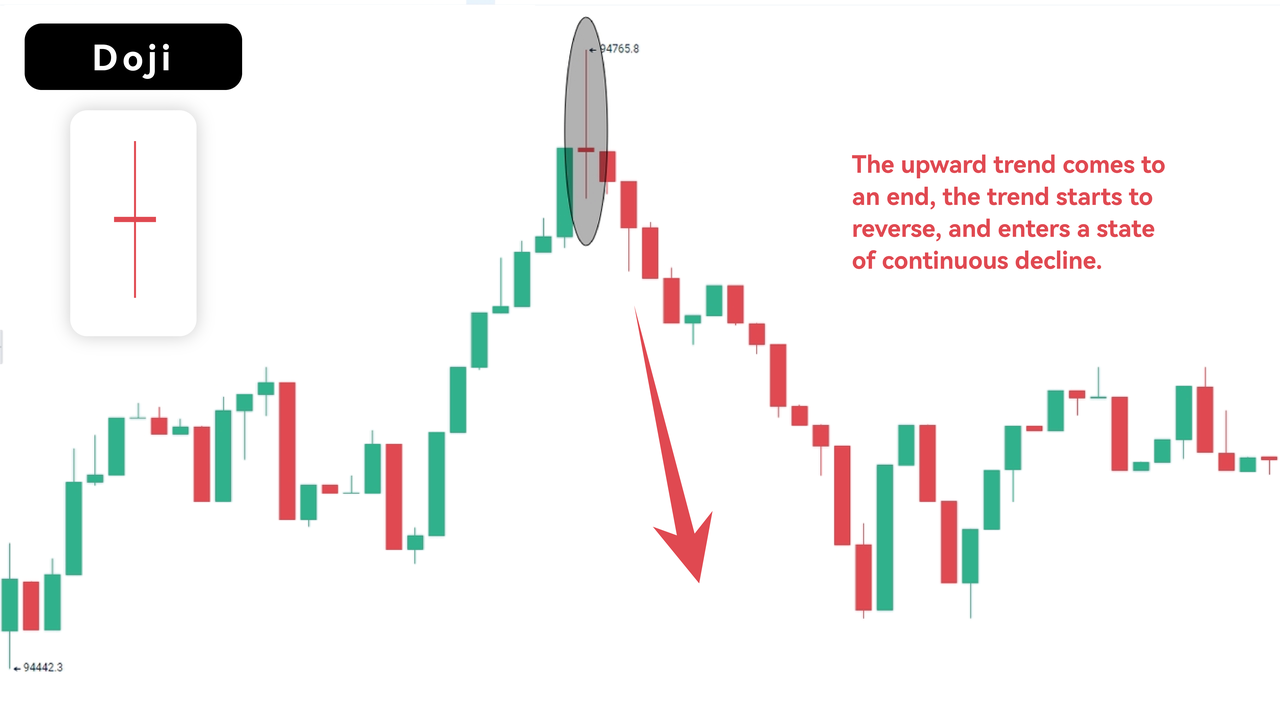
The doji is usually seen as a signal of the balance of bullish and bearish forces, so the direction of the market is unclear. The doji can also be used to confirm existing trends, usually appearing after a longer trend or as part of a long-term trend. In addition, the doji may also imply the end of a trend or the beginning of a new trend.
Note: Like any chart pattern, before making a trading decision, it is necessary to confirm with other indicators (such as trading volume, momentum indicators, or trend lines). Through reasonable analysis, doji can become a powerful tool for traders.
Double Doji Trading Strategy:
Most Doji patterns typically signal market indecision, so when we see two or three doji patterns in a row, it indicates a longer period of uncertainty, which is likely to push the price towards the direction of the final breakthrough. This reflects market transitions between low and high volatility phases, as well as between periods of high volatility and low volatility.
The following are the rules for setting up the double doji strategy for trading:
- The Double Doji candlestick pattern typically appears during market indecision and may signal an upcoming breakout.
- Draw a support line at the low point of the double doji pattern and a resistance line at the high point of the double doji pattern.
- Set up an OCO order, which means that once one order is triggered for execution, cancel another order, one above the resistance high point and the other below the support low point.
2.Hammer line
The hammer line is a candlestick pattern with a small body and a long lower shadow, indicating that in a downtrend, buyers intervene and push the price back up.
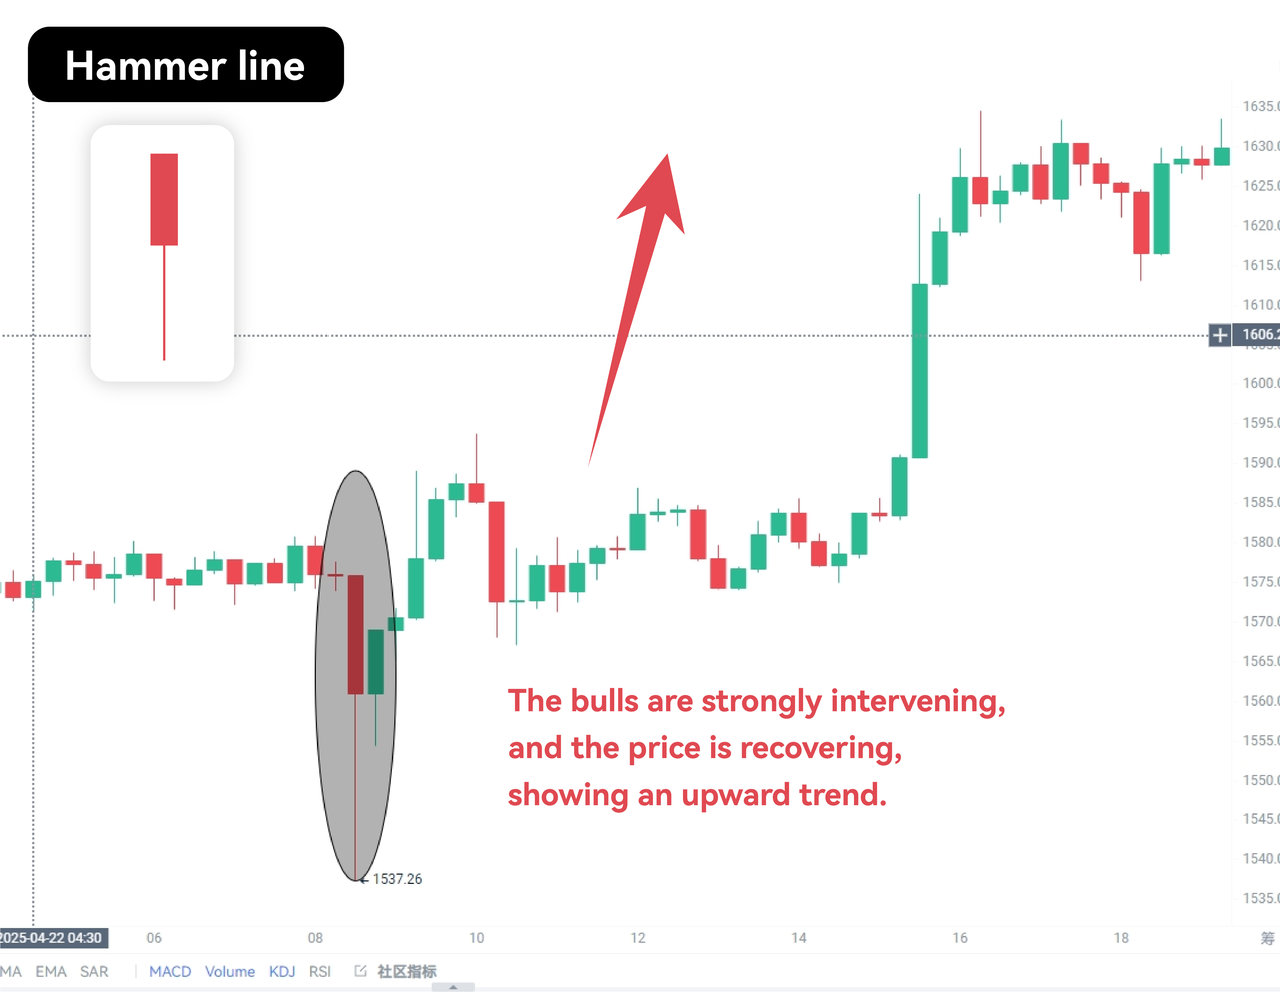
The hammer line is seen as a bullish reversal pattern. Its appearance indicates that the bears' control over the price is weakening, and the buyers are pushing the market to rebound. This may also suggest the possibility of a market bottom or trend reversal. Before taking any action, traders should observe whether there is a confirmation signal. Confirmation signals may come from other indicators, such as trading volume or the Moving Average line. If the pattern is confirmed, traders can enter a long position when the market rebounds.
Note: A hammer usually needs confirmation from volume or key levels to be actionable. It is important to remember that a single indicator is not enough to rely entirely on. Traders should combine multiple analytical tools to make decisions. If the hammer line is confirmed, traders should also pay attention to the size and shape of the candlestick
3.Hanging Man
The hanging Man is a reversal pattern of the hammer line. It has a small body and a long lower shadow, but appearing after an uptrend may imply that the trend will reverse into a downtrend. When a hanging Man appears, investors should be aware of market risks.
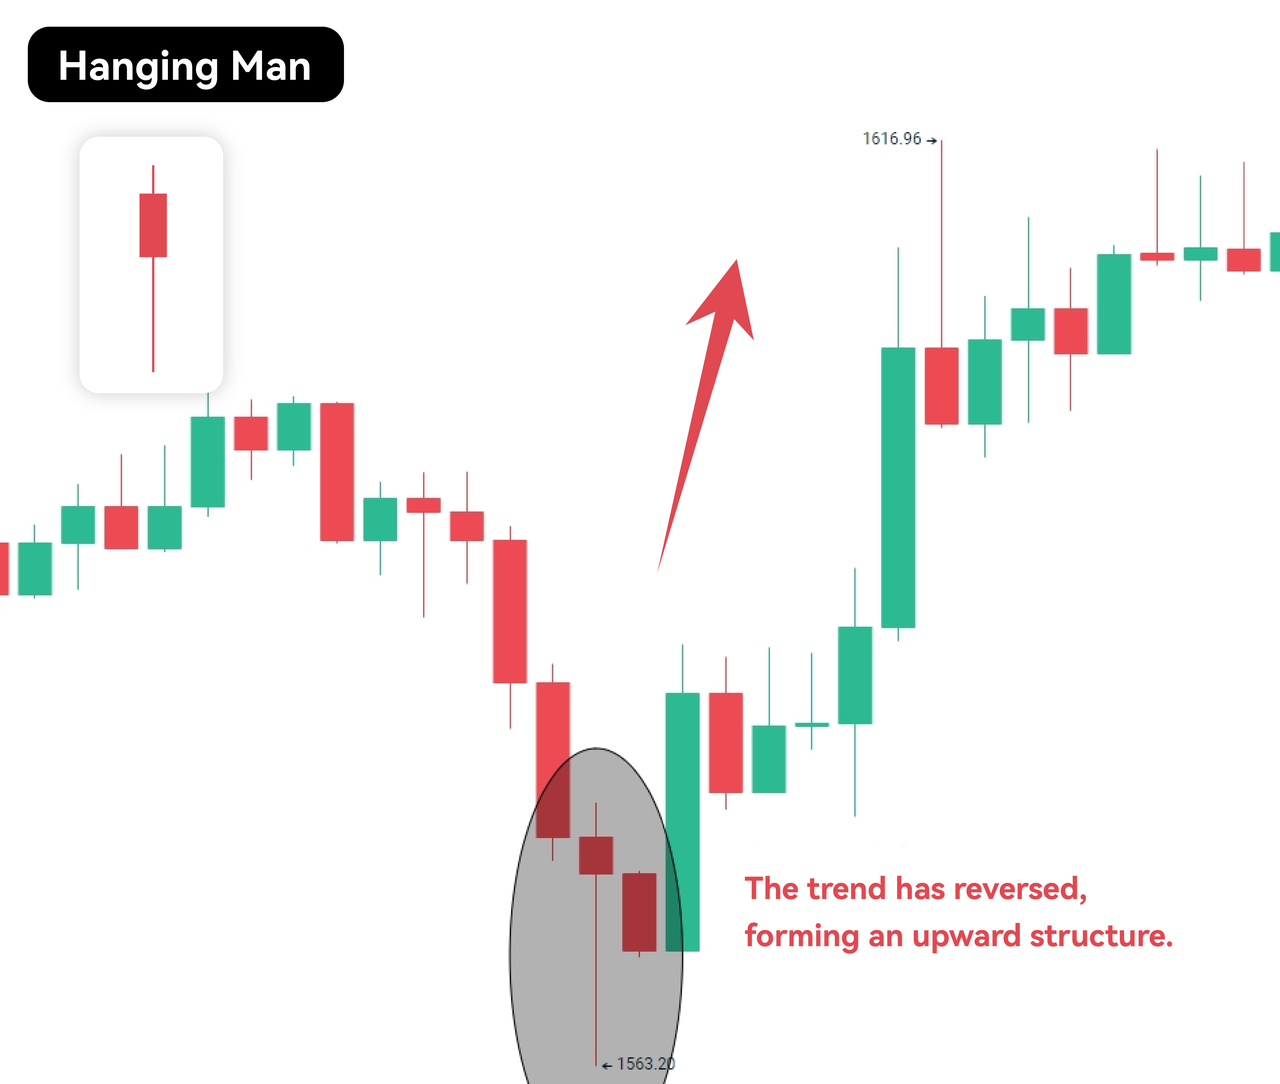
Traders often monitor Hanging Man formations to identify potential trend reversals and help investors decide whether to enter or exit a trade. The key is to remain vigilant about the market, as no one can predict the direction of prices with 100% certainty.
Note: The lower shadow of the hanging Man is long, the upper shadow does not exist (or is short), and the body is small and located at the upper end of the trading range. The hanging Man is very similar to the hammer line.
The difference is that it appears in an uptrend, generally indicating that the uptrend is about to end and there is a reversal of the bearish trend.
The shadow of the hanging candlestick shape is usually twice as long as the solid.
4.Shooting Star
A shooting star is a candlestick pattern with a small body and a long upper shadow that appears after an uptrend, possibly suggesting a trend reversal into a downtrend.
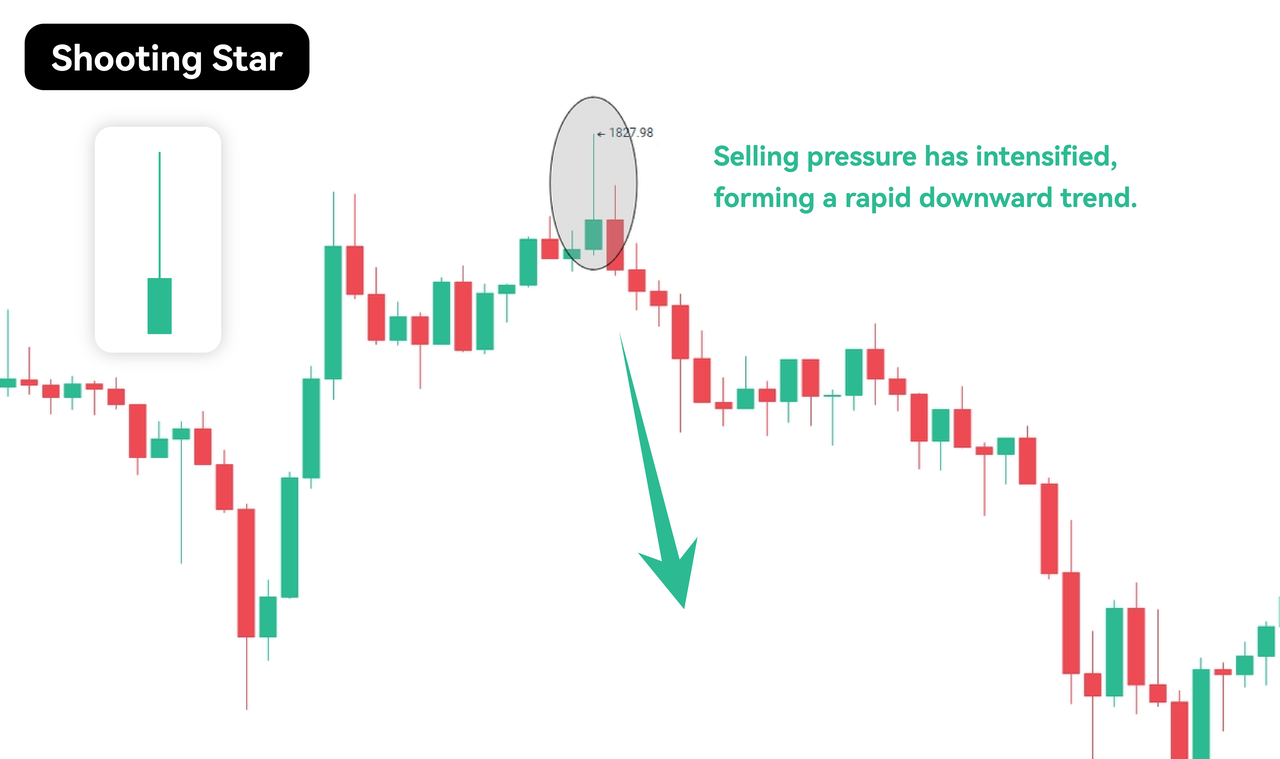
The shooting star indicates that traders are willing to pay higher prices at the beginning of the cycle, but then encounter strong selling pressure. Therefore, this bearish signal may indicate that the upward trend is no longer supported and the downward trend may be beginning.
Note: Investors should confirm this bearish trend before taking action, as shooting stars are sometimes just a brief pause in a strong upward trend. If shooting stars appear near resistance levels, it may also indicate a potential reversal.
5.Inverted Hammer Line
The inverted hammer line is similar to the hammer line, but appears after a downtrend. It shows buyers attempted to drive the price higher but met resistance, resulting in a small body and long upper wick However, by the end of the session, the seller is pushing the price back.
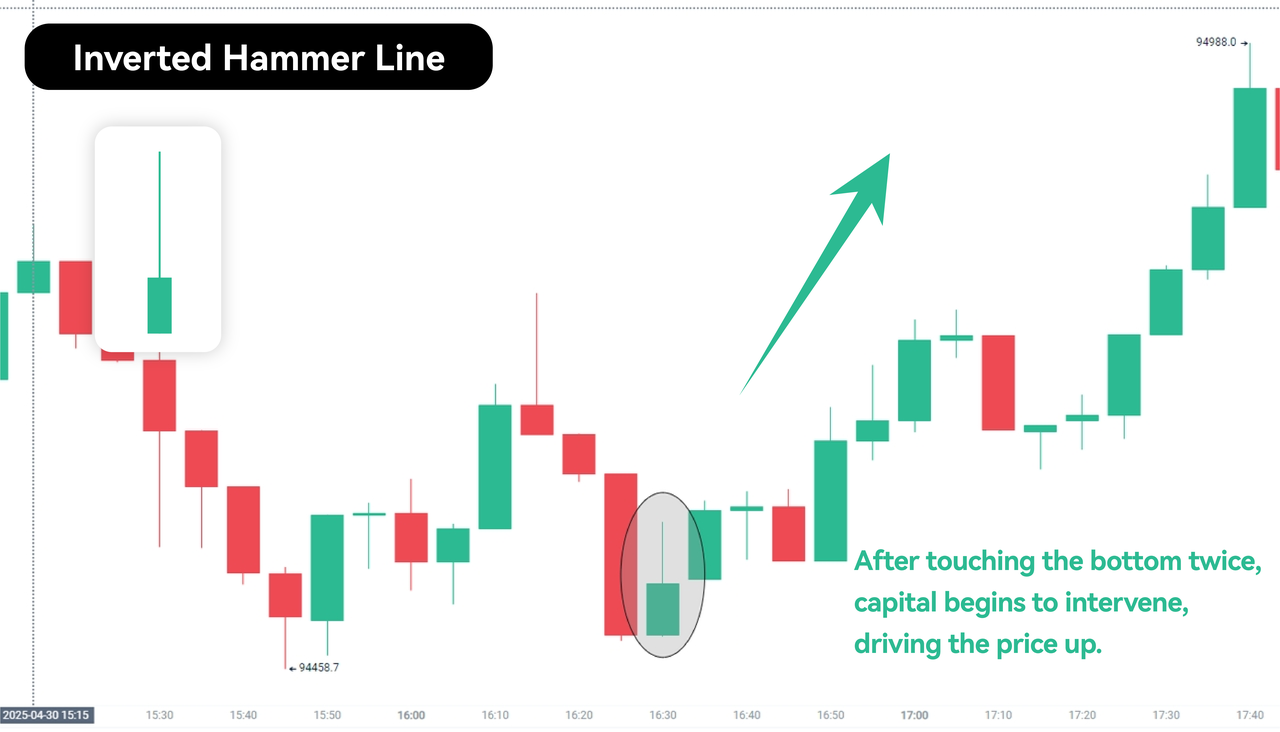
Note: The inverted hammer line can be seen as a signal of buyer interest and may soon start a new upward trend.
6.Gravestone Doji
The Gravestone Doji has a long upper wick and no lower shadow, indicating that the price opened and closed at the same level.
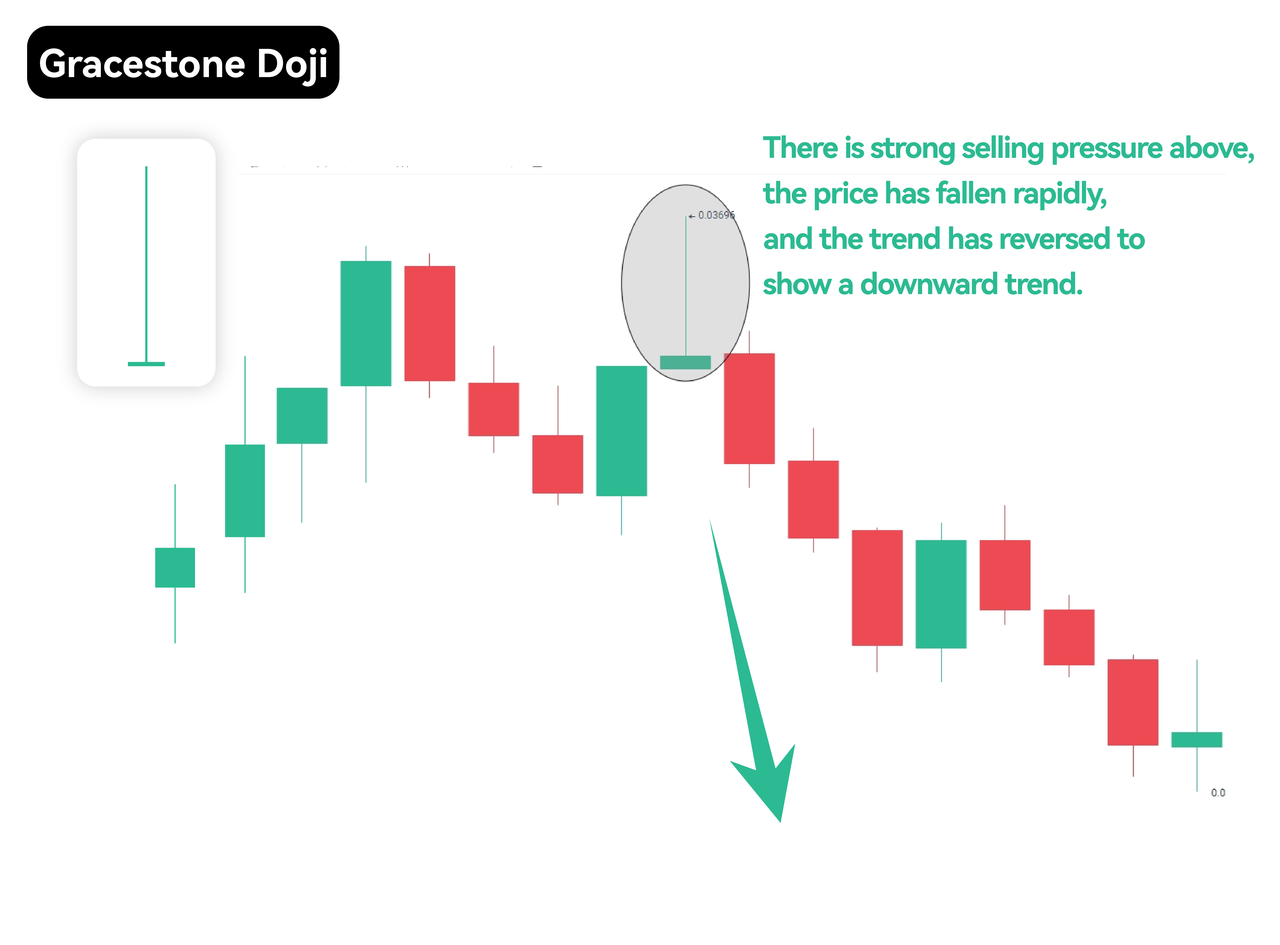
Note: It appears after an uptrend and may suggest a trend reversal to a downtrend. However, it may also indicate temporary hesitation between buyers and sellers. Traders should enter the market after confirming the trend.
The Gravestone doji can be used in conjunction with other technical analysis indicators, such as support, resistance, and moving averages, to help identify potential trading opportunities.
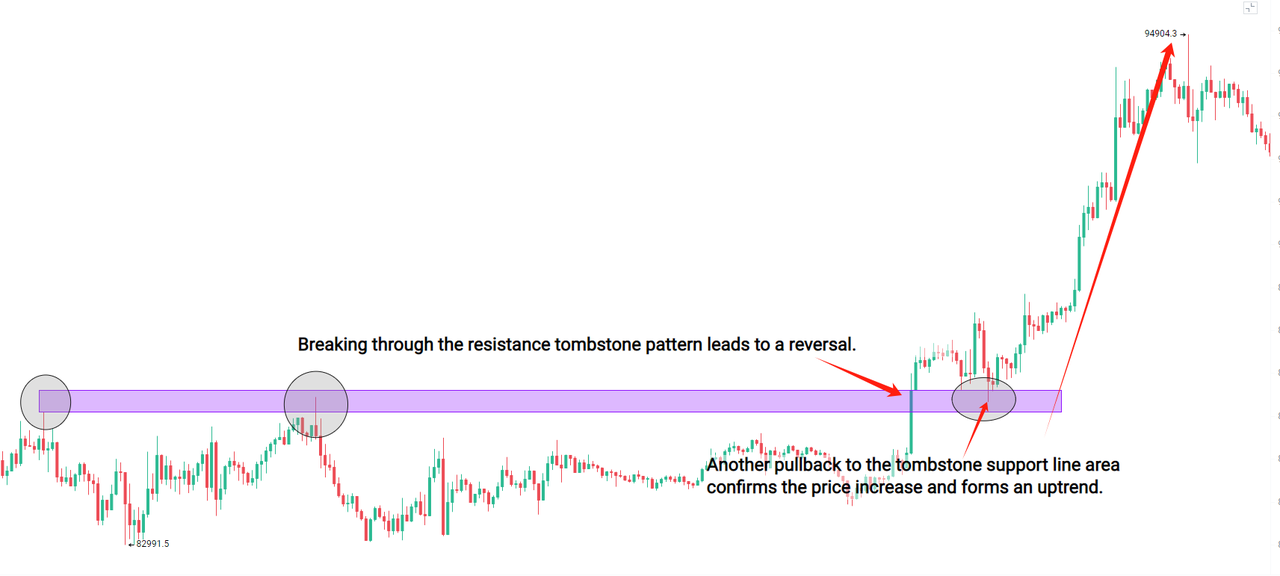
How to use the Gravestone Doji trading strategy in trading?
- The first step is to determine the trend of the target. This is because these candlestick patterns cannot provide high-quality signals in a market that cannot be widely spread.
- The second step is to identify when the Gravestone doji occurs. The following candlestick chart is a good example. As we can see, when this pattern occurs, the price reverses.
How to identify the correct Gravestone (and avoid fake ones)
- The first step is to look for resistance in the form, observe the highest point of the cross star, and see if there is a relatively clear resistance.
- In the second step, you can further confirm the validity of the doji by observing the larger-scale K-line period and combining various analytical tools to make decisions.
Disclaimer
This article does not provide:
(i) investment advice or investment recommendations;
(ii) an offer or solicitation to buy, sell, or hold digital assets;
(iii) financial, accounting, legal, or tax advice.
Digital assets, including stablecoins and NFTs, involve high risk and may fluctuate significantly. Consider whether trading or holding digital assets is appropriate for you given your financial situation. Consult a qualified legal, tax, or investment professional when needed. You are responsible for understanding and complying with applicable local laws and regulations.
About Bitunix
Bitunix is a global cryptocurrency derivatives exchange trusted by over 3 million users across more than 100 countries. At Bitunix, we are committed to providing a transparent, compliant, and secure trading environment for every user. Our platform features a fast registration process and a user-friendly verification system supported by mandatory KYC to ensure safety and compliance. With global standards of protection through Proof of Reserves (POR) and the Bitunix Care Fund, we prioritize user trust and fund security. The K-Line Ultra chart system delivers a seamless trading experience for both beginners and advanced traders, while leverage of up to 200x and deep liquidity make Bitunix one of the most dynamic platforms in the market.
Bitunix Global Accounts
X | Telegram Announcements | Telegram Global | CoinMarketCap | Instagram | Facebook | LinkedIn | Reddit | Medium