
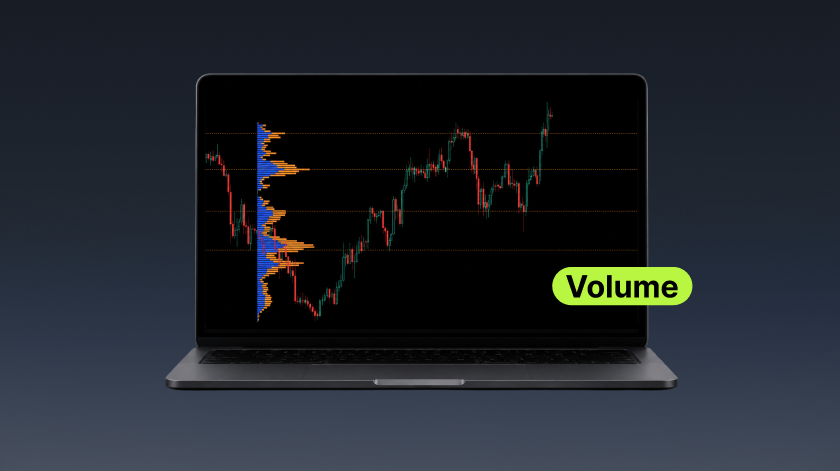
Volume Indicator: Definition and Importance
1.What Is Volume?
Without diving into complex calculations, Volume shows the total amount of assets traded during a specific period. It provides a clear indication of market activity and reflects the level of participation behind price movements. As one of the most fundamental indicators in technical analysis, volume offers essential insight into market momentum and is difficult to manipulate consistently over time.
Volume is displayed as volume bars on trading charts. When analyzed alongside K-line (candlestick) price movements, it forms the foundation of volume-price analysis, helping traders evaluate the strength behind market trends.
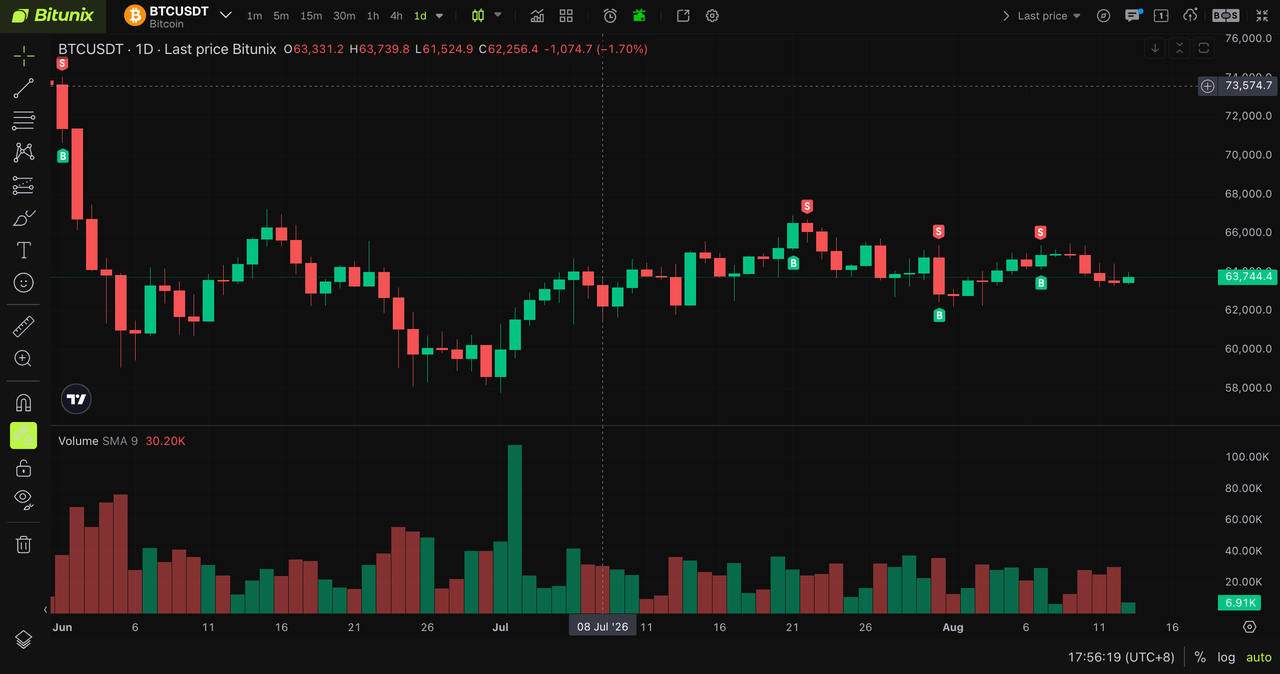
2.Key Benefits of Volume Analysis
Volume provides several important insights for traders:
- Identifying market participation and trend strength through volume-price relationships
By analyzing patterns such as volume confirmation and volume divergence, traders can evaluate whether a price trend is supported by genuine market activity.
- Distinguishing real breakouts from false signals
A breakout accompanied by significantly higher volume often indicates stronger market participation and conviction. In contrast, breakouts with low volume may lack sufficient momentum and could turn into false breakouts.
- Spotting potential trend reversals through volume exhaustion signals
When trading activity begins to weaken, volume exhaustion may signal a potential turning point, helping traders avoid chasing rallies or entering positions prematurely.
- Building a more comprehensive trading framework with multiple indicators
Traders can combine Bitunix chart alerts (such as indicator alert) with candlestick patterns, moving averages, support and resistance levels to identify stronger trading signals.
Key Volume Patterns and Practical Applications (Four Classic Models)
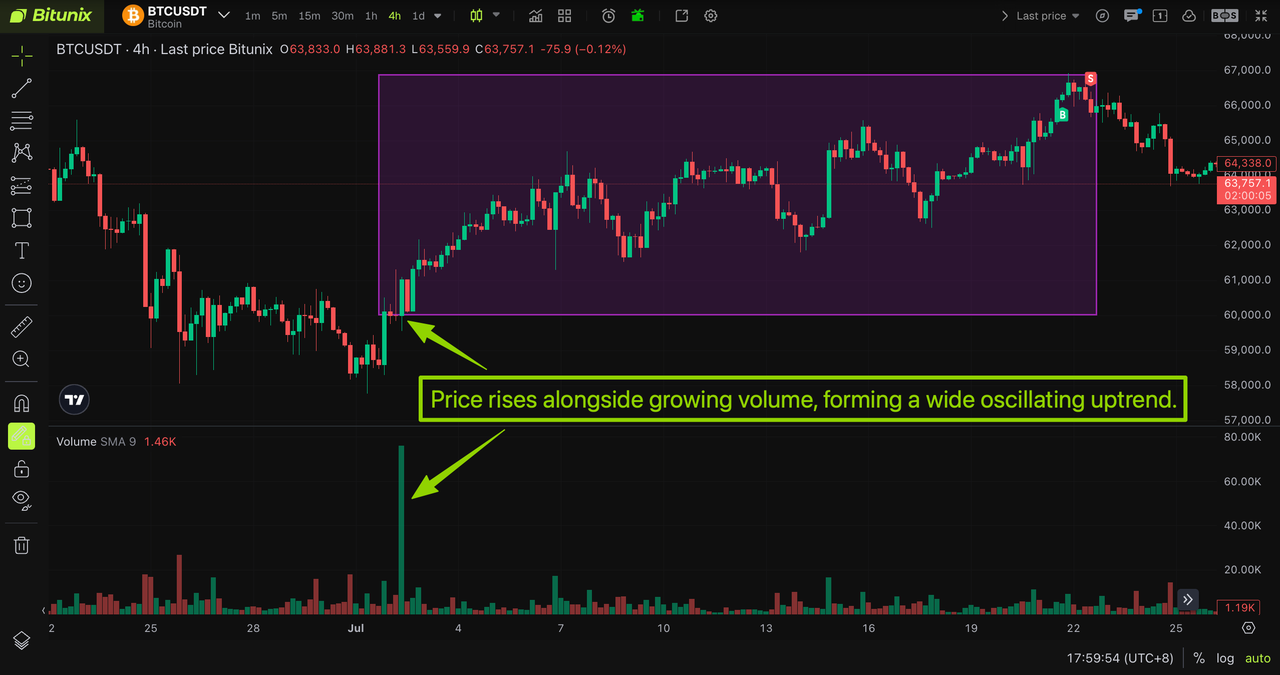
(1) Rising Price with Increasing Volume: Price Moves Higher as Volume Expands
Meaning:
When price continues to rise while volume increases, it suggests strong buying interest and sustained market participation. This pattern indicates that the uptrend has solid momentum and may continue.
Trading Approach:
Traders may consider following the prevailing trend by maintaining long positions and looking for potential entry opportunities near support levels when volume decreases during pullbacks.
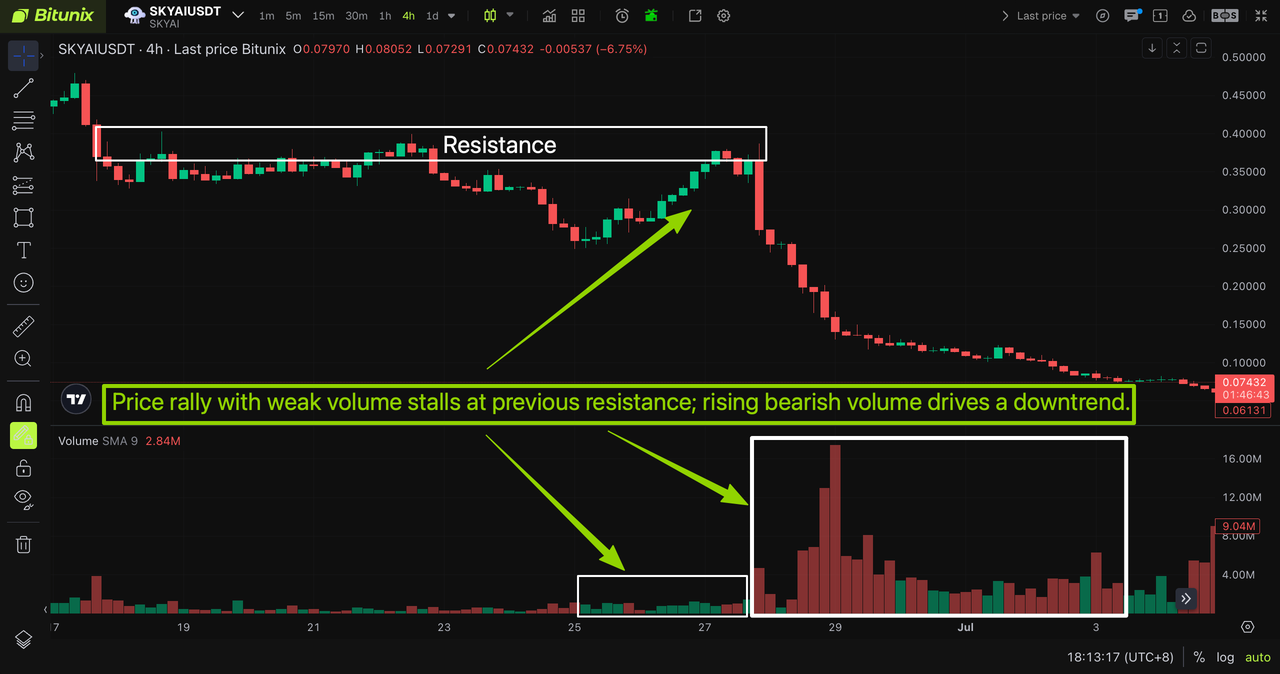
(2) Rising Price with Decreasing Volume: Price Reaches New Highs While Volume Declines (Bearish Volume Divergence)
Meaning:
When price continues to move higher while volume gradually decreases, it may indicate weakening buying momentum and reduced market participation. This volume divergence suggests that the uptrend may be losing strength and increases the risk of a potential pullback.
Trading Approach:
Avoid chasing upward moves when volume weakens. Traders may consider taking partial profits near higher price levels and closely monitor potential reversal signals or short opportunities.
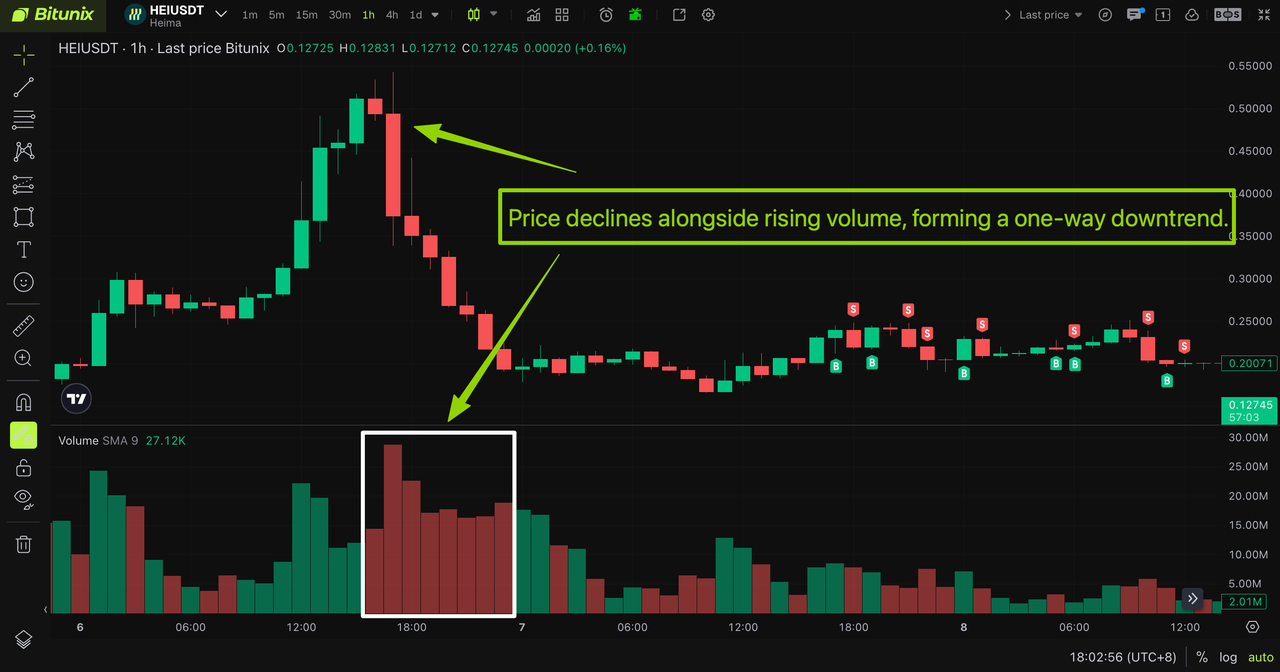
(3) Falling Price with Increasing Volume: Price Declines as Volume Expands
Meaning:
When price continues to decline while volume increases, it indicates strong selling pressure and increased market participation on the downside. This pattern suggests that bearish momentum is strengthening and the downtrend may continue.
Trading Approach:
Traders may consider following the prevailing trend and monitoring short opportunities during rebounds when volume decreases near resistance levels.
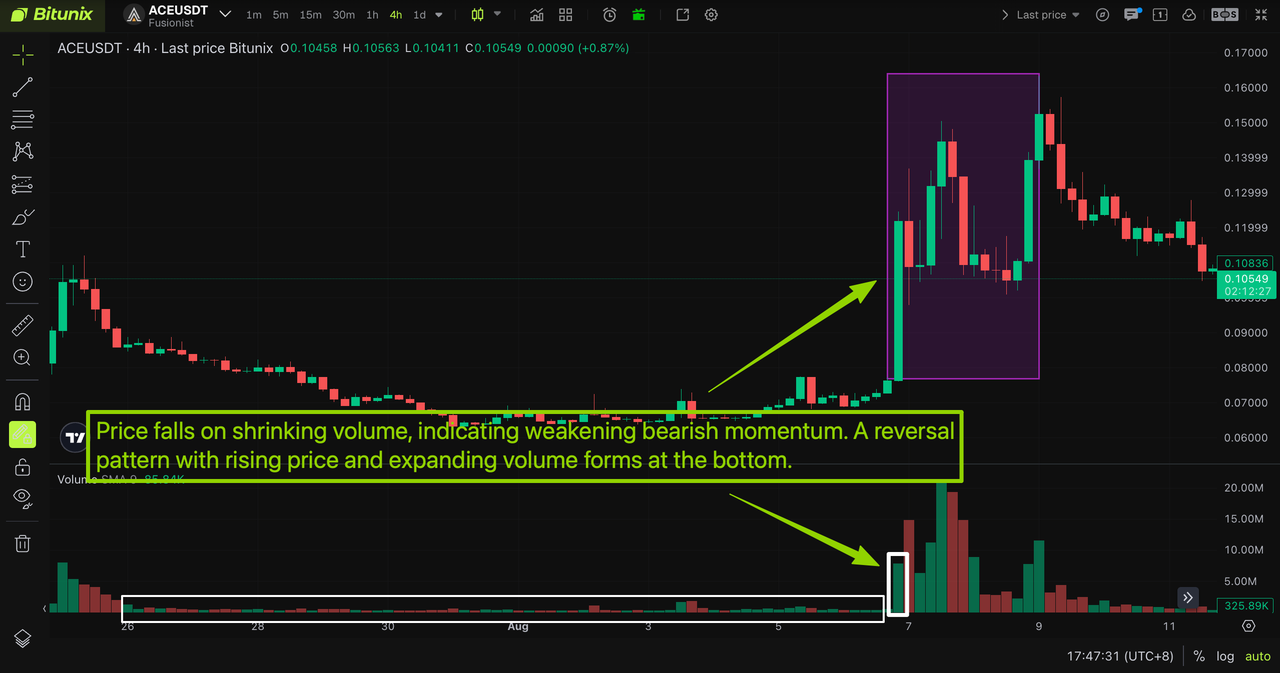
(4) Falling Price with Decreasing Volume: Price Reaches New Lows While Volume Declines (Bullish Volume Divergence)
Meaning:
When price continues to decline while volume gradually decreases, it may indicate weakening selling pressure and reduced bearish momentum. This pattern suggests that sellers may be losing strength, increasing the possibility of a potential rebound or trend stabilization.
Trading Approach:
Avoid continuing to chase downward moves when selling volume weakens. Traders may wait for signs of stabilization and confirmation before considering potential long opportunities.
Practical Example
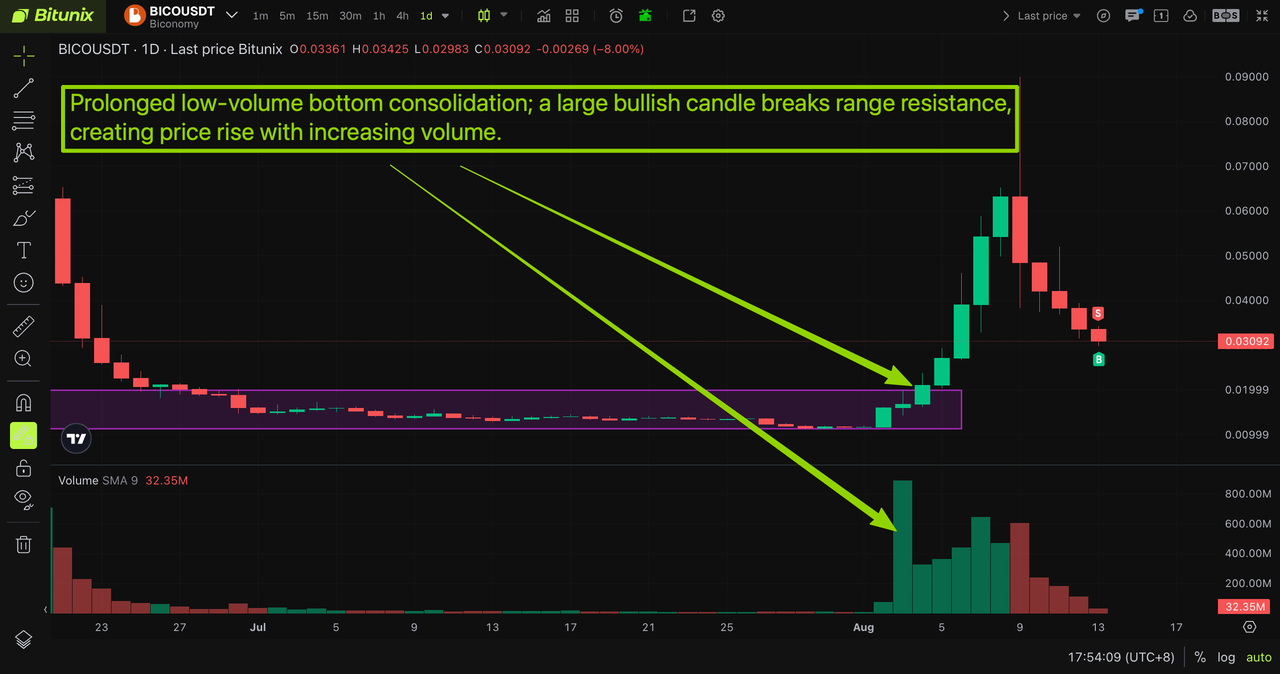
Example 1: BICOUSDT Daily Chart | Long-Term Base Consolidation with Low Volume Followed by a Volume-Confirmed Breakout (Bullish Case)
Analysis:
After an extended period of low-volume consolidation near the bottom range, the market entered a phase of reduced activity as buyers and sellers remained cautious. During this period, weaker positions were gradually absorbed and selling pressure eased.
The price later broke above the resistance level of the consolidation range with a strong bullish candlestick, accompanied by a significant increase in volume. This formed a rising price with increasing volume pattern, suggesting that the breakout was supported by stronger buying interest and increased market participation.
The volume confirmation indicates that the breakout had stronger momentum rather than being a typical low-volume false breakout, with the market structure shifting from sideways consolidation toward an upward trend.
Trading Approach:
The initial breakout may provide the first opportunity to follow the emerging trend. During subsequent pullbacks, traders can monitor volume changes: if the retracement occurs with declining volume and price holds key support levels, it may indicate sustained buying interest.
If the price later reaches new highs while volume decreases, forming a rising price with decreasing volume pattern, it may signal weakening momentum. Traders can then consider managing positions and monitoring for potential trend exhaustion.
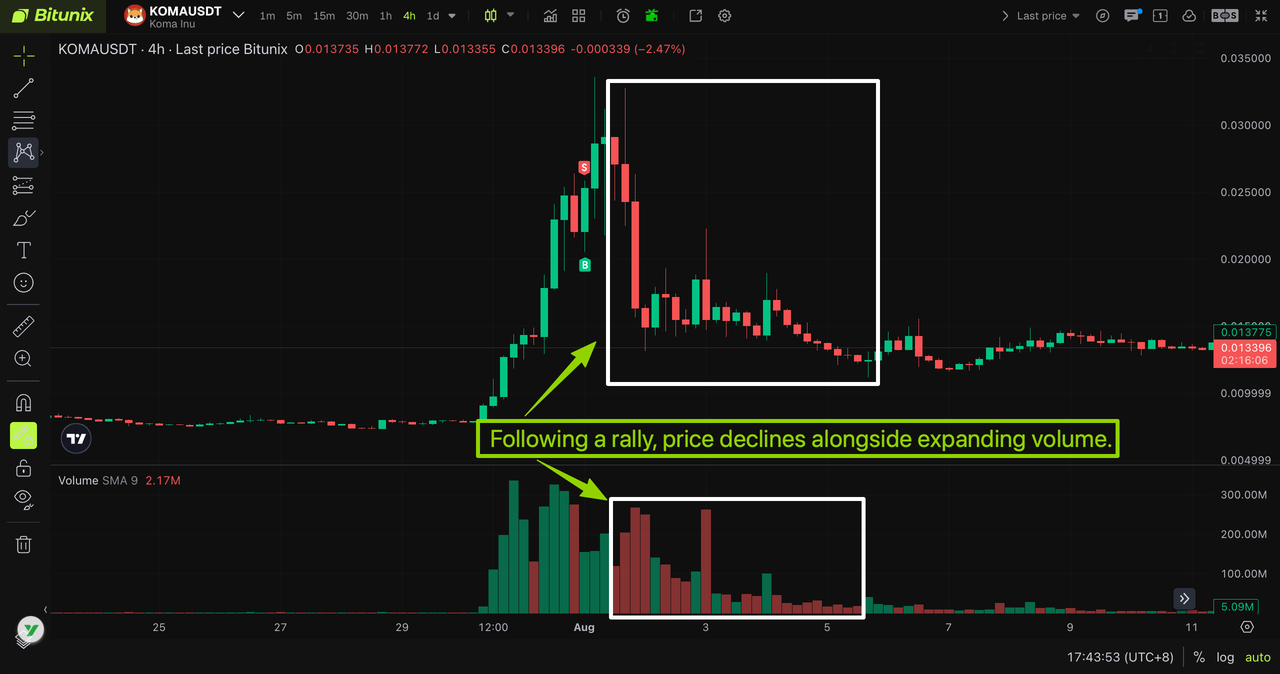
Example 2: KOMAUSDT 4H Chart | Volume-Confirmed Downtrend After an Uptrend (Bearish Case)
Analysis:
After an extended upward move, bullish momentum began to weaken. The price then moved lower with a significant increase in trading volume, forming a falling price with increasing volume pattern.
The expansion in volume during the decline indicated increased selling pressure and stronger market participation on the downside. This suggested that buying momentum was fading and the market structure was shifting from an upward trend toward a bearish phase, leading to a further pullback.
Trading Approach:
Once the high-volume decline is confirmed, traders can monitor whether the bearish trend continues. During subsequent rebounds, declining volume combined with resistance near key levels may indicate weak recovery momentum.
If the price later forms a falling price with decreasing volume pattern, it may suggest that selling pressure is easing and bearish momentum is weakening. Traders can then reassess positions based on further market confirmation.
⚠️ Risk Warning: Volume Trading Risks and Common Mistakes to Avoid
- Volume Signals Can Be Less Reliable in Range-Bound Markets
In sideways markets, volume may fluctuate irregularly and frequently generate false signals. During consolidation periods, avoid overtrading and wait for clearer volume signals near key range boundaries before making trading decisions.
- Do Not Rely on Volume Alone: Use Multiple Confirmations
Volume is a supporting tool for evaluating market momentum and should be combined with other technical factors, including key support and resistance levels, moving averages, and candlestick reversal patterns. A single volume signal may not be sufficient to confirm a trade setup.
- Prioritize Higher Timeframe Volume Signals Over Short-Term Noise
Volume data on short timeframes, such as 5-minute or 15-minute charts, can be easily affected by short-term large orders and market noise, making signals less reliable. In comparison, volume structures on higher timeframes, such as 4-hour and daily charts, tend to provide a clearer view of overall market trends.
For beginners, it is generally recommended to prioritize higher timeframe volume signals as a reference when analyzing market movements.
- Follow the Trend and Avoid Predicting Tops or Bottoms Based Only on Volume Declines
During a broader uptrend, a temporary price increase accompanied by declining volume may only indicate short-term momentum weakness rather than an immediate reversal. Avoid attempting to predict market tops against the prevailing trend. The same applies to downtrends — declining volume alone does not confirm a market bottom.
- Apply Proper Risk Management and Always Plan Exit Strategies
Volume divergence only indicates potential momentum exhaustion and does not guarantee an immediate reversal. The existing trend may continue through an extended consolidation period. Always define risk parameters in advance, including stop-loss levels, and avoid holding positions with uncontrolled unrealized losses.
Disclaimer
This article is not intended to provide
(I) investment advice or investment recommendations;
(Ii) an offer or solicitation to buy, sell or hold digital assets;
(Iii) Financial, accounting, legal or tax advice. Digital assets held (including stablecoins and NFTs) involve high risk and may fluctuate significantly. You should carefully consider whether trading or holding digital assets is right for you based on your financial situation. Please consult your legal/tax/investment professional for your specific situation. Please be responsible for understanding and complying with all applicable local laws and regulations.
About Bitunix
Bitunix is a global cryptocurrency derivatives exchange trusted by more than 3 million users from over 100 countries. Bitunix is committed to providing a transparent, compliance and secure trading environment for every user. The platform has a fast registration process and friendly verification system, and enforces KYC to ensure security and compliance.
With global protection standards such as Proof of Reserve (PoR) and Bitunix Care Fund, Bitunix puts user trust and safety of funds first. The K-Line Ultra charting system brings a smooth trading experience to novice and advanced traders, while up to 200x leverage and deep liquidity make Bitunix one of the most dynamic platforms in the market.
Bitunix Global Account
X | Telegram Announcements | Telegram Global | CoinMarketCap | Instagram | Facebook | LinkedIn | Reddit | Medium