
What Is the MACD Indicator and Why Does It Matter?
What Is MACD?
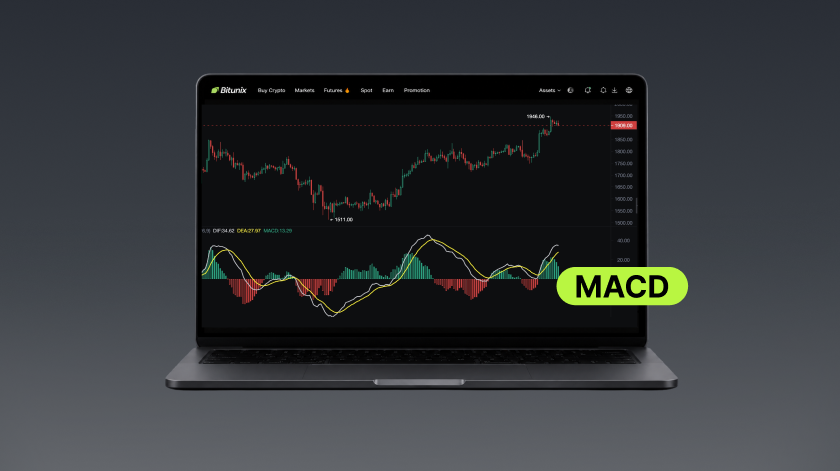
MACD (universal indicator) is one of the most widely used momentum indicators among traders. Rather than focusing on complex calculations, traders mainly use MACD to identify changes in market momentum and potential trend reversals.
The core trading signals of MACD are based on golden crosses and death crosses.
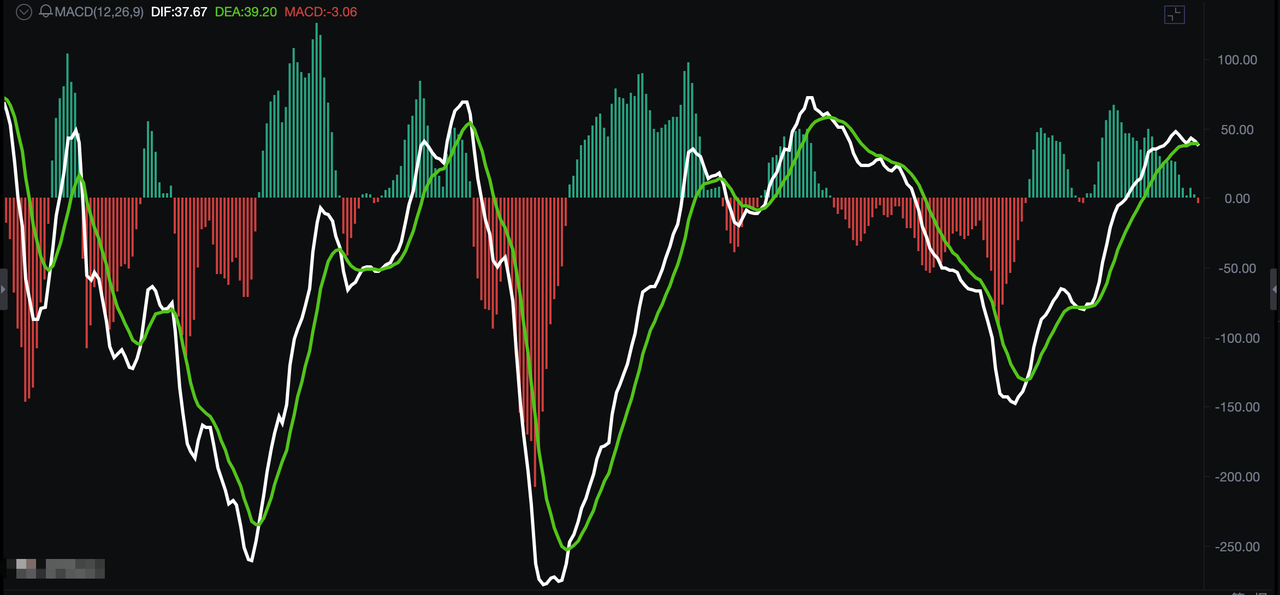
The indicator consists of three key components:
- DIF (Fast Line): Tracks short-term price momentum changes;
- DEA (Slow Line): Acts as a signal line to confirm trend direction;
- MACD Histogram: Displays the strength of bullish and bearish momentum through red and green bars.
When the DIF line crosses above or below the DEA line, it forms a golden cross or death cross, which traders often use as a reference for potential entry or exit opportunities.
Meanwhile, the MACD histogram provides a visual representation of market momentum strength. It can help traders identify short-term reversals while also supporting longer-term trend analysis, making MACD suitable for both swing trading and trend-following strategies.
The Core Value of MACD in Trading
MACD provides traders with several practical advantages:
- Identify shifts between bullish and bearish momentum
Golden crosses and death crosses help traders quickly recognize changes in market momentum and provide basic reference points for potential entries and exits.
- Predict possible trend reversals through divergence signals
By analyzing bullish divergence and bearish divergence, traders can identify potential market turning points earlier, helping reduce risks such as sharp pullbacks after strong rallies or prolonged declines.
- Measure market momentum strength
Changes in the MACD histogram size can help traders evaluate whether momentum is strengthening or weakening, making it easier to distinguish genuine breakouts from potential false signals such as bull traps or bear traps.
- Create personalized trading alerts with Bitunix charts
On the Bitunix trading interface, users can set indicator alerts for MACD signals, including golden crosses, death crosses, and divergence patterns. These automated notifications allow traders to monitor important market movements without constantly watching the charts, helping build a more efficient trading strategy.
MACD Components and Key Practical Trading Patterns
Understanding the Three Core Components of MACD
1.DIF Line: The Short-Term Trend Indicator
The DIF (Fast Line) reflects short-term changes in market momentum and often acts as the leading indicator for trend movements.
- When DIF moves upward, short-term market momentum is generally leaning bullish;
- When DIF moves downward, short-term momentum is generally leaning bearish;
- When DIF moves sideways and repeatedly crosses around DEA, it indicates a lack of clear market direction and a potential consolidation phase, where frequent trading is usually less favorable.
2.DEA Line: The Medium-Term Trend Boundary
The DEA (Slow Line) serves as a key reference point for identifying medium-term market trends. It is also commonly used by traders to manage positions and adjust dynamic take-profit levels.
- When price and both MACD lines move above DEA, it suggests that bullish momentum is gaining control and an uptrend may be forming;
- When price and both MACD lines fall below DEA, it indicates that bearish momentum is strengthening and a downtrend may be developing.
3.MACD Histogram: A Gauge of Bullish and Bearish Momentum
The MACD histogram visually reflects changes in market momentum through the length of green and red bars.
- Green bars: Represent increasing bullish momentum as buying pressure enters the market. The longer the green bars become, the stronger the upward momentum. When green bars continue to shrink, it suggests weakening bullish momentum and a higher possibility of a price pullback.
- Red bars: Represent increasing bearish momentum as selling pressure dominates the market. The longer the red bars become, the stronger the downward momentum. When red bars continue to shorten, it indicates weakening bearish momentum and a potential price rebound.
Four Key MACD Trading Patterns (EA-Based Signal Recognition)
Note: EA stands for Expert Advisor, an automated trading system designed to analyze market data and identify potential trading signals based on predefined technical strategies.
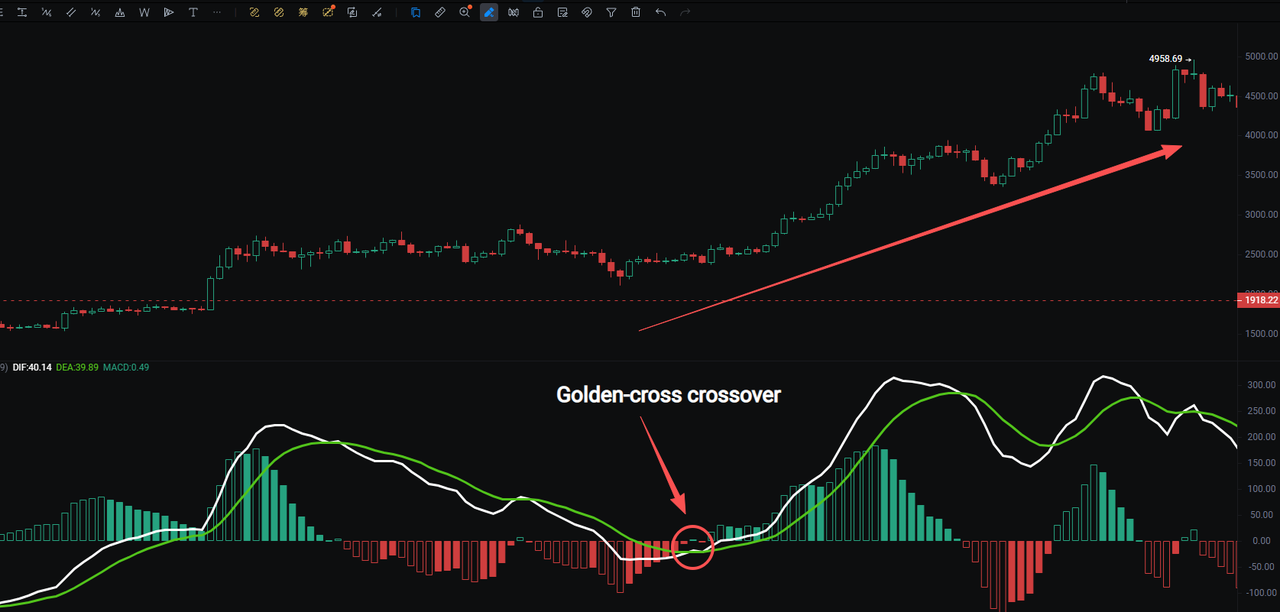
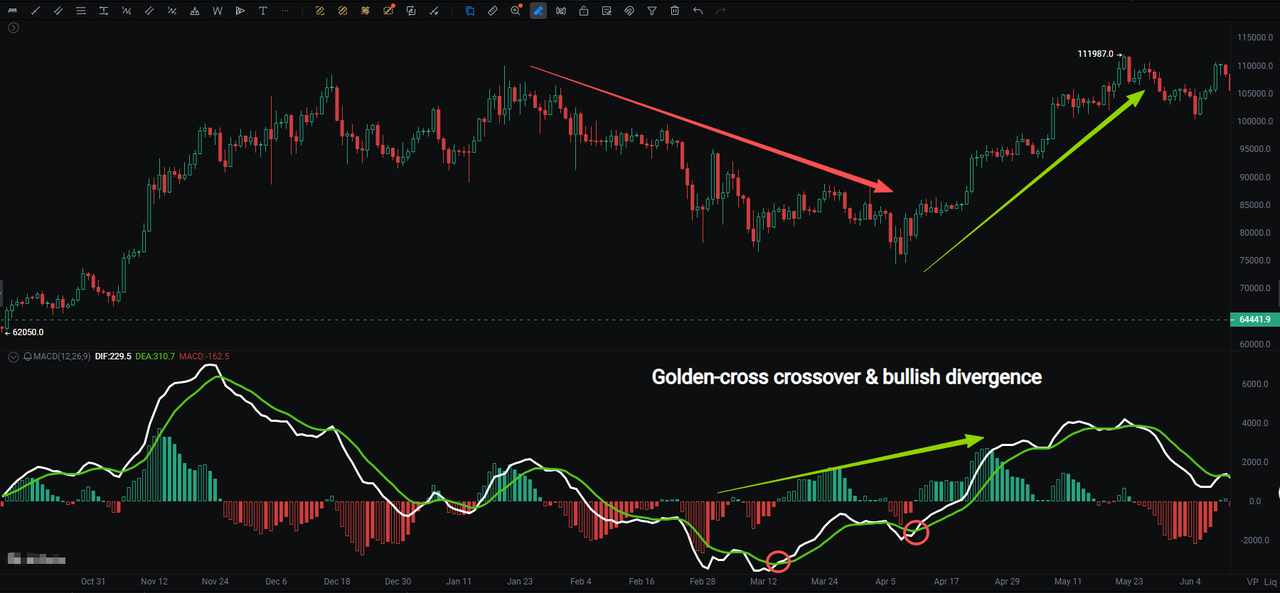
1.Golden Cross: A Bullish Trend Initiation Signal
Pattern Characteristics:
In a lower price range, the DIF line crosses above the DEA line from below. The green histogram bars continue to shrink, while red bars begin expanding for the first time.
Market Interpretation:
Bearish momentum has weakened significantly, while buying pressure starts to enter the market. This pattern often indicates the beginning of a short-term rebound or a potential upward trend.
Trading Approach:
A golden cross formed near market lows is generally considered a relatively lower-risk bullish signal. Traders can look for confirmation from key support levels before entering long positions and follow the emerging trend.
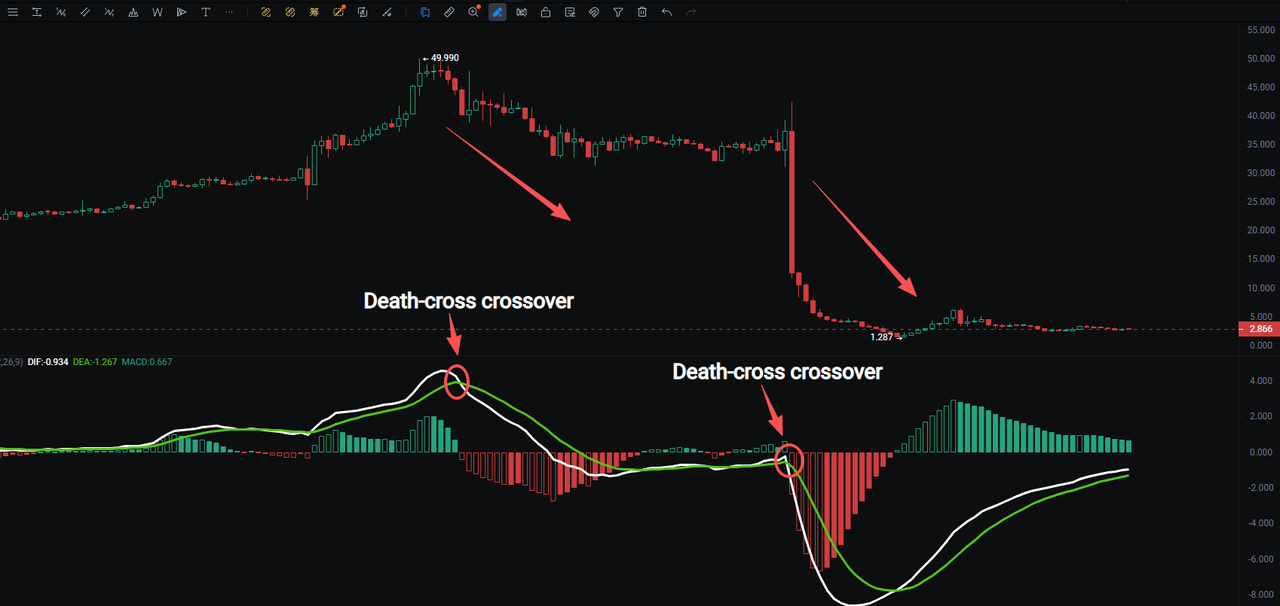
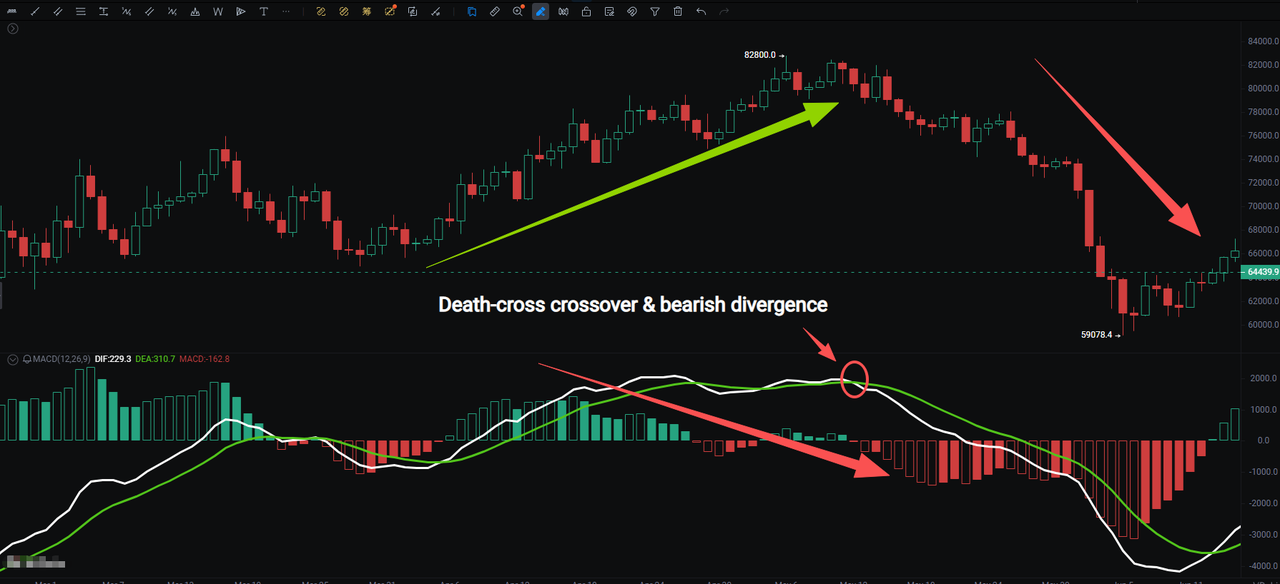
2.Death Cross: A Bearish Trend Reversal Signal
Pattern Characteristics:
In a higher price range, the DIF line crosses below the DEA line from above. Red histogram bars begin expanding, while green bars continue to weaken.
Market Interpretation:
Bullish momentum is losing strength, and buying pressure is fading. This pattern may signal the beginning of a short-term pullback or a broader downward trend.
Trading Approach:
A death cross at higher price levels is often viewed as a risk warning. Traders may consider opening short positions along the trend or taking profits on existing long positions. Avoid blindly buying dips or holding losing positions against the trend.
3.Bearish Divergence: A Potential Top Reversal Signal
Pattern Characteristics:
The price continues to make new highs, but the MACD lines and histogram peaks continue to decline, showing that momentum is failing to keep pace with price growth.
Market Interpretation:
The upward momentum is weakening, suggesting that buying pressure may be exhausted. This pattern can indicate a potential market top and an increased risk of a price reversal.
Trading Approach:
Avoid chasing further upside moves. Consider reducing positions at higher levels and watch for a death cross confirmation before entering short positions.
4.Bullish Divergence: A Potential Bottom Reversal Signal
Pattern Characteristics:
The price continues to make new lows, but the MACD lines and green histogram bars gradually contract, indicating that bearish momentum is weakening.
Market Interpretation:
Selling pressure is being exhausted, and bears are losing control of the market. This pattern may suggest that a potential bottom is forming.
Trading Approach:
Avoid continuing to chase downward moves. Consider gradually building long positions and adding exposure after a golden cross confirms a potential trend reversal.
Advanced EA-Based MACD Confluence Strategies
1.MACD + EMA30 Moving Average Confluence
Use the moving average to identify the overall trend direction across larger timeframes.
- When the moving average shows a bullish alignment, only consider MACD golden cross signals for long positions and ignore death cross signals;
- When the moving average shows a bearish alignment, only consider MACD death cross signals for short positions and ignore golden cross signals.
This approach helps traders avoid counter-trend trades and improve signal accuracy by aligning MACD signals with the broader market trend.
2.MACD + Bollinger Bands (BOLL) Confluence
Combining MACD with Bollinger Bands helps traders distinguish between trending and ranging market conditions.
- Trending markets: When Bollinger Bands expand and the MACD histogram continues to increase, it confirms strong directional momentum. Traders can follow the trend and attempt to capture a larger price movement.
- Ranging markets: When Bollinger Bands contract and flatten while MACD repeatedly generates golden crosses and death crosses, traders should avoid trend-following strategies. This environment is more suitable for short-term range trading, such as buying near support and selling near resistance.
3.MACD + Key Support and Resistance Level Filtering
Key support and resistance levels can help filter out low-quality MACD signals.
- A MACD bearish divergence + death cross near a major resistance level can provide a higher-probability short setup;
- A MACD bullish divergence + golden cross near a major support level can provide a higher-probability long setup.
This combination helps traders avoid unreliable signals that appear in the middle of a trading range.
4.MACD + Classic Candlestick Patterns for Precision Entries
Combining MACD signals with classic candlestick patterns can help traders identify more precise entry points by confirming trend, price action, and momentum.
- When bullish reversal patterns such as Morning Star, W Bottom, or Bullish Engulfing patterns appear together with MACD bullish divergence and a golden cross, traders can identify potential long entry opportunities near market lows.
- When bearish reversal patterns such as Evening Star, M Top, or Bearish Engulfing patterns appear together with MACD bearish divergence and a death cross, traders can identify potential short entry opportunities near market highs.
This creates a three-layer confirmation system combining trend direction, chart patterns, and momentum signals.
Practical Trading Example
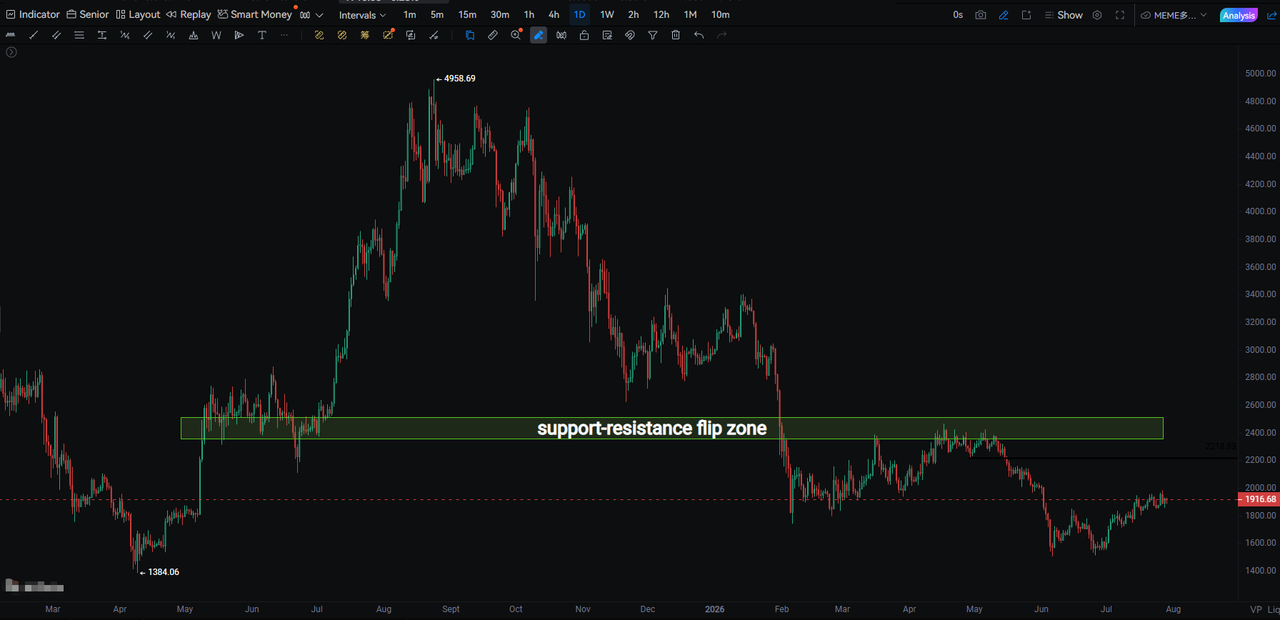
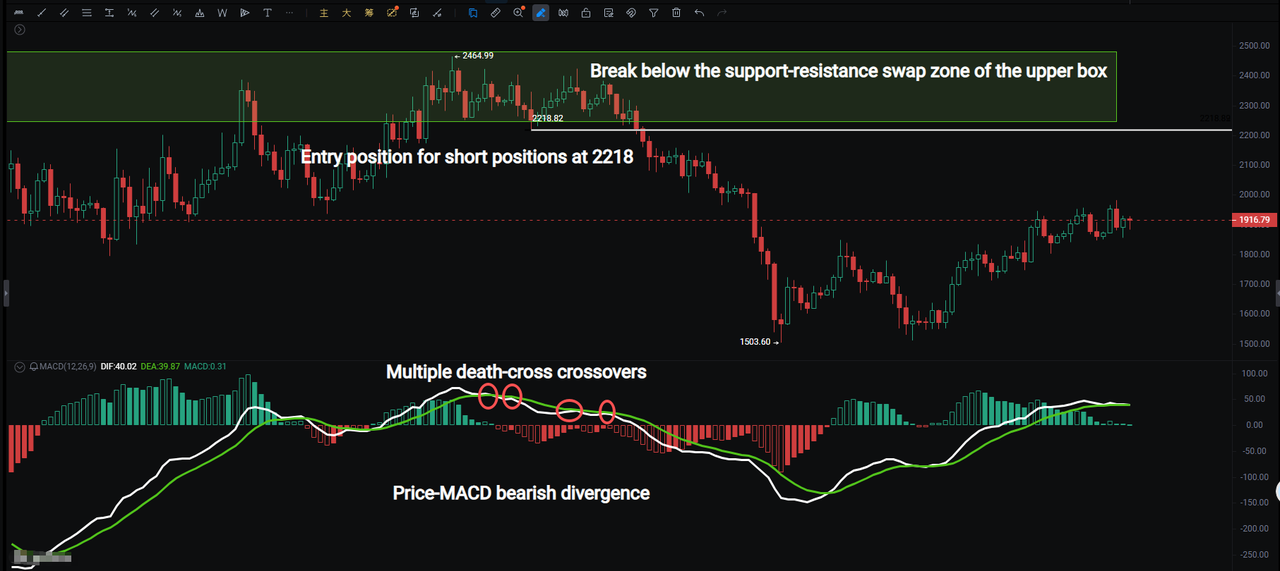
ETH/USDT Perpetual Futures (Daily Chart: Support-Resistance Flip + MACD Bearish Divergence Short Setup)
Step 1: Identify the Overall Market Structure
After a strong upward move, ETH entered a topping phase and began to pull back. The previous key consolidation support zone (highlighted by the green box) was decisively broken.
The former support zone then changed its role and became a strong resistance area, forming a support-resistance flip zone.
Step 2: Capture Key Signals + Confirm the Breakdown
The price rebounded and retested the green support-resistance flip zone but failed to break back above the area after multiple attempts.
Meanwhile, the MACD histogram, DIF line, and DEA line failed to make new highs alongside the price, creating a bearish divergence between price action and MACD momentum.
Bearish divergence indicates that upward momentum is weakening. Afterward, the price declined again and broke below the key level, confirming the bearish setup and marking the beginning of a downward trend.
Step 3: Identify the Entry Timing
Trend-following short entry:
When the price rebounds into the support-resistance flip zone and faces rejection, combined with a MACD death cross and confirmed bearish divergence, traders can consider opening short positions around the 2,218 level.
Secondary entry opportunity:
If the price rebounds toward the resistance zone again and encounters further selling pressure, while MACD forms another death cross, traders can consider adding to their short positions.
Step 4: Set Take-Profit and Stop-Loss Levels
Stop-loss:
Set the stop-loss approximately 5% above the upper boundary of the support-resistance flip zone.
If the price breaks back above the zone with strong trading volume, it indicates that the resistance has failed and the market may return to a bullish structure. Traders should exit positions promptly to avoid the risk of a false breakdown.
Take-profit:
- The first take-profit target can be set near the previous swing low. Consider taking partial profits when the target is reached;
- The second take-profit target can be based on a MACD golden cross confirmation and the price reclaiming key rebound moving averages. Close the remaining position after these signals appear.
Step 5: Leverage Management Principles
- For conservative trading, keep leverage at 10x or below;
- For aggressive short-term trading, leverage should generally not exceed 20x;
- Limit each position size to no more than 10% of total account capital;
- Avoid holding oversized losing positions and waiting for a reversal.
BANK/USDT Perpetual Futures (4-Hour Chart: Sharp Rejection + MACD Death Cross Short Setup)
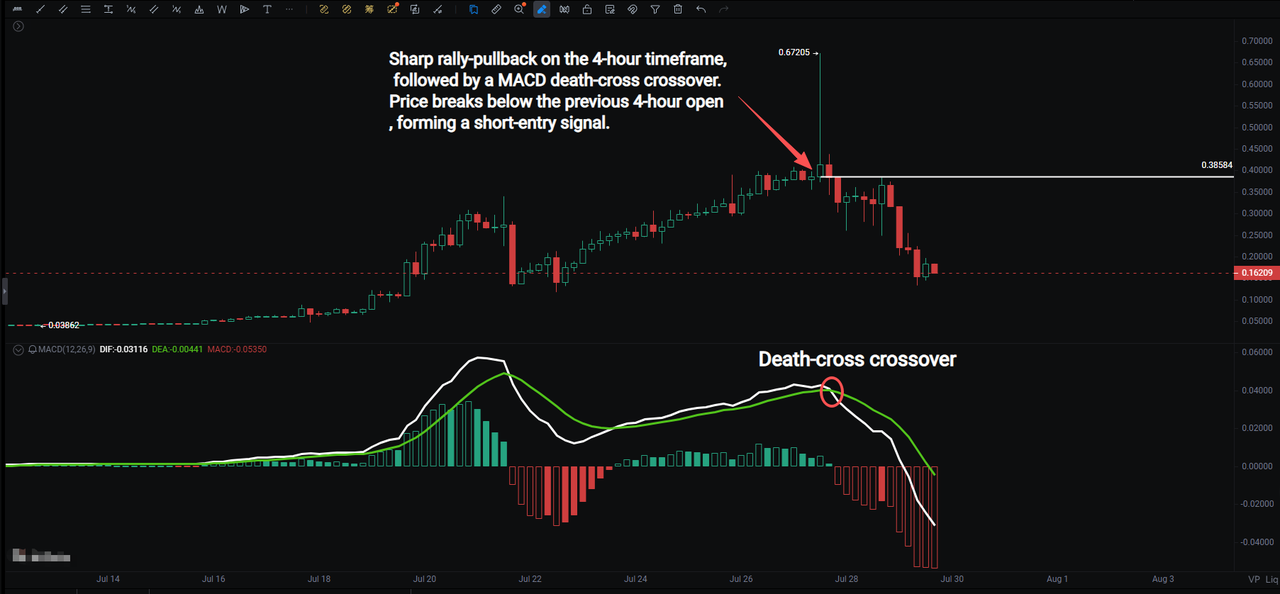
Step 1: Identify the Overall Market Structure
After a sustained upward trend, BANK continued to rally as bullish momentum pushed the price higher, reaching a local high of 0.67205.
However, after reaching the peak, bullish momentum quickly weakened. The candlestick chart showed a sharp rejection from higher levels, indicating that the previous upward trend had lost strength.
The market gradually shifted from a strong bullish phase into a top formation and resistance phase, waiting for further confirmation of a potential bearish reversal.
Step 2: Capture Key Signals + Confirm the Breakdown
After the sharp rally and pullback, the MACD formed a death cross, signaling weakening bullish momentum.
At the same time, the price broke below the previous 4-hour candle's opening price and fell below the key resistance level at 0.38584.
The combination of multiple signals confirmed the bearish setup, suggesting that a downward move was beginning.
Step 3: Identify the Entry Timing
Trend-following short entry:
After the 4-hour candle closed with a confirmed MACD death cross and the price broke below 0.38584, traders could consider opening short positions in the direction of the trend.
Secondary entry opportunity:
If the price later rebounds and retests the 0.38584 resistance level, then faces rejection, traders can consider adding to short positions.
Step 4: Set Take-Profit and Stop-Loss Levels
Stop-loss:
Place the stop-loss approximately 5% above the 0.38584 resistance level.
If the price successfully reclaims this level, the bearish setup becomes invalid. Traders should exit positions to avoid further losses.
Take-profit:
- The first take-profit target can be set near the previous support low. Consider reducing positions gradually as the target is reached;
- Close the remaining position when MACD forms a golden cross and the price moves back above the resistance level.
Step 5: Leverage Management Principles
- For conservative trading, keep leverage at 10x or below;
- For aggressive short-term strategies, leverage should generally not exceed 20x;
- Limit each position size to no more than 10% of total account capital and avoid holding oversized losing positions;
- In a bearish trend, consider adding short positions gradually when price rebounds into resistance zones, while strictly following stop-loss rules.
⚠️ Risk Warning: MACD Trading Risk Management and Common Pitfalls
- Distinguish Between Trending and Ranging Markets to Avoid Overtrading
MACD signals are generally more reliable during strong trending markets. However, in sideways or ranging conditions, MACD can frequently generate false golden crosses and death crosses.
During consolidation phases, traders should reduce unnecessary trades and wait for higher-quality signals confirmed by divergence and price breakouts to avoid repeated stop-loss triggers.
- Do Not Rely on a Single Indicator: Use Multi-Dimensional Confirmation
A single MACD signal has clear limitations. Traders should combine MACD with other technical tools, including moving averages, Bollinger Bands, candlestick patterns, and key support and resistance levels.
Independent signals that lack confirmation from multiple factors should be ignored. This approach can help improve trade quality and optimize the risk-reward ratio.
- Follow the Trend and Avoid Blindly Predicting Tops or Bottoms
During a broader bullish trend, traders should focus primarily on MACD golden cross long setups instead of opening short positions against the trend.
During a broader bearish trend, traders should focus on MACD death cross short setups rather than blindly attempting to catch bottoms.
Avoid making counter-trend trades based on personal assumptions, averaging down on losing positions, or holding losing trades in the hope of a reversal, as these behaviors can lead to significant drawdowns.
- Prioritize Higher Timeframe Signals and Ignore Short-Term Market Noise
MACD signals on lower timeframes, such as 5-minute and 15-minute charts, are more likely to be affected by market noise and may produce less reliable signals.
Signals from higher timeframes, such as daily and 4-hour charts, tend to be more stable and less prone to false movements. Beginners should prioritize higher timeframe analysis when building MACD-based trading strategies.
- Strictly Follow Take-Profit and Stop-Loss Rules to Avoid Emotional Trading
When MACD divergence, golden crosses, or death crosses appear, traders should execute their predefined trading plans instead of holding positions based on hope or emotional decisions.
Using platform alert features to receive timely signal notifications can also help reduce subjective mistakes caused by fear and greed.
Disclaimer
This article is not intended to provide:
(i) investment advice or investment recommendations;
(ii) an offer or solicitation to buy, sell, or hold digital assets; or
(iii) financial, accounting, legal, or tax advice.
Digital assets you hold, including stablecoins and NFTs, involve significant risks and may experience substantial price volatility. You should carefully consider whether trading or holding digital assets is suitable for you based on your financial circumstances.
For advice specific to your situation, please consult your legal, tax, or investment professionals. You are solely responsible for understanding and complying with all applicable local laws and regulations.
About Bitunix
Bitunix is a global cryptocurrency derivatives exchange trusted by over 5 million users across more than 150 countries/districts. The platform is committed to providing a transparent, compliant, and secure trading environment for every user. Bitunix offers a fast registration process and a user-friendly verification system supported by mandatory KYC to ensure safety and compliance.
With global standards of protection through Proof of Reserves (POR) and the Bitunix Care Fund, Bitunix prioritizes user trust and fund security. The K-Line Ultra chart system delivers a seamless trading experience for both beginners and advanced traders, while leverage of up to 200x and deep liquidity make Bitunix one of the most dynamic platforms in the market.
Bitunix Global Accounts
X | Telegram Announcements | Telegram Global | CoinMarketCap | Instagram | Facebook | LinkedIn | Reddit | Medium