
Article Summary
- This article provides a comprehensive explanation of statistical arbitrage in the context of cryptocurrency trading.
- It breaks down the technical and conceptual aspects of statistical arbitrage and how it influences market dynamics.
- The guide explores practical applications for traders and how to use statistical arbitrage to identify trading opportunities.
- It highlights common pitfalls and how to avoid them when trading based on statistical arbitrage.
- The article concludes with actionable advice for incorporating statistical arbitrage into your trading strategy.
- Advanced traders understand that cryptocurrency markets are driven by more than simple price moves. Prices react to liquidity, leverage, exchange structure, funding rates, stablecoin demand, volatility, and trader behavior. Statistical arbitrage sits inside that wider picture because it looks for relationships between assets that temporarily move out of line.
- At its core, statistical arbitrage is a data-based trading approach. Instead of betting only on whether Bitcoin, Ethereum, or another asset will rise, the trader studies whether two or more related assets have moved too far apart compared with their usual relationship. The trade idea comes from the expectation that the relationship will normalize.
- This guide explains how the strategy works, how traders identify opportunities, and how to manage risk when using it in crypto trading. It also explains why platforms matter. When traders use a crypto exchange like Bitunix, they need accurate pricing, fast execution, and clear market data because small pricing gaps can disappear quickly.
What Is Statistical Arbitrage in Crypto Markets?
Statistical arbitrage is a trading strategy that uses data, probability, and market relationships to find pricing inefficiencies. A trader does not simply ask whether an asset is cheap or expensive by itself. Instead, the trader compares one asset with another asset, a basket, a market index, or its own historical pattern.
A common example is pairs trading. Suppose two Layer 1 assets usually move together, but one suddenly rises much faster than the other without a clear reason. A trader can short the stronger asset and buy the weaker asset, expecting the spread between them to narrow.
When traders ask what is statistical arbitrage, the practical answer is that it is a rules-based way to trade temporary divergence. The edge comes from measurement, as traders study correlation, spread behavior, volatility, mean reversion, and execution costs before they enter.
Technical Definition
In technical terms, statistical arbitrage uses historical data to identify relationships between assets and trade when those relationships are deviated. The model often starts with correlation, but correlation alone is not enough. Two assets can move together for a while and then break apart when market structure changes. More advanced models use cointegration, spread z-scores, principal component analysis, clustering, regression, and volatility adjustment.
A 2025 SSRN paper on crypto statistical arbitrage using PCA tested this approach by building eigenportfolios, estimating mean reversion using an Ornstein-Uhlenbeck process, and using walk-forward validation. The paper's summary was cautious, which is healthy for this topic. It found that the approach showed room for improvement but did not appear fully robust in crypto markets.
How It Works
A typical statistical arbitrage setup starts with a trader filtering for pairs or baskets with enough liquidity, related behavior, and tradable spreads. BTC and ETH are common starting points, but traders also study exchange tokens, Layer 1 assets, DeFi tokens, liquid staking tokens, and stablecoin pairs.
The trader then measures the spread, which can be a price difference, price ratio, regression residual, or basket deviation. After that, the trader calculates how unusual the current spread is compared with its history. A z-score is common here because it shows how far the spread has moved from its average.
If the spread moves far enough from its normal range, the model signals a possible entry, and the trader exits once the spread returns toward its average. In live markets, that setup only works when the expected profit exceeds the full trading cost, including fees, slippage, funding rates, borrowing costs, latency, and liquidity gaps.
Market Impact
Statistical arbitrage affects crypto markets by narrowing temporary price gaps. When many traders buy the underpriced asset and sell the overpriced asset, they help bring prices back toward a more balanced relationship.
This activity supports market efficiency, especially across exchanges and related assets. In highly liquid markets, these gaps close quickly as bots and market makers compete to fill them. In smaller tokens, the gaps last longer, but execution risk is higher.
The size of the derivatives market also matters. CoinGlass estimated that crypto derivatives trading volume reached about $85.70 trillion in 2025, with average daily turnover near $264.5 billion. Large derivatives markets create more hedging and arbitrage paths, but they also create leverage risk when positioning becomes crowded.
Historical Examples
One well-known crypto example is the Kimchi Premium, where Bitcoin has traded at higher prices on South Korean exchanges than on global markets. This is usually treated as spatial arbitrage, but it also gives statistical arbitrage traders useful data because the premium can be measured, tracked, and compared with stablecoin demand, capital controls, and local market pressure.
A 2025 study on stablecoins and cross-border crypto market integration examined the Kimchi premiums of Bitcoin and USDT. It found a cointegrating relationship between the two premiums and estimated that deviations from parity mean-reverted with a half-life of about 24 minutes. That is exactly the kind of relationship advanced traders look for, even if they cannot always trade it cleanly after fees and restrictions.
Another example comes from market regime shifts. FalconX reported that in Q1 2026, spot volumes across leading exchanges totaled $2.2 trillion, down 36% from the previous quarter and 49% from a year earlier. Futures volume across 14 venues totaled $10.3 trillion, down 22% quarter over quarter and year over year. Lower volume changes spreads, slippage, and signal quality, which directly affects statistical arbitrage models.
Finding Statistical Arbitrage Setups With Data
Statistical arbitrage starts with measurement: a chart can help you see when two related assets are moving apart, but the strategy depends on data analysis that tests whether the relationship has been stable enough to trade. Traders usually compare spreads, z-scores, correlations, and cointegration to distinguish a normal price move from a statistically unusual divergence.
Use Data to Spot Divergence
Good statistical arbitrage starts by choosing assets that have a clear reason to move together, such as the same sector, user base, market narrative, chain ecosystem, or liquidity profile. Common examples include BTC and ETH, similar Layer 1 tokens, liquid staking assets, or assets with close economic links.
Once the candidate assets are selected, traders measure the historical relationship through a price ratio, rolling correlation, regression, or cointegration test. If the relationship is stable enough, they track when the current spread moves far from its average and decide whether the divergence is large enough to act on.
A simple trader-friendly setup uses three lines: the spread, the rolling mean, and upper and lower z-score bands. When the spread reaches an extreme, the model flags a possible trade.
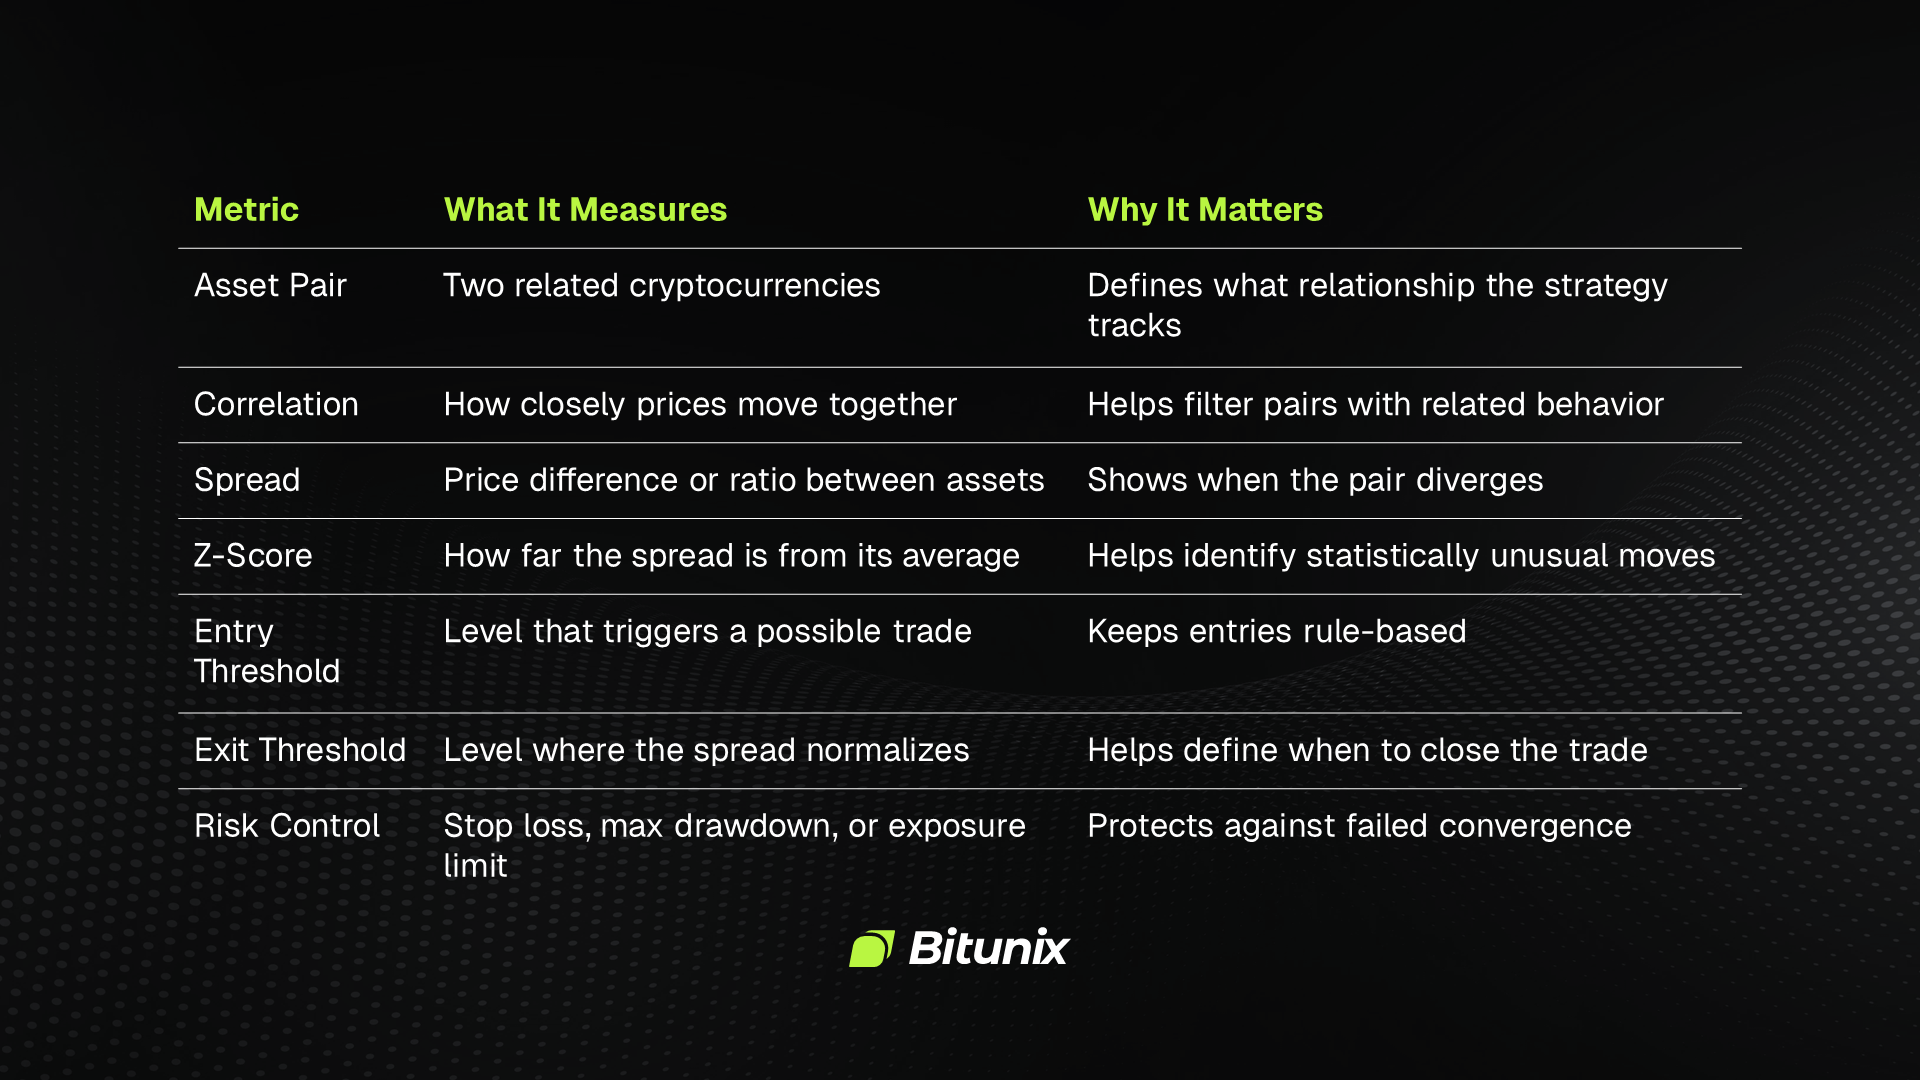
Statistical arbitrage uses metrics like correlation, spread, z-score, and risk controls to identify when related crypto assets move too far apart and when a trade should be opened or closed.
Track the Right Indicators
Statistical arbitrage traders usually watch spread, correlation, z-score, cointegration, volatility, liquidity, volume, and funding rates. In spot-only pairs, the spread and z-score are the center of the model. In futures or perpetual markets, funding rates matter because they change the cost of holding a position.
Open interest provides traders with useful context by showing whether positions are building or unwinding. When open interest rises, more traders are adding exposure; when it falls, the market is usually deleveraging. FalconX found that aggregate futures open interest ended March 2026 at $56.5 billion, down 54% from the October 2025 peak of $122.2 billion, suggesting arbitrage models should be less aggressive as crowded positioning is cleared out.
Volume context also improves market analysis because strong participation makes signals more reliable and weak participation increases execution risk. CME reported that spot-quoted crypto futures reached their highest combined quarterly volume in Q1 2026, exceeding 4.5 million contracts. This growth gives traders more price references across regulated derivatives markets. Still, it also forces them to compare spot, futures, and perpetual markets more carefully before acting on an arbitrage signal.
Match the Timeframe to the Strategy
The timeframe you choose changes how the entire statistical arbitrage model behaves. A high-frequency model can trade tiny deviations that last seconds, while a swing model looks for spread deviations over days or weeks. A portfolio model works on a longer schedule and usually rebalances baskets over broader market cycles.
Short timeframes need faster execution, lower fees, and stronger infrastructure. Long timeframes give traders more time to act, but they expose positions to regime shifts, news, funding costs, and liquidity changes.
For most advanced retail traders, the middle ground is more realistic. Daily and four-hour data can help identify persistent relationships without forcing you to compete directly against professional market-making systems.
Confirm Before Acting
A statistical signal needs confirmation before it becomes a trade. Traders often confirm with volume, order book depth, funding rates, volatility, and market direction. If the entire market is selling off, a spread can keep widening far longer than the model expects.
Technical analysis can also help. Support and resistance, trend structure, moving averages, and volatility bands add context. The goal is to avoid entering a spread trade during a larger market break.
A useful confirmation checklist includes enough liquidity on both legs, stable borrow or margin access, acceptable fees, no major upcoming token unlock, and no obvious news event driving the divergence. If a token is moving because of a real catalyst, mean reversion becomes less reliable.
Trading Statistical Arbitrage in Practice
A statistical arbitrage model is only useful if you can trade it with discipline. The entry, exit, risk limit, and position size need to be defined before the trade starts.
Build Rule-Based Entries
An entry strategy should define exactly when the spread is unusual enough to trade. For example, a trader can enter when the spread reaches a z-score of plus or minus 2.0, and liquidity is strong on both assets. Some traders use wider thresholds, such as 2.5 or 3.0, to reduce false signals.
The entry also needs a clear direction based on which asset has moved too far from the relationship. If Asset A has risen too much compared with Asset B, the trade can short Asset A and buy Asset B. If Asset A has fallen too far, the trade can buy Asset A and short Asset B. When traders ask what is statistical arbitrage in a practical trading context, the answer should include this rule-based structure.
Set Exits Before the Trade
Clear exit rules usually focus on spread normalization, so traders should decide in advance when the position will close. A common approach is to exit when the z-score returns to 0, 0.5, or another pre-set level. Some traders also scale out as the spread compresses instead of closing the full position at once.
A defined stop is also necessary because a widening spread can show that the original relationship has broken. That can happen after protocol news, liquidity migration, listing changes, exchange outages, regulatory pressure, or a shift in market leadership.
Time-based exits help traders avoid staying in weak setups for too long. If a spread does not normalize within the expected window, the trade becomes of lower quality. A five-day mean-reversion trade that has not moved after three weeks is usually telling you that the setup no longer fits the original plan.
Manage Risk Like the Model Can Be Wrong
Statistical arbitrage is built on probability, so risk management needs to assume that the model can fail even when the setup looks clean. Traders should use stop losses, max drawdown limits, exposure caps, and volatility rules before entering the trade to protect capital when the relationship stops behaving as expected.
Recent research on crypto statistical arbitrage also supports a cautious approach. The SSRN study below shows that even advanced models can struggle when tested in live-style crypto conditions:
"This paper explores the application of principal component analysis (PCA) in statistical arbitrage trading. The methodology involves constructing eigenportfolios, estimating the Ornstein-Uhlenbeck process for residual mean reversion, and implementing a walk-forward validation framework. Performance metrics indicate that the approach may not be robust in the cryptocurrency market, but room for improvement definitely exists."
That warning is useful for traders because a model that worked in one backtest can fail when liquidity changes, fees rise, or market relationships break.
Size Positions With Both Legs in Mind
Position sizing in statistical arbitrage is different from a single long trade. You need to size both legs so the trade reflects the relationship you are testing. Equal-dollar sizing works for simple pairs, but beta-or volatility-adjusted sizing is often better.
For example, if one asset is twice as volatile as the other, equal dollar sizing can leave you with more risk on one side, volatility-adjusted sizing reduces that imbalance, and beta-adjusted sizing helps when one asset reacts more strongly to BTC or the broader market. Position size should also account for liquidity. A small-cap pair with a beautiful z-score can become a trap if the order book is thin.
Risks That Traders Need to Respect
Statistical arbitrage can be useful, but it is not a shortcut around risk. It works best when the trader understands the model, the market structure, and the cost of being wrong.
The Signal Does Not Guarantee Mean Reversion
A wide spread does not guarantee that prices will move back together. Sometimes the divergence appears because the market has new information, such as stronger adoption for one asset, weaker liquidity for another, token unlock pressure, protocol risk, or a change in investor demand.
A statistical arbitrage signal should serve as a trigger for deeper analysis, since the model indicates the relationship has moved outside its usual range. However, the trader still needs to decide whether the move is temporary or justified by a real market change.
Market Context Comes First
Broader market conditions shape every spread trade. In a risk-on market, high-beta assets can keep outperforming for longer than the model expects, while in a risk-off market, weaker assets can fall harder and stay weak. During deleveraging, correlations can also break down because traders often sell whatever they can, not necessarily what they want to sell.
The 2025 ESRB report warned that financial stability risks were rising as crypto-assets, stablecoins, investment products, and multi-function crypto groups became more connected to mainstream finance. That context matters for arbitrage traders because macro shocks can change relationships across assets and venues.
False Signals Are Common
False signals appear when the data says divergence, but the market structure says stay away. Low liquidity, stale prices, exchange maintenance, token unlocks, bridge problems, and listing news can all create misleading spreads.
Backtests also create false confidence. If the model ignores fees, slippage, funding rates, borrow costs, taxes, and rejected orders, the result looks cleaner than live trading.
Combine the Model With Other Tools
Statistical arbitrage works best with other tools. Technical analysis helps identify trend conditions, volatility regimes, and support or resistance areas, fundamental analysis helps explain why one asset is moving differently from another, and order book analysis helps confirm whether the trade can be executed at a fair price.
Conclusion: Mastering Statistical Arbitrage for Trading Success
Statistical arbitrage is an important concept that advanced traders use to identify trading opportunities. It helps you study relationships between assets, measure unusual divergence, and trade possible mean reversion with clear rules.
By understanding and applying statistical arbitrage effectively, you can improve your trading process by making your trades more structured, easier to review, and less dependent on impulse.
Ready to apply statistical arbitrage to your trading strategy? Download the Bitunix app and register to access trading tools, real-time market data, and a crypto trading environment built for active market participants.
FAQ
What exactly is statistical arbitrage?
Statistical arbitrage is a data-driven trading strategy that seeks to exploit temporary pricing discrepancies across related assets. Traders measure relationships such as spreads, correlations, and z-scores, then trade when the relationship moves far from its historical pattern and shows signs of mean reversion.
How does statistical arbitrage affect cryptocurrency prices?
Statistical arbitrage can reduce price gaps between related crypto assets or venues. When traders buy the underpriced asset and sell the overpriced one, their activity helps bring prices closer together. This supports market efficiency, especially in liquid pairs and active derivatives markets.
How can I identify statistical arbitrage in the market?
You can identify it by tracking related assets, measuring their spread, and checking whether the current gap is unusual compared with history. Common tools include rolling correlation, z-score, cointegration tests, regression residuals, and spread charts across spot and derivatives markets.
Is statistical arbitrage a reliable trading signal?
Statistical arbitrage is useful, but it is not a guaranteed signal. It works best when the relationship between assets is stable, liquidity is strong, and costs are controlled. Signals become less reliable during major news events, market crashes, and liquidity shocks.
How should I use statistical arbitrage in my trading strategy?
Use it as a structured trading strategy with clear entry, exit, stop-loss, and position-limits rules. Do not trade a spread just because it looks unusual. Confirm the signal with liquidity, volatility, funding rates, market trend, and asset-specific news.
What are the risks of trading based on statistical arbitrage?
The main risks include false signals, widening spreads, high fees, slippage, funding costs, exchange outages, and broken asset relationships. A pair that looked stable in the past can stop behaving the same way after new information enters the market.
Can statistical arbitrage be predicted in advance?
Traders can model likely opportunities by studying historical relationships, volatility, liquidity, and spread behavior, but they cannot predict every opportunity with certainty. Crypto markets change quickly, so statistical models need regular testing, updated data, and strict risk controls.
How does statistical arbitrage differ across different cryptocurrencies?
Statistical arbitrage works differently depending on liquidity, sector, volatility, exchange coverage, and market structure. BTC and ETH pairs usually have tighter spreads and faster convergence. Small-cap assets can show larger gaps, but they also carry more slippage and execution risk.
Should I combine statistical arbitrage with other indicators?
Yes. Statistical arbitrage works better when combined with technical analysis, order book data, funding rates, volatility measures, and fundamental analysis. These tools help you filter out weak signals and avoid trades where the spread reflects real market change rather than temporary mispricing.
Where can I learn more about statistical arbitrage?
Start with academic papers on pairs trading, cointegration, PCA, and mean reversion. Then study crypto market reports, exchange data, derivatives volume, funding rates, and order book behavior. Practice with small size or paper trading before using real capital.
Glossary
- Statistical Arbitrage: A data-driven trading method that looks for temporary pricing gaps between related assets.
- Pairs Trading: A strategy that buys one asset and sells another related asset based on spread divergence.
- Spread: The price difference, ratio, or model residual between two related assets.
- Z-Score: A measure showing how far a value is from its average in standard deviation terms.
- Mean Reversion: The tendency of a price, spread, or metric to move back toward its average.
- Correlation: A measure of how closely two assets move together over time.
- Cointegration: A statistical relationship where assets share a long-term equilibrium even if prices move separately.
- Principal Component Analysis: A method that reduces complex asset data into main factors or portfolios.
- Ornstein-Uhlenbeck Process: A mathematical model often used to describe mean-reverting behavior.
- Backtest: A test that applies a strategy to historical data to evaluate past performance.
- Walk-Forward Validation: A testing method that updates a model through time to reduce overfitting.
- Slippage: The difference between the expected execution price and the actual execution price.
- Funding Rate: A payment exchanged between long and short perpetual futures traders.
- Open Interest: The total value or number of outstanding derivatives contracts.
- Technical Analysis: The study of price, volume, trend, and market structure to support trading decisions.
Disclaimer
This article does not provide:
(i) investment advice or investment recommendations;
(ii) an offer or solicitation to buy, sell, or hold digital assets;
(iii) financial, accounting, legal, or tax advice.
Digital assets, including stablecoins and NFTs, involve high risk and may fluctuate significantly. Consider whether trading or holding digital assets is appropriate for you given your financial situation. Consult a qualified legal, tax, or investment professional when needed. You are responsible for understanding and complying with applicable local laws and regulations.
About Bitunix
Bitunix is a global cryptocurrency derivatives exchange trusted by over 3 million users across more than 100 countries. At Bitunix, we are committed to providing a transparent, compliant, and secure trading environment for every user. Our platform features a fast registration process and a user-friendly verification system supported by mandatory KYC to ensure safety and compliance. With global standards of protection through Proof of Reserves (POR) and the Bitunix Care Fund, we prioritize user trust and fund security. The K-Line Ultra chart system delivers a seamless trading experience for both beginners and advanced traders, while leverage of up to 200x and deep liquidity make Bitunix one of the most dynamic platforms in the market.
Bitunix Global Accounts
X | Telegram Announcements | Telegram Global | CoinMarketCap | Instagram | Facebook | LinkedIn | Reddit | Medium