Article Summary
- This article provides a comprehensive explanation of supply and demand trading in the context of cryptocurrency markets.
- It breaks down the fundamental concepts of supply and demand zones and how they influence price movements.
- The guide explores how to identify supply and demand zones on charts and use them to anticipate reversals and breakouts.
- It highlights practical applications for traders, including how to combine supply and demand analysis with other technical tools.
- The article concludes with actionable advice for integrating supply and demand trading into a comprehensive trading strategy.
- The principle of supply and demand drives every price movement in the market. When demand exceeds supply, prices rise, and when supply exceeds demand, prices fall.
- Supply zones are areas where sellers previously overwhelmed buyers and pushed prices lower, while demand zones are areas where buyers previously overwhelmed sellers and pushed prices higher. These zones help traders spot where the price has reacted before and where it can react again.
- Crypto traders often use these zones to plan entries, exits, and risk before placing orders on a crypto exchange such as Bitunix. This guide explains how to identify supply and demand zones, what market psychology sits behind them, and how to use them inside a practical trading strategy.
Understanding Supply and Demand Zones
Supply and demand zones are price areas where buying or selling pressure previously became strong enough to shift the price. In crypto, those areas can form after sharp rallies, liquidation moves, breakout failures, or high-volume reactions around key price levels.
Market depth, bid-ask spreads, and slippage also affect how cleanly those zones work.
S&P Global's 2025 crypto liquidity report defines market depth as the fiat value of potential trades near the current price and slippage as the difference between the expected and actual trade outcome. That matters because a zone on a liquid BTC pair behaves differently from a zone on a thin altcoin.
1. Where Sellers Take Control
Supply zones are price areas where sellers previously stepped in with enough force to stop a move higher. Traders usually identify them near previous resistance, failed breakouts, or sharp drops that started from a tight range.
A strong supply zone often begins with the price moving sideways for a short period before dropping quickly. That fast move lower shows that sellers overwhelmed buyers at that level. When price returns to the same area later, traders watch for renewed selling pressure.
A trader asking what is supply and demand trading should start here: supply zones show where the market previously had more willing sellers than buyers.
2. Where Buyers Step In
Demand zones are price areas where buyers previously entered with enough strength to stop a decline. Traders usually find them near previous support, sharp rebounds, or areas where the price rejected lower levels with strong volume.
A clean demand zone often forms before a strong upward move. Price pauses, buyers absorb available supply, and then the market pushes higher. When the price revisits that area, traders look for signs that buyers are still defending it.
Demand zones are especially useful in crypto because pullbacks can be fast. A token can fall into a prior buying area, wick lower, and recover quickly, giving you a clear place to watch.
3. The Psychology Behind the Zones
Supply and demand zones work because traders remember pain, missed opportunities, and break-even levels. In a supply zone, some traders who bought near the top want to exit when the price returns to their entry, while other traders see the same level as a short opportunity because sellers controlled it before.
In a demand zone, the opposite often happens. Traders who missed the previous bounce look for a second chance to buy, and traders who sold too early may re-enter. Short sellers may cover positions, which adds more buying pressure.
A useful market microstructure quote from Investopedia connects this idea to order book behavior:
"Level II stock data can give you unique insight into a stock's price action, supply and demand, and levels of support and resistance."
Crypto order books differ from Nasdaq stock order books, but the core idea carries over. Buyers and sellers cluster around levels, and those clusters shape price reactions.
4. What Makes a Zone Strong
Strong zones usually exhibit clean price action, visible imbalance, and sufficient volume to reflect real participation. A zone that creates a sharp reaction from a narrow base is often stronger than a messy area with overlapping candles.
Repeated touches can help validate a zone, but they need context. One or two clean retests can show that buyers or sellers are still defending the area, while too many tests can weaken the zone because resting orders are gradually filled or absorbed on each visit. Once the price stops clearly reacting, the zone becomes less useful as a trading signal.
CoinGecko's 2025 crypto liquidity report shows why depth matters. On BTC order books, Binance held about $8 million in liquidity on both sides, within plus or minus $100 of the market price, while liquidity varied across other assets and exchanges. Deep order books can absorb larger trades, while shallow books can break zones faster.
Identifying Supply and Demand Zones
Finding useful zones starts with historical price action, especially areas where the price paused before moving away with force. That sharp move away is the main clue because it shows that buyers or sellers had enough pressure to take control. Support and resistance zones are often treated as areas rather than exact lines, and traders usually watch them for possible reversals, breakouts, or retests.
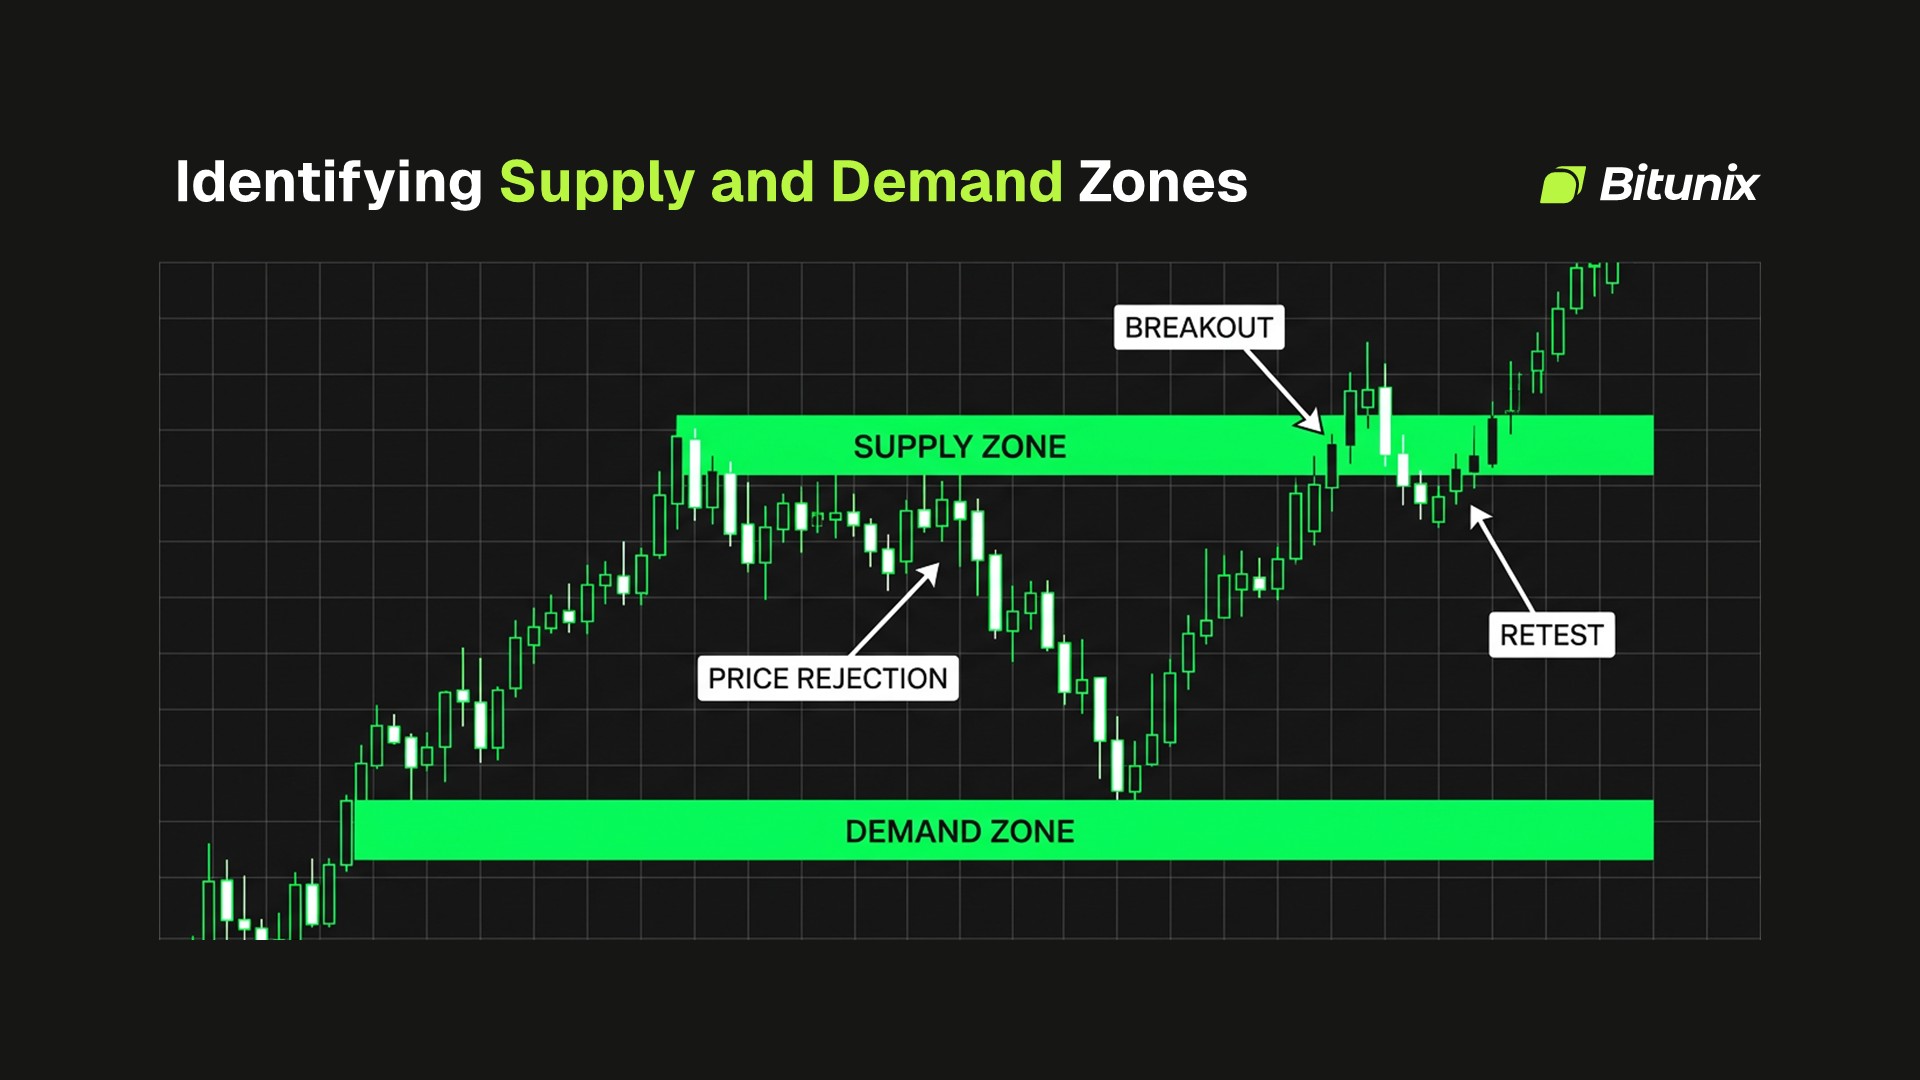
Supply and demand zones help traders identify where price has reacted before, then watch for rejection, breakout, or retest signals.
Reading Historical Reversals
Historical price action helps you see where important reversals started. Look for sharp drops that began from a tight area to identify supply, and for strong bounces that began from a tight area to identify demand.
The strongest zones are easy to identify because the price reacted to them with a clear move. A useful zone usually has a visible pause, a sharp reversal or breakout, and enough space between the base and the next move to show a real imbalance. If the level only appears after heavy zooming or repeated adjustments, it is probably too weak or unclear to use as a primary trading signal.
When someone asks what is supply and demand trading, the answer is that it is a trading method that uses past imbalance areas to plan future reactions, and the goal is to identify where risk and reward make sense.
Using Volume as Confirmation
Volume helps confirm whether a zone formed with real participation. A sharp price move on high volume shows that more traders took part in the imbalance. A weak move on low volume can still matter, but it usually needs extra confirmation.
CoinGlass reported that crypto derivatives trading volume reached about $85.70 trillion in 2025, with average daily turnover near $264.5 billion. That scale shows how leverage and derivatives activity can amplify reactions around major price levels, especially when stops and liquidations cluster near supply or demand zones.
Volume adds useful context, but it should not be treated as proof by itself. Some trading activity comes from hedging, liquidations, or market-maker adjustments, so traders should read volume alongside price reaction and zone structure. A zone with a strong move away and rising volume deserves more attention because higher volume often shows stronger participation behind a price move, while a quiet level with no clear reaction gives less evidence.
Choosing the Right Timeframe
The timeframe you choose affects how reliable a supply or demand zone is. Higher-timeframe zones, such as daily and weekly levels, usually carry more weight because they reflect broader market participation and reduce short-term noise.
Lower-timeframe zones can help with entries, but they create more false signals. A practical approach is to start with a higher timeframe to define the trend and major zones, then use a lower timeframe to refine entry, stop-loss, and target levels. Multi-timeframe analysis helps traders combine a wider market context with more precise execution.
Looking for Multiple Confirmations
Multiple confirmations help you filter weaker zones by checking whether different signals support the same idea. A strong demand setup can combine prior support, rising volume, a bullish candlestick pattern, and a higher-timeframe uptrend. A strong supply setup can combine previous resistance, declining momentum, higher sell volume, and bearish rejection. Technical analysis commonly uses price levels, volume, trend structure, and indicators together because each tool adds a different layer of confirmation.
CME's 2025 liquidity research warned against relying on order book depth alone, explaining that liquidity needs a broader view that includes volume, market impact, and other metrics beyond the top of the order book.
Practical Trading Applications and Strategies
Supply and demand trading works best when you define the zone, wait for the price to return, and plan the trade before the reaction happens. The setup should tell you where to enter, where the idea fails, and where to take profit.
Buying Reactions from Demand
Trading from demand zones means looking for long setups when the price returns to an area where buyers previously took control. The idea is that if buyers defended that zone before, they can defend it again.
A basic long setup starts with the price approaching a demand zone from above. Then you watch for confirmation, such as a bullish engulfing candle, a long lower wick, rising volume, or a break above a small local resistance level. The stop usually sits below the zone, where the trade idea fails.
This approach works better when the broader trend supports it. Buying a demand zone inside an uptrend is cleaner than buying one during a strong market-wide sell-off.
Selling Reactions from Supply
Trading from supply zones means looking for short setups or long exits when the price returns to an area where sellers previously dominated. The setup strengthens when the price reaches supply after an extended rally.
A basic short setup starts with the price approaching a supply zone from below. Then you watch for bearish confirmation, such as rejection wicks, a bearish engulfing candle, falling momentum, or a failed breakout above the zone. The stop usually sits above the zone.
This style helps traders avoid emotional entries. Instead of shorting just because the price looks high, you wait for the price to reach a level where sellers have already shown strength.
Trading Breakouts and Retests
Breakout trading occurs when a price breaks through a supply or demand zone rather than reversing. A break above the supply can signal that buyers absorbed selling pressure, while a break below the demand can signal that sellers overwhelmed buyers.
A retest often gives traders a cleaner setup than the first breakout candle because it shows whether the broken zone can hold its new role. After price breaks above a supply zone, that former selling area can act as support on a pullback. After price breaks below a demand zone, that former buying area can act as resistance. Traders then watch the retest for confirmation, since broken resistance often becomes support, and broken support often becomes resistance.
CoinDesk Data reported that combined spot and derivatives volume on centralized crypto exchanges fell 2.41% to $5.61 trillion in February 2026, the lowest level since October 2024. Lower activity can make breakouts less reliable on smaller pairs, so confirmation matters even more when liquidity thins.
Managing Risk Around Zones
Risk management should precede every supply or demand trade, because the zone also defines where your idea becomes invalid. For long trades from a demand zone, many traders place the stop loss below the zone, where a clean break shows buyers failed to defend the area. For short trades from a supply zone, the stop usually sits above the zone, where a breakout shows sellers no longer control that level. Stop-loss orders are commonly used to limit losses when the price reaches a predefined level, but execution can vary in fast or volatile markets.
Position size should depend on the distance between your entry and stop. A wider zone means more risk per unit, so the position should usually be smaller. A tighter zone can allow a more precise setup, but only when liquidity is strong enough to reduce slippage. Before entering, define your entry, invalidation level, and target so the trade has a clear structure instead of becoming a reaction to every candle.
Limitations and Considerations
Supply and demand zones are useful planning tools, but they do not guarantee that the price will reverse. Strong trends can push straight through a zone when buying or selling pressure is powerful enough, especially during news-driven moves, liquidation events, or periods of low liquidity.
The timeframe behind each zone affects how much weight it deserves. Daily and weekly zones usually reflect broader participation, while lower-timeframe zones can produce more false reactions and noisy entries. A practical approach is to use higher timeframes to define major levels, then use shorter timeframes only to refine entries, stops, and targets. Multi-timeframe analysis helps traders connect long-term trend direction with more precise execution levels.
The broader market context should also guide how aggressively you trade each setup. Reuters reported in 2026 that Bitcoin's market depth had fallen from more than $8 million in 2025 to around $5 million in early 2026, which made prices more sensitive to smaller trades. In thinner conditions, supply and demand zones can break faster, wicks can stretch further, and stop losses can trigger more easily.
Supply and demand analysis works best when combined with other technical tools. Moving averages can help define trend direction, RSI can signal momentum exhaustion, and volume can confirm whether a reaction has real participation. Low-liquidity altcoins are especially prone to false breakouts, so confirmation matters more when trading smaller pairs or unstable market conditions.
Conclusion: Mastering Supply and Demand Trading
Supply and demand zones represent the fundamental driver of price movement in cryptocurrency markets. They show where buyers or sellers previously took control, and they help traders plan around key price levels instead of reacting to every candle.
By learning how to identify clean zones, confirm them with volume, choose the right timeframe, and manage risk around invalidation levels, you can build a more structured trading strategy. You will still take losing trades, everyone does, but the difference is that your losses become planned.
Ready to apply supply and demand trading to your strategy? Download the Bitunix app and register today to access charting tools, review key zones, and practice trading with a clear plan.
FAQ Section
What exactly is a supply zone?
A supply zone is a price area where sellers previously overwhelmed buyers, pushing the market lower. Traders watch these zones because price can reject from them again, especially when the level forms after a sharp drop, a failed breakout, or high-volume selling pressure.
What exactly is a demand zone?
A demand zone is a price area where buyers previously absorbed selling pressure and pushed the market higher. Traders often look for these zones near previous support or sharp rebounds, since they can mark areas where buyers are willing to defend the price again.
How do I identify supply and demand zones on a chart?
You identify supply and demand zones by looking for areas where the price paused briefly before moving away with force. A sharp drop from a base suggests supply, while a sharp rally from a base suggests demand.
How reliable are supply and demand zones?
Supply and demand zones become more reliable when they form on higher timeframes, show clear price rejection, and align with volume or trend structure. They are still not guaranteed to hold, so traders need confirmation and stop losses around every setup.
What happens when the price breaks through a supply or demand zone?
A breakthrough in a zone shows that the previous imbalance has failed or changed. Broken supply can become support after a bullish breakout, while broken demand can become resistance after a bearish breakdown.
How should I set my stop loss when trading supply and demand zones?
A common stop-loss placement sits beyond the zone, below demand for long trades and above supply for short trades. This gives the setup room to react while defining the point where the trade idea no longer makes sense.
Can I use supply and demand trading on all timeframes?
Supply and demand trading works on all timeframes, but higher-timeframe zones are usually more reliable. Shorter timeframes can help with entries, yet they create more noise and false signals. Your timeframe should match your trade duration and risk tolerance.
How does volume affect supply and demand zones?
Volume helps show whether a zone formed with strong market participation. A sharp move away from a zone with rising volume suggests a stronger imbalance. Low-volume reactions can still work, but they need more confirmation from trend, candles, or retests.
Should I combine supply and demand analysis with other indicators?
Combining supply and demand analysis with other tools can improve signal quality. Moving averages help define trends, RSI can show momentum exhaustion, and volume confirms participation. Keep the chart simple so the extra tools support your decision rather than create confusion.
Where can I practice identifying supply and demand zones?
You can practice by reviewing historical charts and marking where prices made sharp reversals, breakouts, and retests. Bitunix provides charting tools and multiple timeframes, which can help you study zones, compare market structure, and test your process before trading live.
Glossary
- Supply Zone: A price area where sellers previously overwhelmed buyers and pushed the price lower.
- Demand Zone: A price area where buyers previously overwhelmed sellers and pushed the price higher.
- Price Level: A specific area on a chart where traders expect the price to react.
- Support: A price area where buying pressure often slows or reverses a decline.
- Resistance: A price area where selling pressure often slows or reverses a rally.
- Breakout: A move above resistance or supply that signals stronger buyer control.
- Breakdown: A move below support or demand that signals stronger seller control.
- Retest: A return to a broken level to check whether it now acts as support or resistance.
- Volume: The amount of an asset traded during a specific period.
- Liquidity: The ease of buying or selling an asset without causing a large price move.
- Slippage: The difference between the expected trade price and the actual executed price.
- Market Depth: The amount of buy and sell orders available near the current price.
- Technical Analysis: The study of charts, volume, and indicators to evaluate market behavior.
- Trading Strategy: A structured plan for entries, exits, position sizing, and risk.
- Stop Loss: A planned exit level used to limit losses when the price moves against the trade.
Disclaimer
This article does not provide:
(i) investment advice or investment recommendations;
(ii) an offer or solicitation to buy, sell, or hold digital assets;
(iii) financial, accounting, legal, or tax advice.
Digital assets, including stablecoins and NFTs, involve high risk and may fluctuate significantly. Consider whether trading or holding digital assets is appropriate for you given your financial situation. Consult a qualified legal, tax, or investment professional when needed. You are responsible for understanding and complying with applicable local laws and regulations.
About Bitunix
Bitunix is a global cryptocurrency derivatives exchange trusted by over 3 million users across more than 100 countries. At Bitunix, we are committed to providing a transparent, compliant, and secure trading environment for every user. Our platform features a fast registration process and a user-friendly verification system supported by mandatory KYC to ensure safety and compliance. With global standards of protection through Proof of Reserves (POR) and the Bitunix Care Fund, we prioritize user trust and fund security. The K-Line Ultra chart system delivers a seamless trading experience for both beginners and advanced traders, while leverage of up to 200x and deep liquidity make Bitunix one of the most dynamic platforms in the market.
Bitunix Global Accounts
X | Telegram Announcements | Telegram Global | CoinMarketCap | Instagram | Facebook | LinkedIn | Reddit | Medium