Ever since Bitcoin’s second halving in 2016, the 4-year cycle has become one of the most discussed paradigms in the crypto sector. It relies on the Bitcoin network’s quadrennial block reward halving and was traditionally thought to coincide with the cyclical bull and bear markets. But as we move through late 2026, with widespread adoption via spot bitcoin ETFs and an uncertain macroeconomic environment, we find ourselves two years after the April 2024 halving. Many traders and experts wonder, has the bitcoin 4 year cycle come to an end, or is the bitcoin cycle pattern still functioning?
What is the Bitcoin 4-Year Cycle?
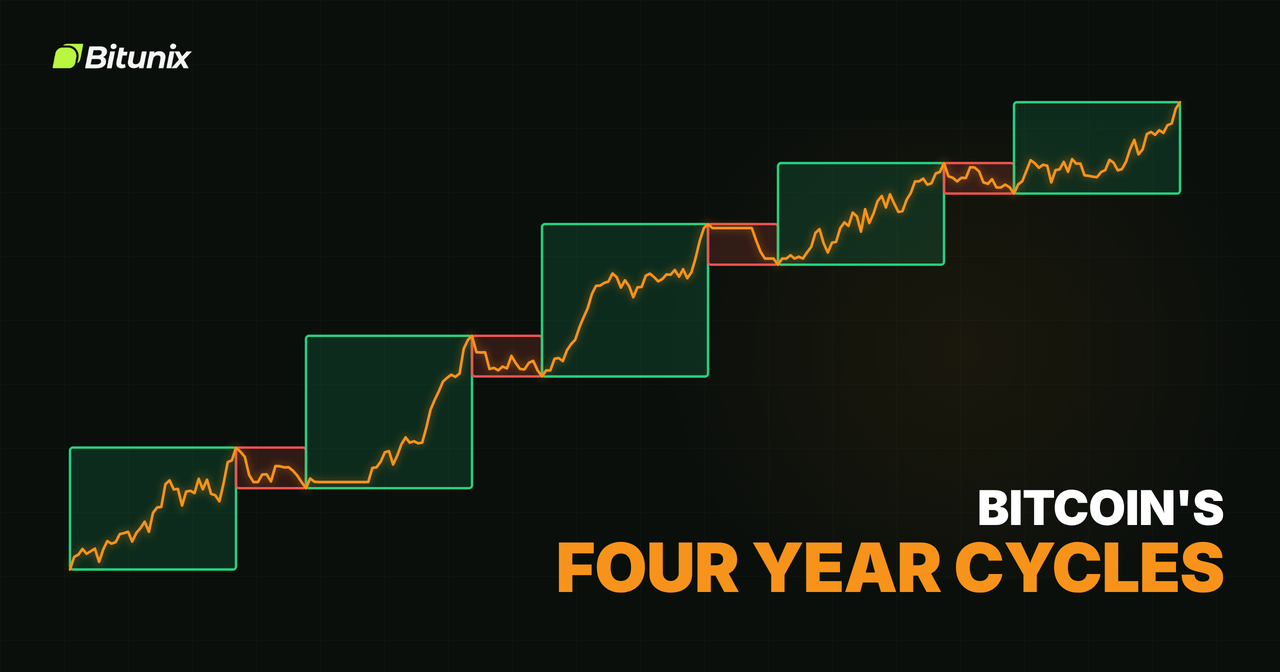
Bitcoin 4-Year Cycle
The Bitcoin 4-year cycle, also referred to as the BTC cycle, is a market trend theory that is founded on Bitcoin’s programmed reduction of the BTC supply through the halving. Around every four years, which is every 210,000 blocks, Bitcoin’s block reward (the BTC amount that is handed out to miners when a block is mined) will be cut in half. The Bitcoin halvings have occurred on the following dates:
Nov. 28, 2012 (50 BTC to 25 BTC per block)
July 9, 2016 (25 BTC to 12.5 BTC)
May 11, 2020 (12.5 BTC to 6.25 BTC)
April 19, 2024 (6.25 BTC to 3.125 BTC)
The next halving is expected around April 2028, at block 1,050,000, when the reward will fall from 3.125 BTC to 1.5625 BTC.
Each halving causes fewer new BTC tokens to enter into circulation. Given normal supply-demand economics, fewer supply should mean upward price pressure, assuming demand remains the same or increases. With about 95.7% of all 21 million BTC already mined, each halving now removes a much smaller share of total supply than in Bitcoin's early years, one reason for the long-term case for Bitcoin as digital gold.
Historical Cycle Performance
The Bitcoin halving cycles have historically created this pattern:
After the 2012 halving, Bitcoin climbed to roughly $1,150 during the latter part of 2013 (from about $12 on the halving day).
After the 2016 halving, Bitcoin hit a peak of approximately $19,800 in December 2017, roughly 17 months after the halving.
After the 2020 halving, Bitcoin hit a peak of $69,000 in Nov. 10, 2021, approximately 18 months after the 2020 halving.
Bull market peaks happening about 12 to 18 months following each halving is considered the main evidence supporting the cycle. This pattern has been attributed to predictable supply dynamics, the behavior of miners and other investors, and market sentiment.
Each cycle also ended in a bear market. Here is the full picture, from halving to peak to bottom:
Cycle peak | Months from halving to peak | Bear-market low | Peak-to-low drawdown |
|---|
About $1,130 (Nov 2013) | About 12 | About $152 (Jan 2015) | About −85% |
About $19,700 (Dec 2017) | About 17 | About $3,120 (Dec 2018) | About −84% |
About $69,000 (Nov 2021) | About 18 | About $15,500 (Nov 2022) | About −77% |
About $126,080 (Oct 2025) | About 17.5 | About $58,000 (June 2026, so far) | About −54% |
Sources: CoinGecko, K33 Research. Exchange quotes differ slightly; the 2026 low is the lowest level so far, not a confirmed cycle bottom.
The timing has stayed consistent, but each cycle has been smaller: measured from the halving-day price, the peak gain fell from about 9,100% to about 98%, and drawdowns shrank from about 85% to about 54%. For the longer story, see Bitcoin's price history.
The 2024 Halving and the Current Cycle
The current Bitcoin cycle began in April 2024, when the block reward was cut in half from 6.25 BTC per block to 3.125 BTC per block. The typical pattern from historical 4-year cycles would imply the next Bitcoin price peak occurs between mid to late 2025, with 2026 possibly representing the early phase of a bear market correction. That is close to what happened: BTC peaked at about $126,080 in October 2025, then fell to a low near $58,000 in June 2026.
But the 2024 BTC cycle brought something new to the table: The introduction of spot Bitcoin ETFs in the US in January 2024. ETF products like BlackRock’s BTC ETF and the Fidelity Bitcoin ETF brought in substantial capital from the institutional space and other long-term buyers who historically were not active participants in the previous cycles. These institutional buyers are unlikely to be prone to selling on a whim to meet quarterly goals or because the media reports that the Bitcoin price has dropped significantly. Even so, ETF flows proved to work in both directions: US spot Bitcoin ETFs saw about $4.5 billion in net outflows in June 2026, their worst month since launch, before inflows returned from August. As of October 2026, they hold about $106 billion in assets, roughly 6% of Bitcoin's market value.
What happened in the 2024–2026 cycle
Date | Event |
|---|
March 2024 | BTC sets a new all-time high near $73,800, the first record ever set before a halving |
April 19, 2024 | Fourth halving at block 840,000 |
October 6, 2025 | Cycle peak at about $126,080 |
October 10, 2025 | More than $19 billion in leveraged positions liquidated in one day |
February 2026 | BTC drops to about $60,000 as ETF outflows build |
June 2026 | Record ETF outflows; BTC hits its low so far near $58,000. Strategy sells BTC for the first time since 2022 |
August–October 2026 | ETF inflows return; BTC makes higher lows near $75,000 and then $80,000 |
Sources: CoinGecko, The Block, SoSoValue via TokenPost.
>>> Further reading: what drove Bitcoin's 2026 sell-off.
Is the Bitcoin 4-Year Cycle Broken in 2026?
The primary question regarding the bitcoin cycle theory in 2026 is whether institutional adoption of bitcoin and demand from BTC ETFs has fundamentally altered the cycle’s magnitude and timing. Or, whether supply dynamics are still the driving factor behind this four-year pattern long-term.
The main argument that the bitcoin 4-year cycle is not dead in 2026 is that the supply reduction hasn’t changed and still works according to its designed schedule. The Bitcoin network will keep halving every four years, cutting the number of new BTC tokens entering into circulation in half. Miners continue to have an incentive to sell to cover operational costs, and this selling pressure can affect market price action. Supply was reduced as usual, ETF-driven demand rose, and the cycle did produce a new all-time high on a similar timeline to past cycles. Fidelity's Jurrien Timmer said in December 2025 that the October high "fits pretty well" with the four-year cycle (CoinDesk).
The counter-argument suggests that the Bitcoin halving cycle may not hold in 2026 and beyond since institutional Bitcoin investors like ETFs are not subject to selling pressure based on speculative sentiment. It could even out the steep up-and-down swings we’ve seen before. And because of the bitcoin ETF, the cycle now attracts a new kind of buyer—one whose accumulation and sell-offs are dictated by institutional rebalancing rather than the manic fear-of-missing-out we usually see from retail traders.
The 2026 data supports part of this view: the drawdown was much shallower than in past bear markets, and analysts such as Bitwise's Matt Hougan and Standard Chartered's Geoff Kendrick argue that ETF flows and liquidity now matter more than the halving.
Where the latest cycle stands against the old pattern:
What held | What changed |
|---|
Peak about 17.5 months after the halving, inside the usual 12–18 month window | A new all-time high came before the halving (March 2024) for the first time |
2026 turned into a bear year, as in 2014, 2018 and 2022 | Drawdown so far of about 54%, versus 77–87% in past bear markets |
Leverage built up near the top and was flushed out | ETF flows and macro news, more than miner selling, drove the biggest moves |
Where Is Bitcoin in the Cycle Now? Key Indicators to Watch
As of mid-October 2026, Bitcoin trades around $82,000. The June 2026 low has held for four months and price has made higher lows since, but whether it was the cycle bottom is still debated. In past cycles, the bottom came 12 to 14 months after the peak, which would point to late 2026. These indicators help show where price sits within the cycle:
Indicator | What it measures | Historical bottom signal | Recent reading |
|---|
Realized price | Average price at which all BTC last moved on-chain | Price at or below it | About $52,000 (July 2026); the June low held above it |
200-week moving average | Long-term trend line | Price touches or dips below it | About $62,000 (July 2026) |
MVRV ratio | Market value vs realized value | Below 1 | About 1.5–1.6 (September 2026) |
MVRV Z-score | How stretched MVRV is vs its history | Below 0 | About 0.2 at the June 2026 low |
Sources: Glassnode, Cointelegraph. Readings change daily.
If the old pattern holds, late 2026 to the April 2028 halving would be the accumulation phase. If the cycle has changed, Bitcoin's path is more likely to follow interest rates, ETF flows and global liquidity. For analyst forecasts, see our Bitcoin price prediction for 2026-2030.
How to Trade the Bitcoin Cycle on Bitunix
Whether or not the 2026 cycle will line up perfectly in a 4-year pattern, it remains clear that bitcoin is the most liquid and actively traded digital asset within the crypto derivatives sector. You can trade the 24/7 liquidity of BTCUSDT perpetual futures on Bitunix via USDT margin to enter the BTCUSDT perp in the long, short or neutral direction you expect given the phase of the current bitcoin market cycle.
As a cycle trader, use the bitcoin halving cycle as just one of several inputs into your analysis to identify entry and exit areas on bitcoin along with other fundamental indicators like on-chain data and macro conditions as well as technicals. It is impossible for any cycle trader in 2026 to tell with certainty whether the June 2026 low was the bottom of this cycle. But we can be certain that the market will continue to price in those views in real time as new information becomes available.
A few tools can help you act on a cycle view while managing risk:
Use lower leverage in volatile phases. Learn how leverage works and how to avoid liquidation; the October 2025 liquidation wave showed how fast crowded positions unwind.
Chart Trading lets you place orders, drag TP/SL and see your liquidation level directly on the BTC chart.
Super Alert can notify you when BTC reaches key levels such as the 200-week moving average.
Demo trading lets you test a cycle-based plan with virtual funds first.
Conclusion
The bitcoin 4-year cycle is a major framework that many crypto market participants look to for understanding Bitcoin’s long-term price action. Now as we enter 2026, the question for crypto investors is whether the 4-year cycle holds or is simply changing because of the adoption of Bitcoin by institutional investors or even sovereign nations as a reserve asset. The 2024 halving cycle kept the old timing, peaking in October 2025, but its smaller rally and shallower drawdown suggest the pattern is changing rather than simply repeating.
While the Bitcoin halving has not changed, the markets have changed drastically in only 2.5 years and this has led to questions of whether the cycle will remain intact, change, or fundamentally morph. Ultimately the price action over the coming year and beyond (including the run-up to the 2028 halving) will determine whether a different cycle will emerge or merely a variation of a more familiar pattern. And for all you traders on Bitunix, the BTCUSDT Perp contract offers the liquidity to position yourself for any cycle view you hold regarding Bitcoin’s current cycle phase.
Glossary
Bitcoin Halving: A programmatic event occurring approximately every four years in which Bitcoin's block reward is reduced by 50%, permanently decreasing the rate of new BTC supply issuance.
Bitcoin 4-Year Cycle: A market pattern theory linking Bitcoin's bull and bear market phases to the approximately four-year interval between halving events.
Block Reward: The amount of Bitcoin issued to miners for successfully adding a new block to the blockchain; currently 3.125 BTC per block following the April 2024 halving.
Spot Bitcoin ETF: An exchange-traded fund that holds actual Bitcoin as its underlying asset, approved in the United States in January 2024 and enabling institutional and retail investors to gain BTC exposure through regulated brokerage accounts.
Bitcoin Cycle Top: The price level at which a Bitcoin bull market peaks before entering a prolonged bear market or correction phase.
Bitcoin Cycle Bottom: The price level at which a bear market ends and accumulation of the next cycle begins.
On-Chain Data: Publicly available blockchain data including wallet activity, transaction volumes, miner flows, and exchange inflows/outflows, used to assess market conditions.
BTCUSDT Perpetual: The Bitcoin USDT-margined perpetual futures contract available on Bitunix for continuous Bitcoin trading.
Drawdown: The percentage fall from a peak to a later low.
Realized Price: The average price at which all bitcoin last moved on-chain, often seen as the market's overall cost basis.
MVRV: Market value divided by realized value; high readings have marked past cycle tops and low readings past bottoms.
About Bitunix
Bitunix is a global cryptocurrency derivatives exchange trusted by over 5 million users across more than 100 countries. The platform is committed to providing a transparent, compliant, and secure trading environment for every user. Bitunix offers a fast registration process and a user-friendly verification system supported by mandatory KYC to ensure safety and compliance. With global standards of protection through Proof of Reserves (POR) and the Bitunix Care Fund, Bitunix prioritizes user trust and fund security. The K-Line Ultra chart system delivers a seamless trading experience for both beginners and advanced traders, while leverage of up to 200x and deep liquidity make Bitunix one of the most dynamic platforms in the market.
Bitunix Global Accounts
X | Telegram Announcements | Telegram Global | CoinMarketCap | Instagram | Facebook | LinkedIn | Reddit | Medium


