Article Summary
- This article provides a comprehensive explanation of Doji candlesticks in the context of cryptocurrency trading.
- It breaks down the visual characteristics of Doji patterns and the market psychology behind their formation.
- The guide explores the different types of Doji candlesticks and what each variation signals about market sentiment.
- It highlights practical applications for traders, including how to use Doji patterns in conjunction with other technical indicators.
- The article concludes with actionable advice for integrating Doji pattern recognition into a broader trading strategy.
- Crypto charts often look challenging until you learn what each candle is trying to show. A single candlestick can tell you where the price opened, how far buyers pushed it, how far sellers pushed it back, and where the session finally closed. Among those trading patterns, the Doji is one of the clearest signs that neither side has full control.
- A Doji candlestick forms when the opening and closing prices are almost the same, leaving little or no candle body. The upper and lower wicks show how far the price moved during the session before returning close to where it started. For traders using a crypto exchange like Bitunix, recognizing Doji candles can improve technical analysis, especially when combined with support, resistance, volume, and trend context. Bitunix also integrated its spot and futures market data with TradingView in 2025, giving traders real-time K-line charts, price data, and volume visibility for supported pairs.
This guide explains how Doji candlesticks work, what each variation signals, and how you can use them in crypto trading.
What Is a Doji Candlestick? Understanding the Mechanics
When traders ask what a Doji candlestick is, the answer is that it is a candle whose open and close are nearly identical. The body is tiny or almost invisible, while the wicks can extend above, below, or in both directions. TradingView's 2025 educational chart describes the structure clearly:
"The Doji candlestick pattern forms when a candle's open and close prices are nearly identical, resulting in a small or nonexistent body with wicks on both sides."
The candle's shape reflects a temporary balance between buyers and sellers. Buyers may push the price higher during the session, while sellers may force it lower, but the close lands near the open. That creates the familiar cross-like structure with a tiny body and visible shadows, which is why Doji patterns are commonly linked to market indecision.
The wick structure matters because it shows the battle inside the session. A long upper wick means buyers tried to push the price higher, but sellers rejected the move. A long lower wick means sellers pushed the price down, but buyers stepped in. A candle with long wicks on both sides shows volatility in both directions, followed by a close near the open.
IG's 2026 candlestick guide explains that when a market's open and close are almost the same, traders should look for a short or nonexistent body with shadows of varying length. It also states that a Doji reflects a struggle between buyers and sellers that leaves neither side with a net gain, making it neutral by itself.
Crypto markets make this pattern especially useful because trading never stops. Bitcoin, Ethereum, and altcoins can react to macro news, ETF activity, liquidations, funding rates, and sudden sentiment shifts at any hour. In February 2025, Bitcoin fell 17.5%, marking its largest monthly loss since June 2022, after volatility rose and risk sentiment weakened. That kind of market environment makes candlestick signals useful for reading hesitation, failed momentum, and sudden shifts in buyer-seller control.
Types of Doji Candlesticks and Their Meanings
A Doji candlestick pattern becomes more useful when you identify its exact shape and location on the chart. A Doji after a long uptrend does not carry the same message as a Doji near support after a sell-off. The candle type matters, but the context decides whether the signal is worth acting on.
Doji candlestick types show different forms of market indecision, but traders should wait for confirmation before using them as reversal signals.
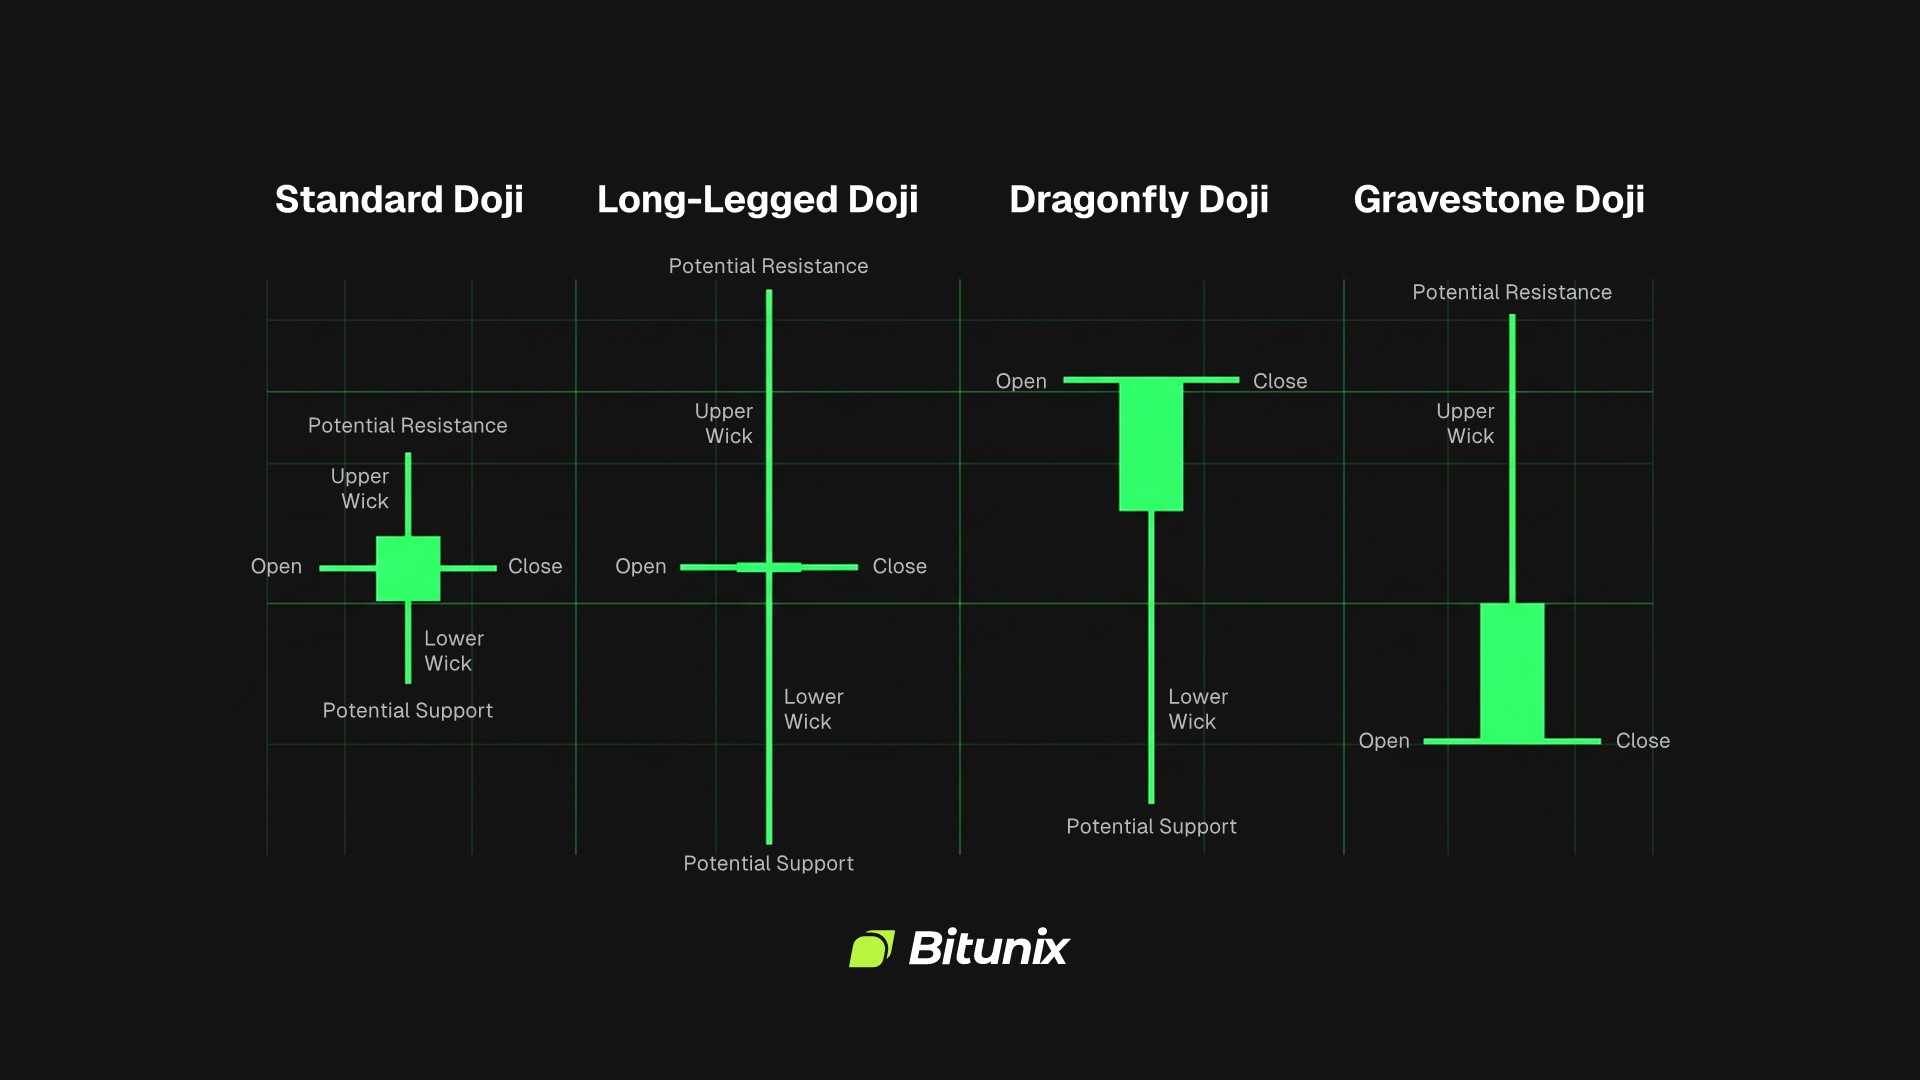
Standard Doji
A standard Doji has a very small body, with upper and lower wicks that are usually more balanced. It signals market indecision because the price moved during the session but closed near its opening level. This does not automatically mean the price will reverse, but that momentum has paused.
A standard Doji becomes more relevant near important chart levels. If it appears after a strong rally near resistance, it can show that buyers are losing conviction. If it appears after a sharp decline near support, it can show that sellers are no longer pushing as strongly.
Long-Legged Doji
A long-legged Doji has long upper and lower wicks, with the open and close near the middle of the candle. This candle shows heavy movement in both directions. Buyers had control for part of the session, sellers for another, and the close ended close to the starting point.
Long-legged Doji candles often appear during volatile periods. In crypto, they can show up around major liquidation events, news reactions, or rapid intraday reversals. A long-legged Doji tells you that the market has tested both sides and still has not made up its mind.
Dragonfly Doji
A dragonfly Doji has a long lower wick and little or no upper wick. The open, close, and high are close together, while the low sits far below. This structure shows that sellers pushed the price down during the session, but buyers stepped in and brought the price back near the open.
The dragonfly Doji often attracts attention after a downtrend or near support. It can signal that selling pressure is weakening and buyers are defending a level—still, confirmation matters. A stronger signal appears when the next candle closes higher, volume increases, or another indicator supports the rebound.
Gravestone Doji
A gravestone Doji has a long upper wick and little or no lower wick. The open, close, and low are close together, while the high sits far above. This shows that buyers pushed the price higher, but sellers rejected the move and forced the close back down.
A gravestone Doji is often watched near resistance or after an uptrend. It can suggest that bullish momentum is fading. IG's September 2025 market analysis used a gravestone Doji as a potential reversal signal, but also noted that confirmation would require a lower daily close below a specific support level.
Practical Trading Applications and Strategies
Doji candles are most useful when they become part of a broader trading process. The pattern shows hesitation, but the trade setup depends on where that hesitation appears, what the next candle does, and whether other tools confirm the signal. A stronger approach combines Doji recognition with support and resistance, trend direction, volume, moving averages, RSI, or MACD.
Identifying Trend Reversals
Doji patterns become more useful when they help you question whether a trend is losing strength. Instead of treating every Doji as a trade signal, use it to identify market indecision after a clear move. A gravestone Doji after a strong rally can show that buyers pushed higher but failed to hold control. A dragonfly Doji after a downtrend can show that sellers drove the price lower, but buyers defended the low. In both cases, the Doji gives the warning, while the next candle, volume, or another indicator provides confirmation.
Confirming Support and Resistance
Support and resistance can give Doji candles much stronger practical meaning when the pattern appears at a level traders already care about. A Doji in the middle of random sideways price action is often noise. A Doji at a previous swing high, at weekly support, at a Fibonacci level, or in a high-volume zone deserves more attention because it shows hesitation exactly where traders expect a reaction. TradingView's 2025 candlestick guide notes that candlestick patterns become more meaningful when they align with major chart areas such as support, resistance, trendlines, or retracement zones.
Combining Doji Patterns With Indicators
Moving averages, RSI, and MACD can help turn a Doji into a more structured trade setup. A dragonfly Doji near the 200-day moving average after a long decline can suggest buyers are defending a major level. A gravestone Doji near a falling 50-day moving average can suggest that the price is rejecting dynamic resistance. A dragonfly Doji near support becomes stronger if RSI shows oversold conditions, while a gravestone Doji near resistance becomes more relevant if MACD momentum weakens.
Managing Risk Around Doji Signals
Risk management needs to stay at the center of every Doji-based setup because the pattern shows indecision. If you trade a potential bullish reversal after a dragonfly Doji, the invalidation level often sits below the wick low. If you trade a potential bearish reversal after a gravestone Doji, the invalidation level often sits above the wick high. Position size should match that distance, because a clean candle with an oversized stop can still be a poor trade.
Limitations and Considerations
Doji patterns should never be used as standalone trading signals, as they only indicate indecision over a single candle. They do not provide a price target, confirm direction, or tell you whether the next move will be strong enough to trade. A Doji becomes useful when it fits into a larger structure that includes trend direction, volume, support, resistance, volatility, and risk control.
Timeframe selection changes the quality of a Doji signal because each candle captures a different amount of market activity. A Doji on a one-minute chart may only reflect a brief pause in order activity, but on a daily or weekly chart, it includes more trading behavior and usually carries more weight. Longer timeframes often matter more because they reflect decisions from a wider group of market participants.
False signals are common when traders treat every Doji as a reversal warning. A Doji can appear, the price can move slightly in one direction, and then nothing meaningful happens. That means traders need confirmation from the next candle, volume, trend structure, or another indicator before entering a position.
Market context can completely change how a Doji should be interpreted. In a strong bull trend, a single Doji may only mark a pause before continuation. In a strong bear trend, a dragonfly Doji may produce only a short bounce before sellers return. In a ranging market, Doji candles appear often because indecision is already the default state.
Crypto-specific conditions can also overpower a clean candlestick signal. Funding rates, liquidation clusters, ETF-related headlines, macro announcements, and exchange liquidity can all move prices faster than a Doji setup can confirm. If a Doji appears right before a major data release or during a liquidation cascade, the pattern can lose relevance quickly.
Conclusion: Mastering Doji Recognition
Doji candlesticks represent moments when buyers and sellers reach a temporary stalemate. That makes them valuable for traders who want to read market indecision, spot possible turning points, and improve their technical analysis.
The best use of Doji recognition is to look for the pattern after clear trends, near important levels, and alongside confirming indicators. Combine it with support and resistance, RSI, MACD, moving averages, volume, and disciplined stop placement.
Before placing your next trade, open the chart and practice identifying the candle body, wick structure, and surrounding trend. To build that habit in live markets, download the Bitunix app, register, and use its charting tools to study Doji patterns across spot and futures pairs before risking capital.
FAQ
What exactly is a Doji candlestick?
A Doji candlestick forms when an asset opens and closes at nearly the same price. It has a tiny, almost invisible body, with wicks that show how far the price moved during the session, and it usually signals market indecision.
How do I identify a Doji pattern on a chart?
You identify a Doji by looking for a candle with a very small body and wicks above, below, or on both sides. The key feature is that the opening and closing prices are almost identical.
What does a Doji signal say about market sentiment?
A Doji signals that buyers and sellers fought for control, but neither side won by the close. It often shows market indecision, hesitation, or a possible pause before continuation or reversal.
What is the difference between a Dragonfly Doji and a Gravestone Doji?
A dragonfly Doji has a long lower wick and often appears near support after selling pressure. A gravestone Doji has a long upper wick and often appears near resistance after buying pressure fails.
Are Doji patterns reliable indicators of price reversals?
Doji patterns are not reliable reversal indicators on their own. They become more useful when they appear at key support or resistance levels and are confirmed by the next candle, volume, RSI, MACD, or trend structure.
How should I use Doji patterns in my trading strategy?
Use Doji patterns as context signals. Look for them near support, resistance, or after a strong trend, then wait for confirmation from the next candle, volume, RSI, MACD, or broader trend structure. A Doji shows indecision, so your stop should sit beyond the candle's extreme.
Can Doji patterns appear on all timeframes?
Doji patterns can appear on all timeframes, from one-minute to weekly. Longer timeframes usually carry more weight because they include more trading activity and reflect broader market participation.
What other indicators should I use with Doji patterns?
Moving averages, RSI, MACD, support and resistance, trendlines, and volume can all help confirm Doji signals. These tools help you decide whether the candle shows a real shift or just temporary noise.
How often do Doji patterns result in false signals?
Doji patterns can produce false signals often, especially in sideways or low-liquidity markets. Many Doji candles lead to small pauses rather than major reversals. Confirmation and risk management reduce the damage from false reads.
Where can I practice identifying Doji patterns?
You can practice on live or historical crypto charts by marking Doji candles, checking the trend, and comparing the next few candles. Bitunix provides charting tools that let traders study candlestick signals across supported spot and futures markets.
Glossary
- Doji: A candlestick where the opening and closing prices are almost the same.
- Candlestick: A chart element showing open, high, low, and close prices for a period.
- Candle Body: The area between the opening and closing prices.
- Wick: The thin line showing the highest or lowest price reached.
- Upper Wick: The line above the body showing the session high.
- Lower Wick: The line below the body showing the session low.
- Standard Doji: A balanced Doji with a small body and relatively even wicks.
- Long-Legged Doji: A Doji with long upper and lower wicks showing strong indecision.
- Dragonfly Doji: A Doji with a long lower wick and little upper wick.
- Gravestone Doji: A Doji with a long upper wick and little lower wick.
- Market Indecision: A condition where buyers and sellers lack clear control.
- Support: A price area where buyers often defend the market.
- Resistance: A price area where sellers often limit upward moves.
- Technical Analysis: A method that studies charts, indicators, and price behavior.
- Confirmation: Additional evidence that supports a possible trading signal.
Disclaimer
This article does not provide:
(i) investment advice or investment recommendations;
(ii) an offer or solicitation to buy, sell, or hold digital assets;
(iii) financial, accounting, legal, or tax advice.
Digital assets, including stablecoins and NFTs, involve high risk and may fluctuate significantly. Consider whether trading or holding digital assets is appropriate for you given your financial situation. Consult a qualified legal, tax, or investment professional when needed. You are responsible for understanding and complying with applicable local laws and regulations.
About Bitunix
Bitunix is a global cryptocurrency derivatives exchange trusted by over 3 million users across more than 100 countries. At Bitunix, we are committed to providing a transparent, compliant, and secure trading environment for every user. Our platform features a fast registration process and a user-friendly verification system supported by mandatory KYC to ensure safety and compliance. With global standards of protection through Proof of Reserves (POR) and the Bitunix Care Fund, we prioritize user trust and fund security. The K-Line Ultra chart system delivers a seamless trading experience for both beginners and advanced traders, while leverage of up to 200x and deep liquidity make Bitunix one of the most dynamic platforms in the market.
Bitunix Global Accounts
X | Telegram Announcements | Telegram Global | CoinMarketCap | Instagram | Facebook | LinkedIn | Reddit | Medium