Article Summary
- This article provides a practical guide to identifying and using support and resistance levels for trading Solana (SOL).
- It defines support as a price level where buying pressure tends to overcome selling pressure, causing the price to bounce up. It defines resistance as a price level where selling pressure tends to overcome buying pressure, causing the price to be rejected.
- The guide explains three primary methods for identifying these levels: Historical Price Action (previous peaks and troughs), Moving Averages (dynamic support/resistance), and Psychological Levels (round numbers).
- It provides actionable strategies for how to trade using these levels, such as buying near support and selling near resistance.
In the fast-paced world of crypto trading, price charts can look like chaos. But within that chaos are invisible battle lines where the war between buyers and sellers is won and lost. These are support and resistance levels, and understanding them is key to trading Solana successfully.
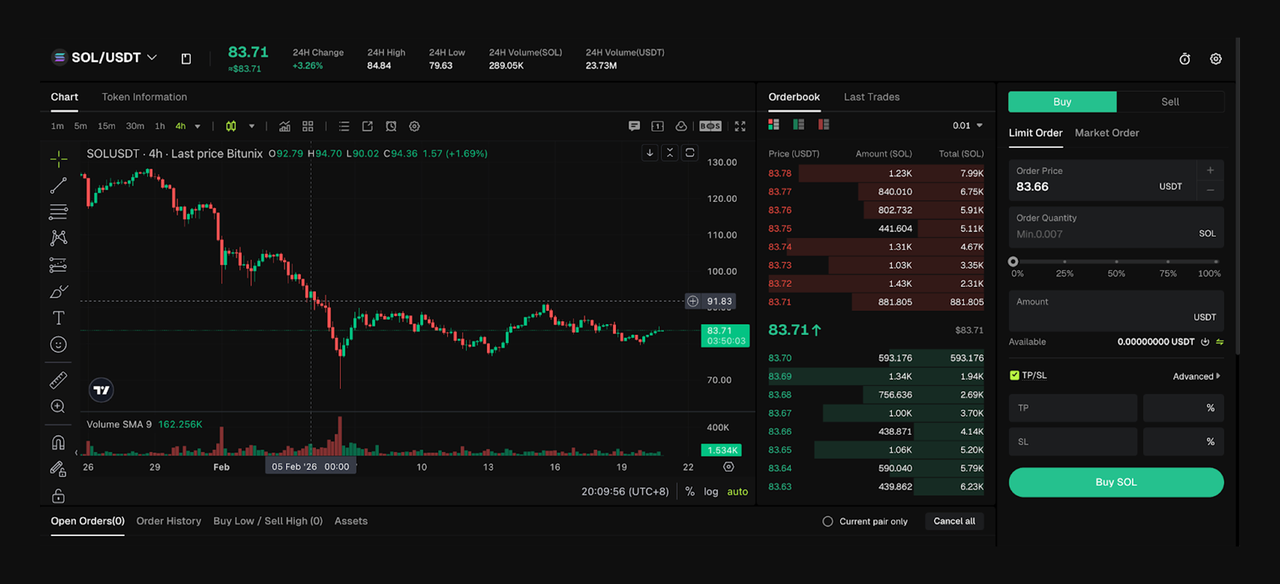
If you trade on a crypto exchange like Bitunix, you already have the core tools: a chart, time frames, and drawing tools. And whether you do spot trading or derivatives, using the pair SOL/USDT pair, for example, the logic stays the same. You want a plan that tells you where you enter, where you exit if you’re wrong, and where you take profit if you’re right.
Think of these levels as a map of market psychology. Traders remember where the price rejected, where it bounced, and where it trapped them. They place new orders around those same areas. Your job is to find the levels that other traders already care about, then use them to make calmer decisions.
This guide will teach you three simple yet powerful methods to identify key support and resistance levels for Solana, and show you how to use them to create a more strategic and less emotional trading plan on Bitunix.
What Are Support and Resistance?
Support is the floor. It’s the area where buying pressure often absorbs selling pressure and slows a drop. Resistance is the ceiling. It’s the area where selling pressure often absorbs buying pressure and slows a rise.
Here’s a short, reliable description from Investopedia:
"Resistance is the opposite of support. Prices move up because there is more demand than supply."
That’s the core idea: price moves until supply and demand shift enough to stop it.
Levels Behave Like Zones, Not Exact Prices
A common mistake is drawing one perfect line and treating it like a laser. Real markets don’t respect laser lines, meaning that support and resistance levels are sometimes zones rather than precise numbers.
So give your levels width. A zone makes your plan more realistic and reduces getting stopped out by a quick wick.
The Role Reversal You Need To Watch
Once price breaks a level and holds, the old role often flips. A prior support area can act as resistance when the price tries to rally back. A prior resistance area can act as support on a pullback.
This flip happens because traders adjust. People who missed the breakout often buy the retest. People who get trapped often use the retest to exit. The same area becomes important again, but for different reasons.
Three Methods to Identify SOL Support and Resistance
You can find levels with dozens of tools, but you don't need all of them. You need a repeatable routine you can use every day, especially when the market moves fast. Start with the three methods below. They cover the big buckets: what price did before, where trend tools sit now, and where humans place orders out of habit.
Method 1: Historical Price Action
The most reliable levels come from the chart itself. You’re looking for places where price paused, reversed, and then moved away with force. The simplest approach is to look back to find a significant pause in a decline or rise, then look forward to see if the price halts or reverses when it returns.
Here’s a routine that works well for SOL technical analysis:
- Start on a higher time frame (daily or 4H) so the big swings are obvious.
- Mark the clearest swing highs and swing lows where the price reversed sharply.
- Turn single lines into zones by covering the area where multiple candles reacted.
Why start higher? Longer time frames tend to create more significant levels. Note that support and resistance exist on all time frames, but longer periods carry more significance.
Two signals help you choose the stronger levels:
- More tests usually mean a stronger level; repeated touches increase a level’s significance.
- Heavy trading at that price often strengthens the level because traders remember it and reuse it.
Here is an example: imagine SOL sold off for several days, then bounced hard from a zone and later returned to it twice without breaking. That zone becomes a candidate support area because it already proved it can absorb selling pressure.
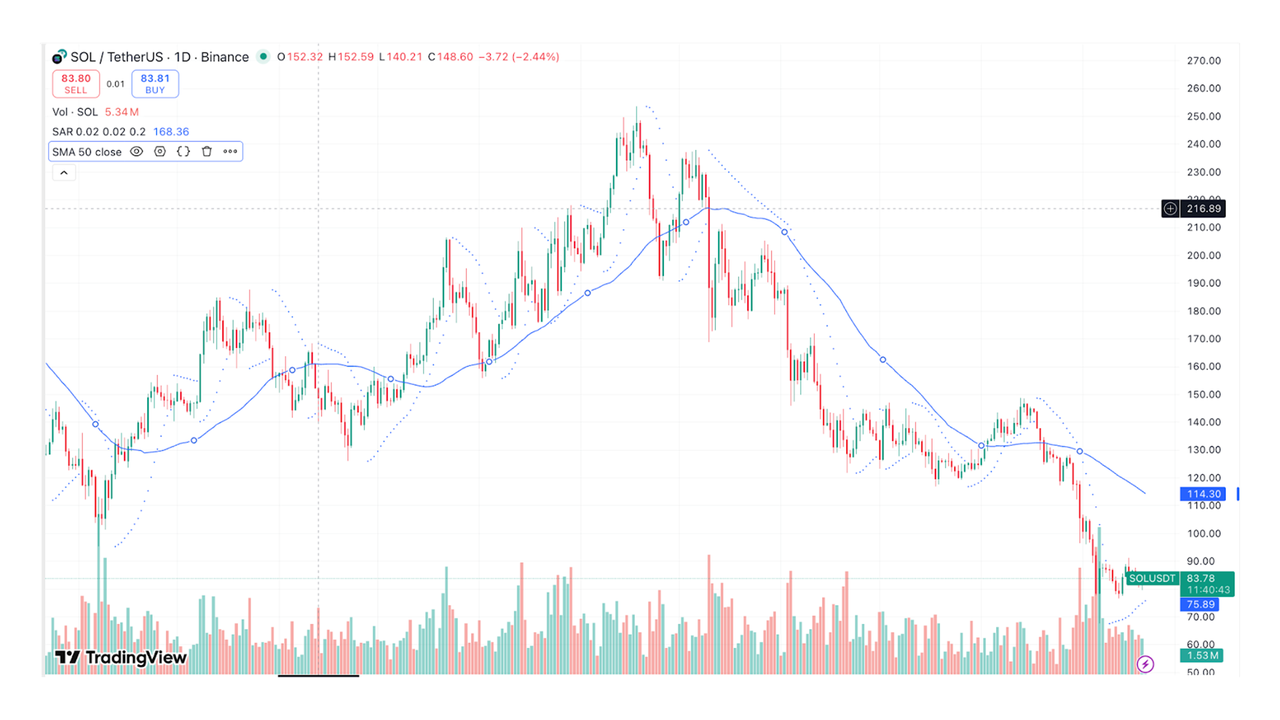
Method 2: Moving Averages As Dynamic Levels
Horizontal levels come from past turning points. Moving averages react to recent price data, so they shift over time. That makes them useful as dynamic support and resistance in trending markets. Moving averages often serve as support and resistance, where prices frequently reverse after pullbacks.
A practical way to use them for SOL price analysis:
- In an uptrend, the price often pulls back toward a rising moving average and then bounces.
- In a downtrend, price often rallies toward a falling moving average and then rejects.
Most traders watch the 50-day and 200-day moving averages on higher time frames. The exact settings matter less than consistency. If you change indicators every week, you never learn how your tools behave.
One helpful habit is only to treat a moving average as a real level when price has already reacted to it more than once. One touch can be a coincidence. Repeated reactions show that traders are actually watching it.
Method 3: Psychological Levels And Round Numbers
Humans love round numbers. So do order books. Price often has difficulty moving beyond a round number, partly because many target SOL prediction prices and stop orders cluster at those levels. For SOL, round numbers often stand out because traders talk in clean figures. If SOL trades near 100, 150, or 200, those numbers become easy reference points on social feeds, in chats, and in strategies. That attention turns into orders, and orders turn into reactions.
Round-number levels work best when they align with price action. If a round number also matches a prior swing high, it often becomes a more meaningful resistance zone. If it matches a prior swing low, it often becomes a more meaningful support zone.
How to Trade Using SOL Support and Resistance
Once you mark levels, you stop trading random candles and start making decisions. Each level gives you a place to act and a place to cut risk. When a zone is identified, it can serve as a potential entry or exit point, because pthe rice often either bounces away from the level or breaks through and continues toward the next level.
That idea leads to three common strategies:
Strategy 1: Range Trading
Range trading works when SOL moves sideways between a clear floor and a clear ceiling. You buy near the floor after it holds, and you sell near the ceiling after the price approaches it.
Say SOL has bounced from the 80 to 82 zone several times, and it has rejected near 90 to 92 several times. If the price returns to 81 and prints a strong bounce candle, you can plan an entry near the support zone, a stop below the zone (for example, below 79), and a target near the ceiling. That structure keeps the trade defined.
This is also where Solana support levels become practical. You treat them as planned entry zones and stop-loss reference points, instead of emotional comfort.
Strategy 2: Breakout Trading
A breakout happens when the price clears resistance and holds beyond it. The hard part is avoiding fakeouts, meaning that when the price opens beyond a support or resistance level, it then ends the day back inside the prior range. Waiting for confirmation helps separate a breakout from a fakeout.
Confirmation can be simple: wait for a candle close above resistance, not just a wick through it. Volume improves the read. A breakout on high volume suggests the price is likely to continue in the breakout direction because strong participation supports it.
A clean breakout plan looks like this: you mark the resistance zone, you wait for a close above it, you check that volume increased versus recent candles, and you decide whether to enter immediately or on a retest. The retest approach often gives better risk control because you can place your stop below the reclaimed zone.
Strategy 3: Breakdown Trading
A breakdown is the bearish version of a breakout. Price breaks below support and holds below it. For many traders, the best breakdown trade is simply exiting a long that no longer has a valid setup. You cut it, you move on, you keep your capital intact.
If you’re an advanced trader using derivatives, a breakdown can also set up a short. The risk rules stay the same: define the level, wait for a close below it, and place your stop above the broken support zone.
This is where role reversal matters in real time. After the break, the old support area often acts as resistance on a retest. If price returns to that area and rejects, you now treat Solana resistance levels as your reference for entries, stops, and profit targets, based on what price has already proved.
A Quick Note On Charting Pairs
Many traders prefer stablecoin pairs for clean levels. If you’re charting on Bitunix, you can use SOL/USDT to keep your levels consistent across time frames and easier to compare day to day.
Conclusion: Trading with a Map
Support and resistance levels give you a map. They don’t guarantee outcomes, but they reduce guesswork. You identify areas where traders already acted, then you plan around those areas with clear risk controls.
Use historical pivots for the backbone, moving averages for trend context, and round numbers for the psychological magnets. Keep your levels as zones. Wait for the candle to close when you need confirmation.
The advanced charting tools on Bitunix make it easy to draw your own support and resistance levels for Solana. Download the app, register, open the SOL/USDT chart, apply these techniques, and start trading with a clearer view of the market today.
FAQ
How do I draw support and resistance lines on a chart?
Start on the daily or 4H. Mark swing highs and swing lows where the price reversed sharply. Turn each line into a zone that covers repeated candle reactions.
Which time frame is best for finding support and resistance?
Use a top-down approach. Mark major zones on a daily or weekly basis, then refine on 4H or 1H for entries. Levels exist on all time frames, but longer time frames are more significant.
What is a stop-loss, and how does it relate to support levels?
A stop-loss exits your trade if the price proves your idea wrong. If you buy at support, place the stop below the support zone so a real breakdown closes the trade. This keeps one bad move from becoming a big loss.
What does trading volume have to do with breakouts?
Volume measures participation. Breakouts on high volume tend to follow through more often, while low-volume breakouts fail more often. Use volume to judge conviction, especially when price first pushes beyond a key level.
Are support and resistance levels always accurate?
No. They are probability tools; prices sometimes dip below support or reverse before reaching a prior level, which is why zones and flexibility matter.
What is a trendline, and how is it different from support and resistance?
A trendline slopes and connects rising lows or falling highs to show direction. Horizontal support and resistance stay flat at past reaction zones. Use trendlines for trend structure and horizontal zones for repeated turning points.
Can I automate a trading strategy based on these levels?
Yes, but it’s strict. You need rules for defining zones, what counts as a breakout close, and how to size positions. Automation works best when your inputs are objective, and your risk rules are consistent, otherwise the bot just repeats your mistakes faster.
How often should I update my support and resistance levels?
Update them when price breaks a level and holds, when a new major swing forms, or when volatility expands. For active trading, review levels at least weekly. For intraday trading, review daily before your session so your zones match the current structure.
What are Fibonacci retracement levels?
Fibonacci retracements mark potential pullback zones using common ratios like 38.2% and 61.8%. Traders use them to estimate where prices can pause during a correction, then compare those zones with prior pivots and round numbers for stronger confluence.
Where can I learn more about technical analysis?
Start with reputable education sources that explain the basics clearly. Bitunix’s guides on support, resistance, breakouts, and volume are a solid foundation. Use them to build consistent definitions before adding more indicators.
Glossary
- Support: A price zone where buying demand repeatedly absorbs selling pressure and slows declines.
- Resistance: A price zone where selling supply repeatedly absorbs buying pressure and slows rallies.
- Support zone: A wider area, not a single line, where the price often stops falling.
- Resistance zone: A wider area where the price often stops rising, and sellers appear.
- Role reversal: After a break and hold, old support becomes resistance, or old resistance becomes support.
- Swing high: A local peak formed before price reverses downward, often marking resistance.
- Swing low: A local bottom formed before price reverses upward, often marking support.
- Candle close: The final price of a candle, used to confirm breaks beyond key levels.
- Fakeout: A brief break beyond a level that reverses back into the prior range.
- Breakout: Price pushes above resistance and holds, often starting a continuation move.
- Breakdown: Price pushes below support and holds, often starting a continuation drop.
- Trading volume: The amount traded in a period, used to gauge participation and conviction.
- Moving average: A trend indicator that smooths price data and can act as dynamic support/resistance.
- Round number level: A psychological price barrier where orders cluster because the number is easy to target.
- Vol/Mkt Cap: A liquidity proxy comparing 24h volume to market cap; SOL shows about 6.56%.
About Bitunix
Bitunix is a global cryptocurrency derivatives exchange trusted by over 3 million users across more than 100 countries. The platform is committed to providing a transparent, compliant, and secure trading environment for every user. Bitunix offers a fast registration process and a user-friendly verification system supported by mandatory KYC to ensure safety and compliance. With global standards of protection through Proof of Reserves (POR) and the Bitunix Care Fund, Bitunix prioritizes user trust and fund security. The K-Line Ultra chart system delivers a seamless trading experience for both beginners and advanced traders, while leverage of up to 200x and deep liquidity make Bitunix one of the most dynamic platforms in the market.
Bitunix Global Accounts
X | Telegram Announcements | Telegram Global | CoinMarketCap | Instagram | Facebook | LinkedIn | Reddit | Medium
Disclaimer: Trading digital assets involves risk and may result in the loss of capital. Always do your own research. Terms, conditions, and regional restrictions may apply.