

Article Summary
- This article provides a comprehensive explanation of Engulfing candle patterns in the context of cryptocurrency trading.
- It breaks down the visual characteristics of both bullish and bearish Engulfing patterns and the market psychology behind their formation.
- The guide explores how Engulfing patterns signal potential reversals and what conditions make them most reliable.
- It highlights practical applications for traders, including how to use Engulfing patterns in conjunction with other technical tools.
- The article concludes with actionable advice for integrating Engulfing pattern recognition into a broader trading strategy.
- In technical analysis, few patterns are as visually clear and psychologically useful as the Engulfing candle. When a large candle completely covers the body of the previous candle, it signals a sharp shift in market sentiment. But what does this mean?
- An Engulfing candle is a two-candle pattern in which the second candle's body fully covers the first candle's body. The first candle shows hesitation or fading control, while the second candle shows that the opposite side has taken over. In crypto, this can help traders spot early signs of a momentum reversal.
- For traders using a crypto exchange such as Bitunix, Engulfing patterns are useful because they connect price action with trader behavior. They help you see when sellers lose control near support or when buyers lose control near resistance.
- This guide explains how the pattern works, how bullish and bearish versions differ, and how to use them inside a structured trading plan.
Understanding the Mechanics of Engulfing Candles
The easiest way to understand an Engulfing pattern is to look at the relationship between the two candle bodies. The first candle shows the market still moving in one direction, but when the second candle opens, it pushes against the previous move and closes with enough strength to fully cover the first candle's real body. Wicks can add useful context, but the body-to-body relationship defines the pattern.
In crypto, the pattern can look slightly different from textbook examples because markets trade 24/7 and do not always gap between sessions. Still, the message is that the second candle overpowers the first. A bullish version shows buyers stepping in after sellers had control, often near support or after a pullback. A bearish version shows sellers taking over after buyers had control, often near resistance or after a rally.
IG's 2026 candlestick guide explains the bullish version this way: "The bullish engulfing pattern is formed of two candlesticks. The first candle is a short red body that is completely engulfed by a larger green candle."
That quote gives traders the visual rule, but the trading value comes from the shift in control. When traders ask what is an engulfing candle, they are usually trying to understand how two candles can reveal a momentum change. The answer sits in the second candle's close. A strong close beyond the previous body indicates that buyers or sellers reversed the prior pressure, forcing the market to accept a new short-term direction.
TMGM's 2026 academy guide describes bullish and bearish engulfing patterns as reversal signals that reflect a sharp change in short-term market control. That change means more when it occurs at support or resistance, or after an extended move, rather than in the middle of random sideways price action.
The formation process is easy to follow because the pattern develops in two clear candles:
- The first candle shows that the current side is still active, but not strong enough to dominate the chart.
- The second candle moves against the first candle and closes beyond it, creating a larger body that fully covers the previous body.
- The larger second candle shows that the market rejected the prior direction, often after a liquidation move, failed breakout, or quick reaction to macro news.
- The recent market structure makes this kind of pattern worth reading carefully. CME's cryptocurrency futures and options suite reached an all-time daily volume record of 794,903 contracts on November 21, 2025, beating the previous record set in August 2025. Higher participation in higher derivatives can make candles around key levels more meaningful, as futures positioning, hedging, and liquidations can all affect spot price action.
Bullish vs. Bearish Engulfing Patterns
An Engulfing candle pattern can point in either direction. The bullish version warns that sellers are losing control, while the bearish version warns that buyers are. Both patterns need context, because a two-candle setup in the middle of some price action carries less weight than one at a major support or resistance level.
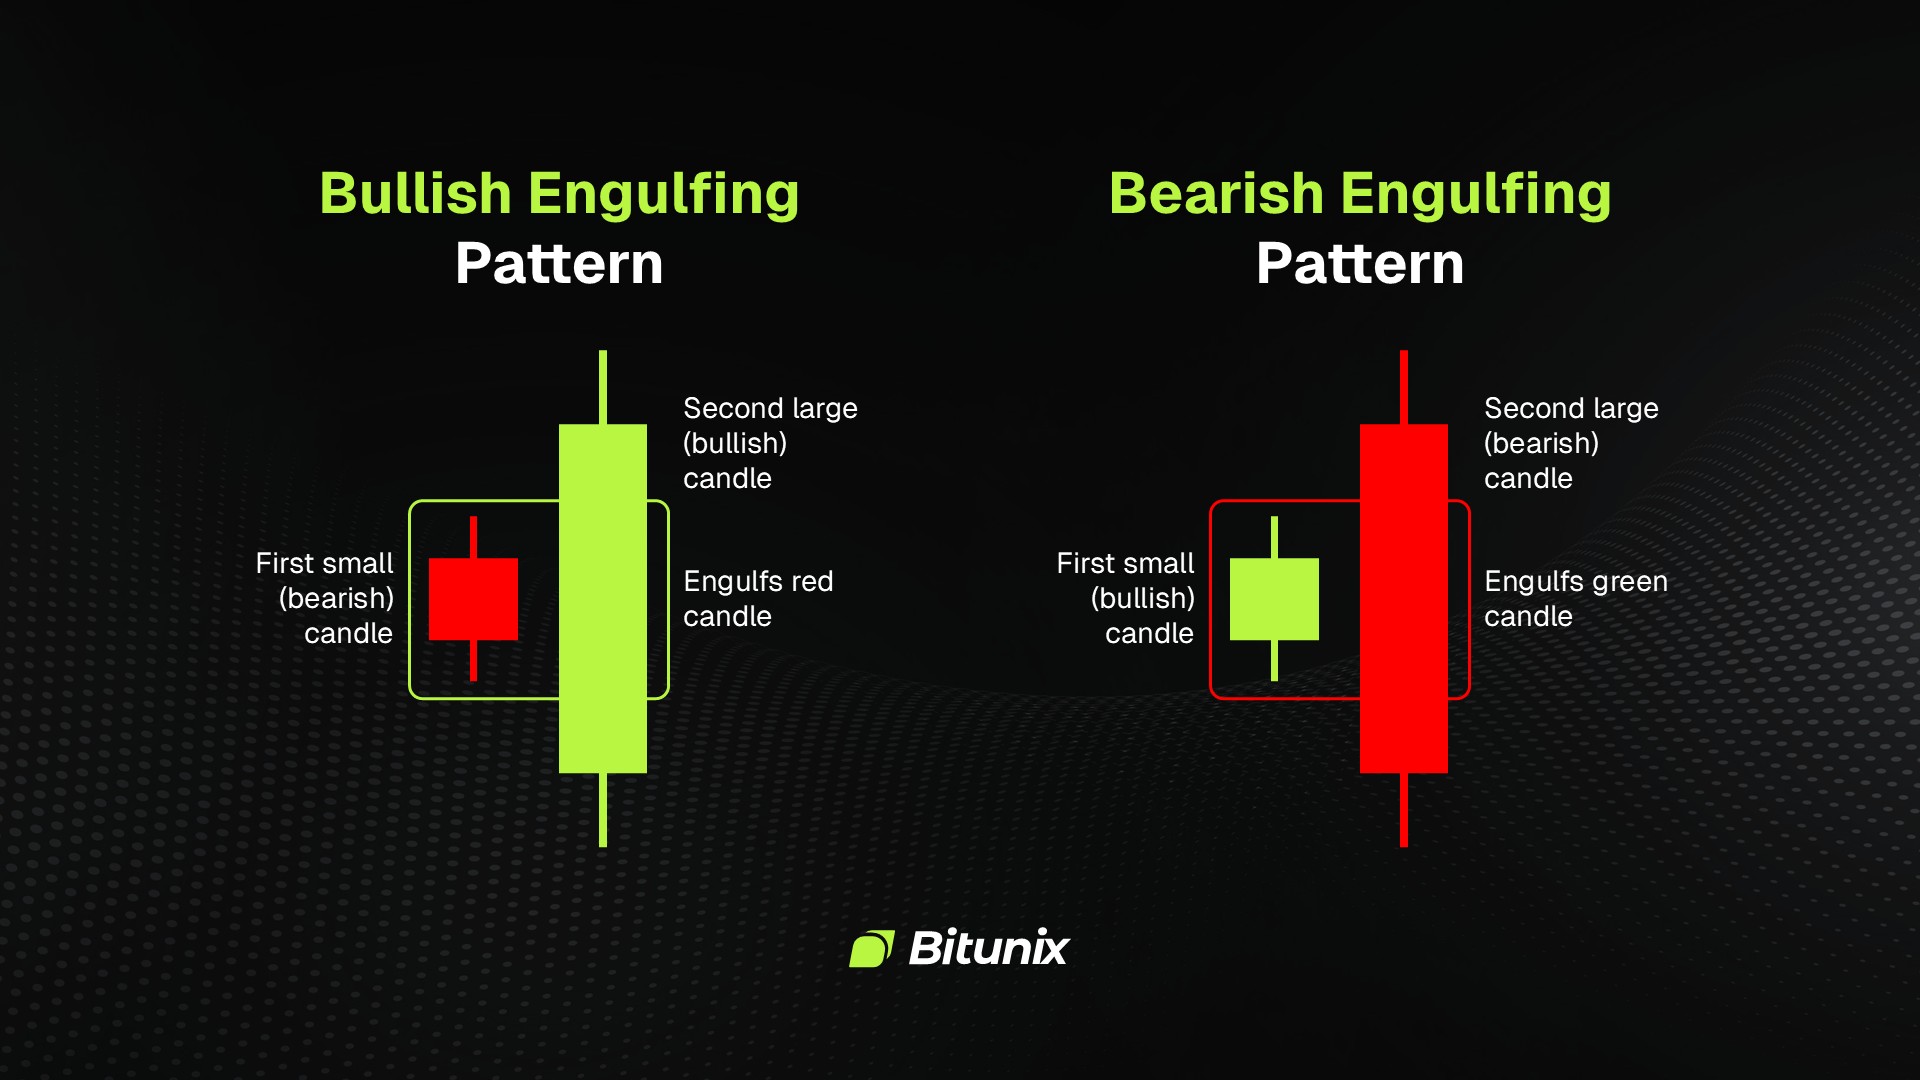
Bullish and bearish Engulfing patterns show how a larger second candle can overpower the previous candle and signal a possible momentum reversal.
1. Bullish Engulfing
A bullish engulfing pattern forms when a small red candle is followed by a larger green candle that fully covers the first candle's body. The first candle shows selling pressure, while the second candle shows that buyers stepped in with enough strength to reverse the prior session's move.
This pattern works best after a downtrend, a pullback, or a test of support. In that location, the larger green candle signals that sellers pushed lower but failed to keep control. Dukascopy's 2025 guide also notes that bullish engulfing patterns should appear during downtrends to carry their intended reversal meaning.
In crypto trading, a bullish engulfing pattern near a major support zone can help you spot a possible bounce. It becomes stronger when the second candle closes above a short-term resistance level, when volume rises, or when RSI shows oversold conditions.
2. Bearish Engulfing
A bearish engulfing pattern forms when a small green candle is followed by a larger red candle that fully covers the first candle's body. The first candle shows buyers still trying to push the price higher, while the second candle shows sellers taking control and reversing that move.
This pattern usually matters more after an uptrend, a bounce, or a test of resistance. IG's 2026 candlestick guide describes the bearish version as a pattern that occurs at the end of an uptrend, in which a long red candle engulfs a small green candle.
Crypto traders often watch this setup near previous highs, round-number levels, or Fibonacci retracement zones. A bearish engulfing candle near resistance tells you buyers failed at a level where sellers were already expected.
3. Strength Indicators
The size of the second candle shows the strength of the reversal attempt. A second candle that barely covers the first body is weaker than one that extends far beyond it. Stronger patterns usually show a clear body, higher volume, and little hesitation near the close.
The best answer to what is an engulfing candle should include this point: the pattern is about conviction. A large second candle shows that one side did not just nudge the market, and it took control of the period.
Volume helps confirm that control. A bullish engulfing candle with rising volume shows broader buying participation. A bearish engulfing candle with rising volume shows broader selling participation.
4. Location in Trend
The pattern's location should be your first filter, since context affects the signal's usefulness. A bullish Engulfing pattern near support after a sell-off carries more weight than one that appears randomly in a sideways market. In contrast, a bearish Engulfing pattern near resistance after a rally is more meaningful than one that forms in the middle of a choppy chart.
The broader market environment should shape how much trust you place in an Engulfing signal. CoinDesk Data’s February 2026 Exchange Review showed that derivatives volume on centralized exchanges reached $4.11 trillion, compared with $1.50 trillion in spot volume, meaning derivatives made up most exchange activity that month. That balance shows why crypto price moves often reflect leverage, hedging, and short-term positioning, so traders should read candlestick signals alongside volume, open interest, liquidity, and wider market structure.
Practical Trading Applications and Strategies
Engulfing candles help traders plan entries, exits, and risk, but they should not replace a strategy. The pattern works best when it supports a broader setup that already includes trend direction, key levels, confirmation, and position sizing.
1. Identifying Trend Reversals
A bullish Engulfing pattern can warn that sellers are losing control after a downtrend, while a bearish one can show that buyers are weakening after an uptrend.
To read either setup more safely, start with this trend structure:
- Lower highs and lower lows give a bullish reversal more context
- Higher highs and higher lows give a bearish reversal more context
- The signal becomes stronger when it forms near support or resistance, and the next candle confirms the move, such as holding above the midpoint or high in a bullish setup, or closing lower after a bearish one.
2. Entry and Exit Points
Traders often use the high or low of the engulfing candle as a trigger area. For a bullish setup, a common entry is above the high of the large green candle after confirmation, and for a bearish setup, a common entry is below the low of the large red candle.
Existing positions can also use Engulfing patterns as exit warnings. A trader holding a long position can reduce risk when a bearish engulfing pattern forms near a resistance level. A trader holding a short position can take profit or tighten the stop when a bullish engulfing pattern forms near support.
3. Combining with Other Indicators
Engulfing patterns work better when you pair them with tools that confirm trend, momentum, and key price levels. Moving averages help you define the broader trend, volume analysis shows participation behind the move, and Fibonacci levels can highlight zones where price often reacts after a rally or decline.
For example, a bullish Engulfing pattern near the 61.8% Fibonacci retracement and a rising 200-period moving average carries more weight than the same pattern in the middle of a random range. A bearish Engulfing pattern near a previous swing high, with RSI showing bearish divergence, gives you more evidence that buyers are losing strength.
Bitunix users can access TradingView-powered charting tools with indicators such as MACD, RSI, and Bollinger Bands. TradingView also added Bitunix exchange data in September 2025, giving traders real-time prices and volume for hundreds of spot and perpetual futures pairs directly on TradingView charts.
4. Risk Management
A clean Engulfing candle trade needs a clear invalidation point before you think about entry. For a bullish setup, many traders place the stop loss below the low of the engulfing candle, as a break below that level indicates that buyers failed to defend the reversal zone. For a bearish setup, the common stop sits above the candle high, where a breakout would weaken the short idea.
Risk planning should come before the trade itself. Decide how much of your account you can lose, then size the position based on the distance between your entry and stop. A common crypto risk-management rule is to risk only 1% to 2% of your account on a single trade, with a smaller size when leverage is involved.
Volatile candles also create execution risk, especially when the price moves quickly through an entry or stop level. Limit orders can help control price, but they do not remove slippage or missed-fill risk. With leverage, small mistakes can turn into large losses, so even a strong Engulfing setup still needs careful position sizing and a clear exit plan.
Limitations and Considerations
Engulfing patterns signal possible reversals, but they do not guarantee them. Price can still continue in the original direction after the pattern appears, especially during strong trends, liquidation cascades, or news-driven moves.
The timeframe you choose also changes how much weight the signal carries. Daily and weekly Engulfing patterns usually matter more than 1-minute or 5-minute candles because they capture broader market behavior. Shorter timeframes can help with entries, but they also produce more noise and more false signals.
False signals are common in crypto because prices can reverse on a single candle and then resume the prior trend. Coingecko's 2026 Q1 report showed that the top 10 spot centralized exchanges recorded $2.7 trillion in trading volume, down 39.1% from $4.5 trillion in 2025 Q4. Lower or shifting volume can make some candlestick signals less reliable, especially on smaller altcoins where liquidity is thinner.
The broader market context should guide how much trust you place in the signal. Check Bitcoin's trend, volatility, funding conditions, token-specific news, and whether the asset has enough trading depth. A bearish Engulfing pattern against a strong market needs extra confirmation, while a bullish Engulfing pattern during broad risk-off conditions also needs caution.
CCData's February 2026 exchange review reported that spot volumes fell 3.01% to $1.50 trillion, while derivatives volumes declined 2.41% to $4.11 trillion. These numbers show how quickly market participation can shift, which affects the reliability of candlestick reversal signals across different pairs and timeframes.
Conclusion: Mastering Engulfing Pattern Recognition
Engulfing candle patterns represent critical moments of momentum reversal, and recognizing them is a valuable skill for any trader. The pattern shows that one side lost control and the other side took over within two candles.
A strong Engulfing setup usually appears at support or resistance, follows a clear trend, shows a decisive second candle, and receives confirmation from volume or the next candle. When you combine the pattern with risk management and other technical tools, you can identify potential reversals with more structure instead of guessing every top or bottom.
Ready to improve your technical analysis skills? Create an account on Bitunix to access charting tools and practice identifying Engulfing patterns in real time. Keep your rules simple, manage your risk, and let the chart earn your attention before you place a trade.
FAQ Section
What exactly is an Engulfing candle pattern?
An Engulfing candle pattern is a two-candle reversal setup in which the second candle's body fully covers the first candle's body. It shows that one side of the market overpowered the other and created a potential shift in momentum.
How do I identify an Engulfing pattern on a chart?
You can identify an Engulfing pattern by looking for a small first candle followed by a larger second candle that fully covers the first candle's body. The setup becomes more useful when it appears after a clear trend and near support or resistance.
What is the difference between a bullish and bearish Engulfing pattern?
A bullish Engulfing pattern forms when a red candle is followed by a larger green candle, showing that buyers took control after selling pressure. A bearish Engulfing pattern forms when a green candle is followed by a larger red candle, showing that sellers took control after buying pressure.
Where do Engulfing patterns typically appear in a trend?
Engulfing patterns usually carry more meaning near the end of a trend, around support, resistance, or major reaction levels. Bullish versions often appear after declines, while bearish versions often appear after rallies.
How reliable are Engulfing patterns as reversal signals?
Engulfing patterns become more reliable when they appear at key levels, follow a clear trend, and receive confirmation from volume or the next candle. The pattern alone gives a warning, while confirmation helps decide whether the setup deserves a trade.
Should I trade every Engulfing pattern I see?
You should not trade every Engulfing pattern, as many occur in noisy markets or weak-trend conditions. Wait for context, confirmation, and a clear risk plan before using the pattern as a trade signal.
Does the size of the engulfing candle matter?
The size of the engulfing candle matters because a larger second candle shows stronger conviction from buyers or sellers. A candle that barely engulfs the first body is weaker than one that clearly extends beyond it with strong volume.
How should I set my stop loss when trading an Engulfing pattern?
A common stop-loss placement sits below the low of a bullish Engulfing pattern or above the high of a bearish Engulfing pattern. If the price crosses that level, the reversal idea loses strength.
What other indicators should I use with Engulfing patterns?
Engulfing patterns work better when combined with tools that confirm trends, momentum, and key levels. Moving averages, RSI, volume, MACD, Bollinger Bands, and Fibonacci retracements can help filter weaker signals.
Where can I practice identifying Engulfing patterns?
You can practice identifying Engulfing patterns on live or historical candlestick charts using platforms with multiple timeframes, indicators, and crypto trading pairs. Bitunix offers charting tools that help traders review market structure and test pattern recognition in real time.
Glossary
- Engulfing Candle: A two-candle pattern where the second candle's body fully covers the body of the first candle.
- Engulfing Candle Pattern: A reversal setup that shows a sharp shift in control between buyers and sellers.
- Bullish Engulfing: A pattern where a large green candle engulfs a smaller red candle after selling pressure.
- Bearish Engulfing: A pattern where a large red candle engulfs a smaller green candle after buying pressure.
- Candlestick: A chart unit showing the open, high, low, and close for a selected period.
- Real Body: The filled section of a candlestick between the open and closing price.
- Wick: The thin line above or below the candle body that shows the session high or low.
- Candlestick Reversal: A candle setup that signals a possible change in market direction.
- Technical Analysis: The study of price charts, volume, and indicators to evaluate market behavior.
- Support: A price area where buying pressure often slows or rejects further downside.
- Resistance: A price area where selling pressure often slows or rejects further upside.
- Volume: The amount of an asset traded during a specific period.
- RSI: A momentum indicator that helps traders identify overbought or oversold conditions.
- Fibonacci Retracement: A tool used to identify possible support and resistance levels after a price move.
- Stop Loss: A planned exit level used to limit losses when a trade moves against the setup.
Disclaimer
This article does not provide:
(i) investment advice or investment recommendations;
(ii) an offer or solicitation to buy, sell, or hold digital assets;
(iii) financial, accounting, legal, or tax advice.
Digital assets, including stablecoins and NFTs, involve high risk and may fluctuate significantly. Consider whether trading or holding digital assets is appropriate for you given your financial situation. Consult a qualified legal, tax, or investment professional when needed. You are responsible for understanding and complying with applicable local laws and regulations.
About Bitunix
Bitunix is a global cryptocurrency derivatives exchange trusted by over 3 million users across more than 100 countries. At Bitunix, we are committed to providing a transparent, compliant, and secure trading environment for every user. Our platform features a fast registration process and a user-friendly verification system supported by mandatory KYC to ensure safety and compliance. With global standards of protection through Proof of Reserves (POR) and the Bitunix Care Fund, we prioritize user trust and fund security. The K-Line Ultra chart system delivers a seamless trading experience for both beginners and advanced traders, while leverage of up to 200x and deep liquidity make Bitunix one of the most dynamic platforms in the market.
Bitunix Global Accounts
X | Telegram Announcements | Telegram Global | CoinMarketCap | Instagram | Facebook | LinkedIn | Reddit | Medium