1. Product Definition

1.1 What Is the Fibonacci Retracement Tool?
The Fibonacci retracement tool, also known as the Golden Ratio tool, is a widely used technical analysis tool for identifying potential price levels. By selecting the swing high and swing low of a complete directional price move, traders can generate key Fibonacci levels at 23.6%, 38.2%, 50%, 61.8%, and 78.6% to identify potential support and resistance zones during a market retracement.
Key Takeaway: Fibonacci retracement levels do not predict reversals. Instead, they mark areas where price may be more likely to react. During a retracement within an established trend, price may pause, stabilize, or face resistance around these Fibonacci levels before continuing in the direction of the broader trend. Therefore, Fibonacci levels should not be treated as guaranteed reversal points.
1.2 Core Value of the Fibonacci Confluence Strategy
Using Fibonacci retracement levels alone can generate a large number of false signals. Confluence means cross-checking multiple conditions before making a trading decision:
Price Zone Identification: Fibonacci retracement levels identify potential support and resistance zones, helping determine where to look for trading opportunities.
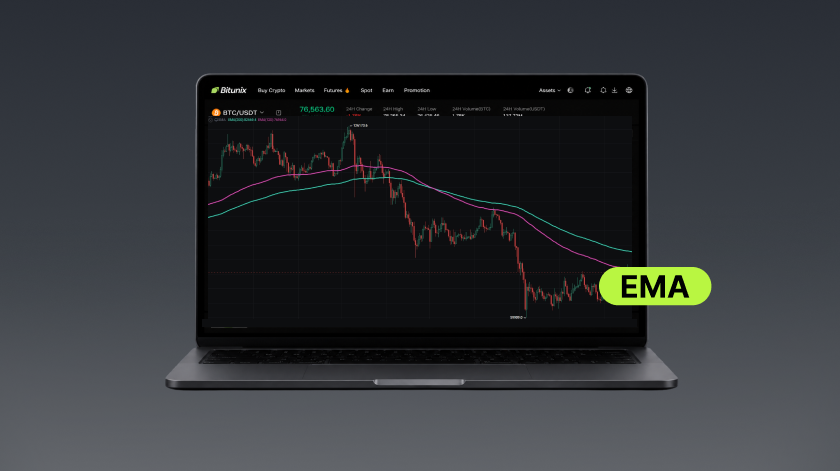
Trend Filtering: MA/EMA moving averages confirm the broader trend direction. Trading in the direction of the trend helps avoid counter-trend attempts to pick tops or bottoms.
Momentum Analysis: The KDJ indicator helps identify overbought and oversold conditions, golden and death crosses, and bullish or bearish divergences to identify potential short-term shifts in market momentum.
Candlestick Confirmation: Candlestick patterns, such as hammer and engulfing patterns, can help confirm the outcome of the buying and selling pressure around key Fibonacci levels.
Tool Enhancement: Use the Bitunix chart's drawing alerts to receive automatic notifications when the price reaches a target zone. This allows traders to wait for all confluence conditions to be met before executing a trade, helping filter out invalid signals.
Strategy Positioning: A swing-trading tool designed for trending markets and not suitable for directionless, range-bound conditions.
1.3 Key Fibonacci Levels
23.6%: A shallow retracement that typically appears in very strong trends.
38.2%: A moderate retracement and a common pullback level in a healthy trend.
50%: A key psychological level and an area where buying and selling pressure often intensifies.
61.8%: The Golden Ratio level and the most important reference level in this strategy, where price may be more likely to stabilize or reverse.
78.6%: A deep retracement. A break below this level may indicate that the original trend is losing strength or may no longer be intact.
2. How to Draw Fibonacci Retracement Lines

Log in to the Bitunix website.
Go to the Futures Trading page and select the target trading pair, such as BTCUSDT or ETHUSDT.
Open the KLine Ultra chart.
Switch the timeframe to the 4-hour or daily chart for clearer swing structures and more stable anchor points.
Click Drawing Tools on the left side of the chart and select Fib Retracement (Fibonacci Retracement) to start drawing.
Beginner Tip: If you are drawing Fibonacci retracement lines for the first time, check the Bitunix Drawing Alerts Setup Guide to learn how to select drawing tools, activate alert icons, and configure trigger conditions. After adjusting the appearance, you can save settings such as line color and width as a drawing template for one-click use later.
Bullish Scenario (trend-following long): For a retracement within an uptrend, start at the lowest point of the trend move, using the low of the lower wick as the anchor, and end at the highest point, using the high of the upper wick. Draw the line from low to high.
Bearish Scenario (trend-following short): For a rebound within a downtrend, start at the highest point of the trend move and end at the lowest point. Draw the line from high to low.
Key Point: Select the extreme high and low of a complete directional move rather than minor local fluctuations. Using small swing points can distort the resulting Fibonacci levels.
✅ Bullish Confluence Conditions
Price: Price retraces to the 38.2%, 50%, or 61.8% Fibonacci support zone.
MA/EMA: Price finds support from the moving average around the Fibonacci level, while higher-timeframe moving averages maintain an upward direction.
KDJ: The KDJ indicator falls toward the 20 oversold zone and forms a golden cross, or shows bullish divergence.
Candlestick Patterns: A bullish reversal candlestick, such as a hammer or bullish engulfing pattern, forms around the Fibonacci level.
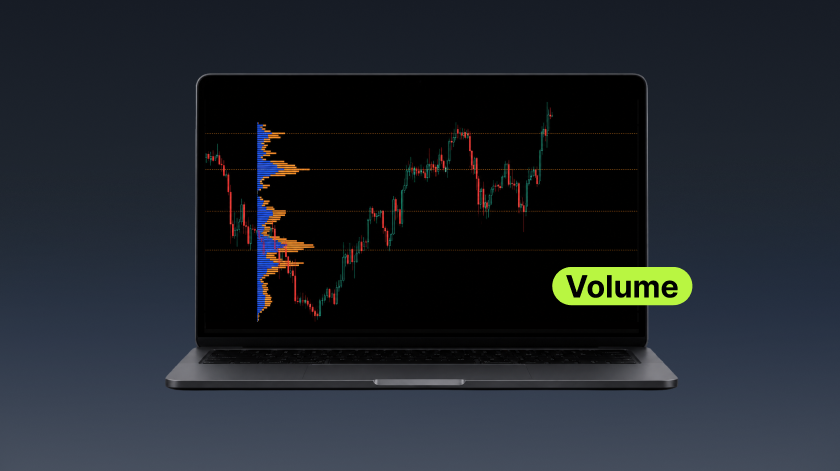
Trading Volume: Volume declines during the retracement, followed by increased volume as the stabilizing candlestick receives buying support.
✅ Bearish Confluence Conditions
Price: Price rebounds to the 38.2%, 50%, or 61.8% Fibonacci resistance zone.
MA/EMA: Price faces moving-average resistance around the Fibonacci level, while higher-timeframe moving averages maintain a downward direction.
KDJ: The KDJ indicator rises above the 80 overbought zone and forms a death cross, or shows bearish divergence.
Candlestick Patterns: A bearish reversal candlestick, such as a shooting star or bearish engulfing pattern, forms around the Fibonacci level.
Trading Volume: Volume declines during the rebound, followed by increased selling volume as the bearish candlestick forms.
3. Practical Example
Example 1: BTCUSDT Daily Chart | Fibonacci Retracement | Futures Confluence Trading Strategy


Disclaimer: This content is for technical education and demonstration purposes only and does not constitute investment advice. Futures trading involves a high level of risk. Please manage your position size carefully.
Analysis:
Fibonacci Retracement
The retracement is drawn from the high of 126,208.5 to the low of 57,758. The current price has moved below the 38.2% retracement level at 83,906.5. A breakout above this level with increased volume could open the way toward the 50% retracement level at 91,983.5.
Support, Resistance, and Candlestick Structure
After a major decline, the market formed a W-bottom (double-bottom) structure with two rejection wicks at the lows. Price has now entered a key support-resistance flip zone, where previous support has turned into current resistance.
Indicator Confluence
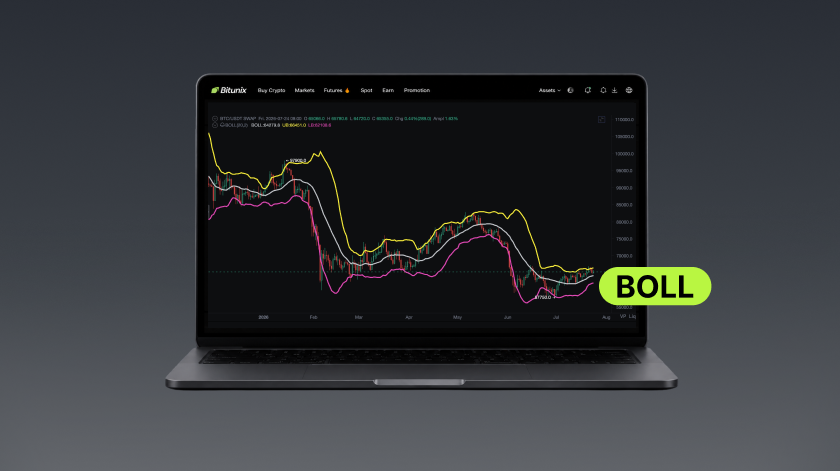
On the daily chart, both MACD and KDJ have formed golden crosses, while the Bollinger Bands are expanding upward. Multiple indicators are showing bullish signals simultaneously, with further upside momentum dependent on confirmation from trading volume.
Trading Strategy
✅ Breakout Long: Wait for a high-volume daily candle to confirm a breakout above 83,906.5 (38.2% Fibonacci retracement) before entering a long position.
Take Profit (TP): 91,983.5 (50% Fibonacci retracement level)
Stop Loss (SL): 74,900 (below the bottom of the W-pattern's right shoulder; a break below this level would invalidate the W-pattern structure)
⚠️ Risk Warning
If the price fails to break above 83,906.5 with strong volume, the market is likely to remain range-bound. If the price falls below the 57,758 base area, the long setup described above would be invalidated.
Educational Note: This example is provided solely to demonstrate the logic behind the trading signals and does not imply that the market will necessarily follow the same pattern.
Example 2: AKE/USDT — 4-Hour Timeframe | Fibonacci Retracement Levels | Futures Confluence Trading Strategy


Disclaimer: This content is for technical education and demonstration purposes only and does not constitute investment advice. Futures trading involves a high level of risk. Please manage your position size carefully.
Analysis:
1. Fibonacci Retracement
The Fibonacci retracement levels are drawn from the low of 0.013069 to the high of 0.164696. The 50% retracement level is 0.090758, which also coincides with the resistance area around the previous swing high. A high-volume breakout above this level could indicate that the bullish move has room to continue.
2. Moving Average Support
Pay close attention to the EMA120 as a key support level for the medium- to long-term trend. If the price retests and holds above the EMA120, it suggests that the medium-term bullish structure remains intact.
3. Indicator Confluence
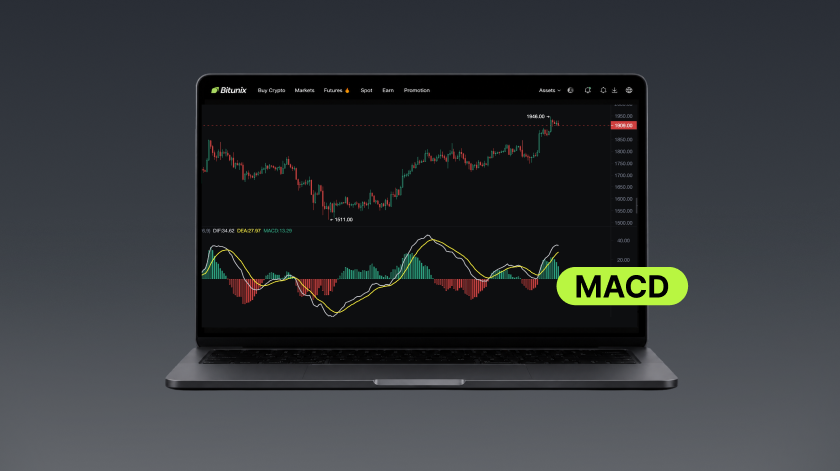
Wait for the MACD to form a bullish crossover below the zero line, accompanied by a high-volume upward move in the candlestick chart. A combination of EMA support, a bullish MACD crossover below the zero line, and a breakout above the 50% Fibonacci resistance would form a confluence of signals, indicating stronger upward momentum.
Trading Strategy
✅ Follow-the-Breakout Long: Enter a long position when the MACD forms a bullish crossover below the zero line and the candlestick chart breaks above 0.090758 (50% Fibonacci retracement level and previous swing-high area) with strong volume.
Take Profit (TP): The initial target is the 61.8% Fibonacci retracement level at 0.108207. If the price continues to show strong momentum, higher levels may be considered.
Stop Loss (SL): Place the stop loss near the area below the low where the breakout candle started. A range of 2%–5% below the low can be used as a reference. If the price breaks below this level decisively, the breakout may be considered a false breakout, invalidating the bullish setup.
🔻 Counter-Trend Short: If the price tests 0.090758 but fails to break above it with strong volume and repeatedly retreats from this resistance level, a short position may be considered around the resistance.
Take Profit (TP): The initial target is the previous support zone.
Stop Loss (SL): Place the stop loss above the previous swing high at 0.090758. If the price breaks decisively above this level, the short setup would be invalidated.
⚠️ Risk Warning
The market has just experienced a sharp decline and remains in a strong downtrend. If the price fails to hold above the EMA120, it may continue moving lower in search of support at lower levels. Avoid entering long positions prematurely.
Educational Note: This example is provided solely to demonstrate the logic behind the trading signals and does not imply that the market will necessarily follow the same pattern.
4. Risk Management and Key Considerations
The Strategy May Not Work Well in Range-Bound Markets The Fibonacci confluence strategy works best when a clear trend is present. In range-bound markets, the price may repeatedly break through different Fibonacci levels, resulting in frequent false signals. Avoid using this strategy in choppy market conditions whenever possible.
Fibonacci Levels Do Not Guarantee Reversals Fibonacci levels represent areas where price may react with a higher probability, but they do not guarantee a reversal. Even when all confluence conditions are met, the price may break directly through a Fibonacci level and continue in the prevailing direction. Do not attempt to predict tops or bottoms or place orders prematurely. Wait for candlestick confirmation before entering a trade.
Strong One-Way Moves Can Break Deep Through Fibonacci Levels During sharp, one-directional rallies or sell-offs, the price may move directly through the 61.8% or even 78.6% Fibonacci levels. Avoid trying to catch tops or bottoms against the prevailing trend. In strong directional markets, prioritize trading in the direction of the trend and reduce counter-trend opportunities.
Fibonacci Drawing Involves Subjective Judgment Different traders may select different highs and lows, resulting in variations in Fibonacci levels. Use the extreme points of candlestick wicks consistently rather than the candle bodies. Keeping the point-selection rules fixed helps maintain consistency when applying the strategy.
Higher Timeframes Take Priority Over Lower Timeframes Confluence signals on the daily and 4-hour timeframes generally provide a clearer market structure than those on the 15-minute or 5-minute timeframes. Lower timeframes contain more market noise and may generate more false signals. High-frequency trading based on the 5-minute timeframe is therefore not recommended.
Avoid Arbitrary Changes to Indicator Parameters For KDJ, the classic (9,3,3) parameters are recommended. Avoid modifying parameters arbitrarily or overfitting indicators, as this may reduce their effectiveness in live trading. For MA/EMA indicators, use commonly adopted market periods rather than unusual custom settings.
Apply Strict Position Management When Using Leverage Futures leverage amplifies both potential gains and losses. Avoid allocating an excessive portion of your capital to a single trade and follow stop-loss rules strictly. Do not increase leverage simply because multiple indicators appear to form a confluence signal.
A Confluence Signal Requires Multiple Conditions A single condition does not constitute a valid confluence signal. For example, if the price only reaches the 61.8% Fibonacci level without confirmation from moving averages, KDJ, or candlestick patterns, it should not be considered a valid confluence setup. Do not enter a trade based on a single condition alone.
Practical Tip: Practice drawing Fibonacci levels and identifying signals on the Bitunix Demo Trading platform before trading with real funds. Test the strategy thoroughly before applying it in live trading.