
Reporting Period: October 2–15, 2026
Data as of: October 15, 2026
Market Overview: Hotter-Than-Expected US Inflation Raises Rate Hike Bets, Putting Global Risk Assets Under Pressure
Global financial markets came under renewed pressure over the past two weeks as inflation concerns intensified. Data released by the US Bureau of Labor Statistics on October 14 showed that the Consumer Price Index (CPI) rose 3.7% year over year in September, marking its largest increase in five months. The reading exceeded market expectations of 3.6% and accelerated from 3.4% in the previous period. On a monthly basis, headline CPI rose 0.6%, in line with expectations but above the previous reading of 0.4%. Core CPI increased 0.3% month over month, exceeding the forecast of 0.2% and matching the previous reading. The hotter-than-expected inflation data heightened concerns about the Federal Reserve's monetary policy outlook.
Financial markets reacted swiftly to the release. The US Dollar Index rose approximately 30 points in a short-term move, while the yield on the 10-year US Treasury climbed. Futures tied to all three major US stock indexes turned lower, and spot gold also fell sharply in the immediate aftermath. Interest rate expectations shifted significantly, with traders increasing their bets on a Fed rate hike in October. Market-implied odds of a hike rose to 50%, while markets priced in a cumulative three additional rate hikes through the end of 2027. Against this backdrop, risk assets broadly weakened. BTC fell below $82,000, while ETH dropped under $2,400, leaving the crypto market vulnerable to further near-term corrections.
The Bitunix Blue-Chip Asset Biweekly Report tracks major crypto assets, including BTC, ETH, and TRX, examining price performance, on-chain data, and capital flows to provide a more comprehensive view of market conditions and emerging trends.
Bitcoin Price Performance: Bitcoin Briefly Falls Below $81,000, With $80,000 Emerging as Key Support
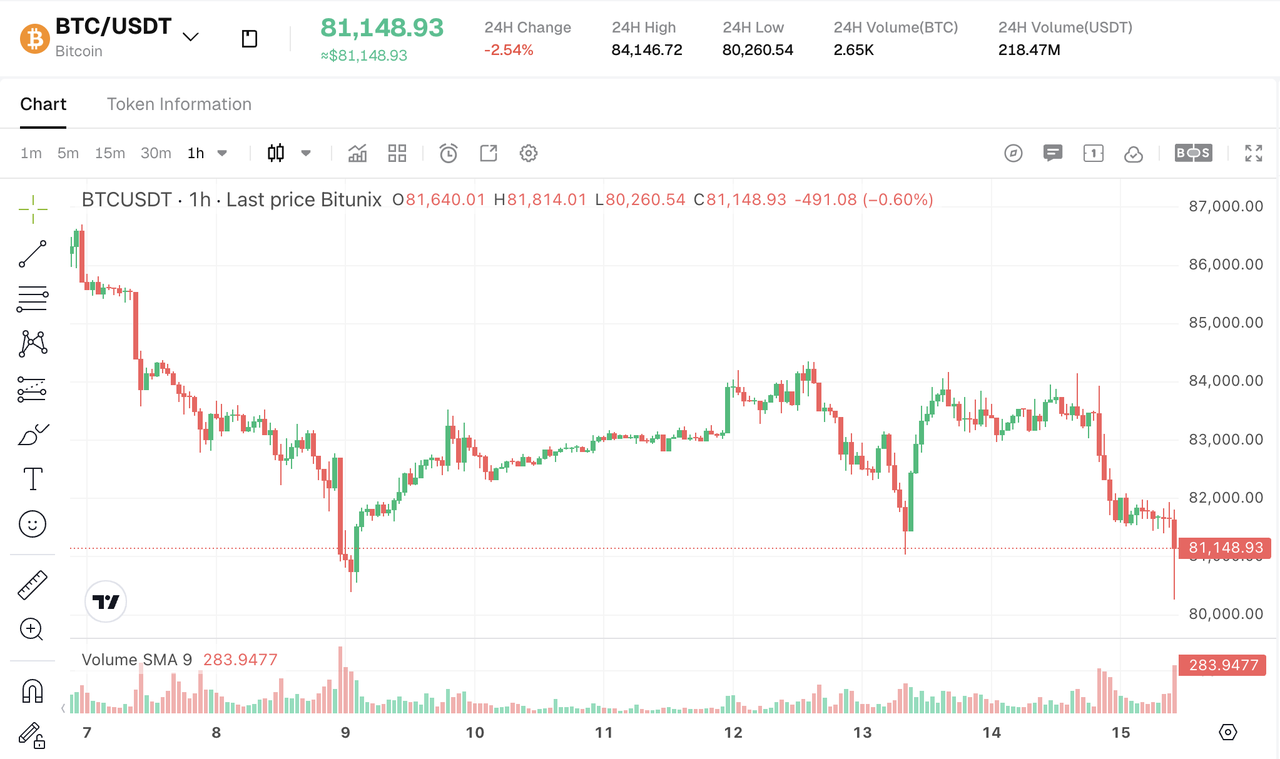
Bitcoin briefly fell below $81,000 on October 15 as core CPI came in above expectations and rate hike concerns intensified. Over the past two weeks, BTC retreated from a high of $87,000 and traded largely within the $81,000–$84,000 range. The latest break below $81,000 signals increased near-term downside pressure. Traders will be watching the $80,000 psychological support level closely to see whether BTC can stabilize around this threshold.
Data Source: Bitunix
Bitcoin Spot ETF Flows: Bitcoin ETFs See $260 Million in Net Outflows on CPI Release Day
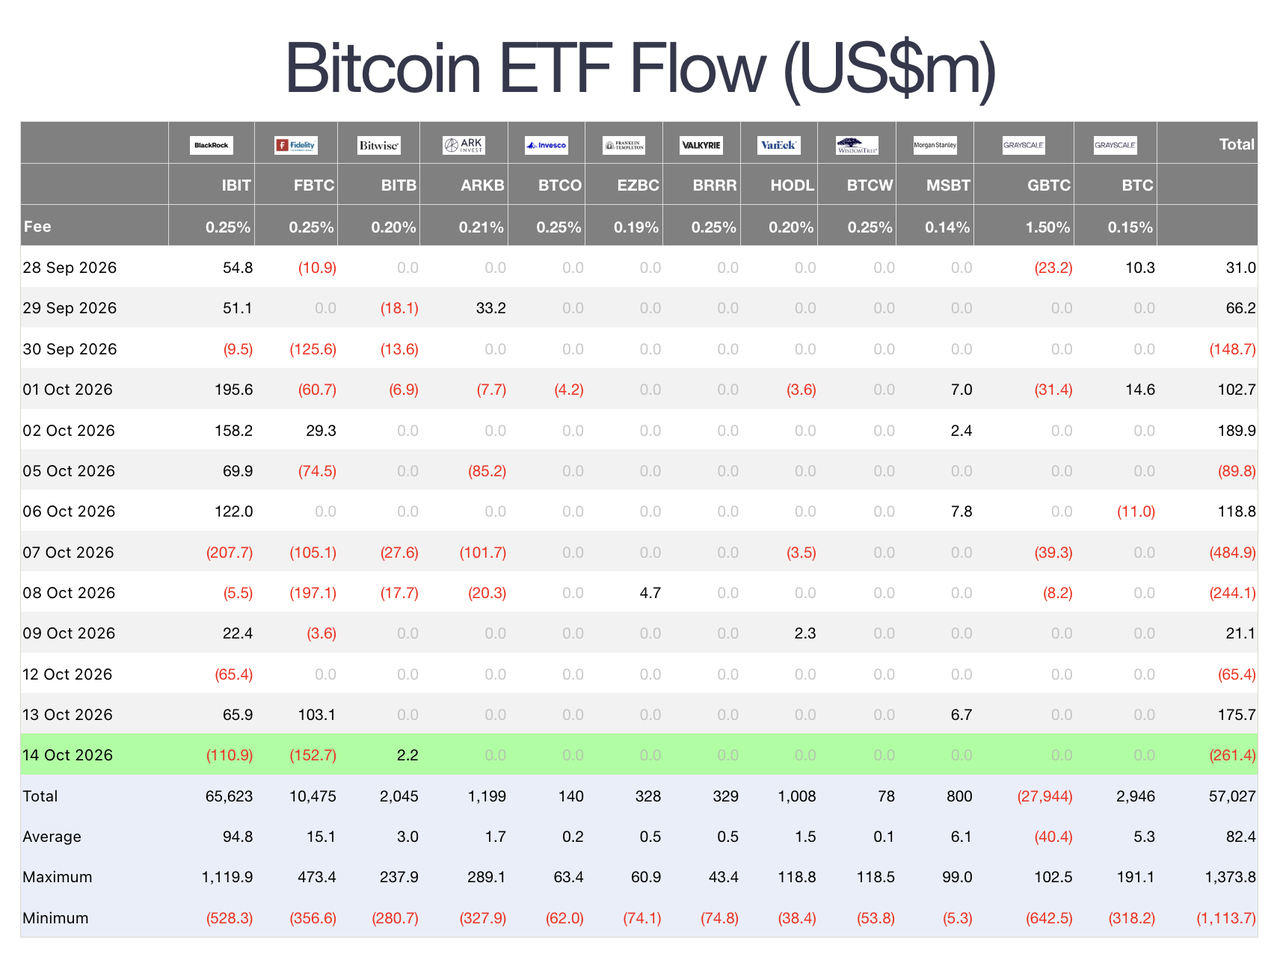
Spot Bitcoin ETFs have recorded persistent net outflows since the beginning of October. On October 6 and 7, the funds posted net outflows for two consecutive trading sessions, totaling approximately $700 million. On October 14, following the release of US CPI data, concerns over persistent inflation and the risk of further rate hikes intensified fears of tighter monetary policy. Spot Bitcoin ETFs recorded approximately $260 million in net outflows that day. This marks a notable shift from September, when institutional capital continued to flow into Bitcoin ETFs. The change in flows suggests that sentiment among traditional financial market participants has become more divided. Weakening institutional demand, combined with sustained net outflows, has added further pressure to BTC prices in the short term.
Data Source: Farside Investor
Bitcoin Treasury Holdings: Strategy Repurchases 3.7 Million STRC Shares and Adds 584 Bitcoin
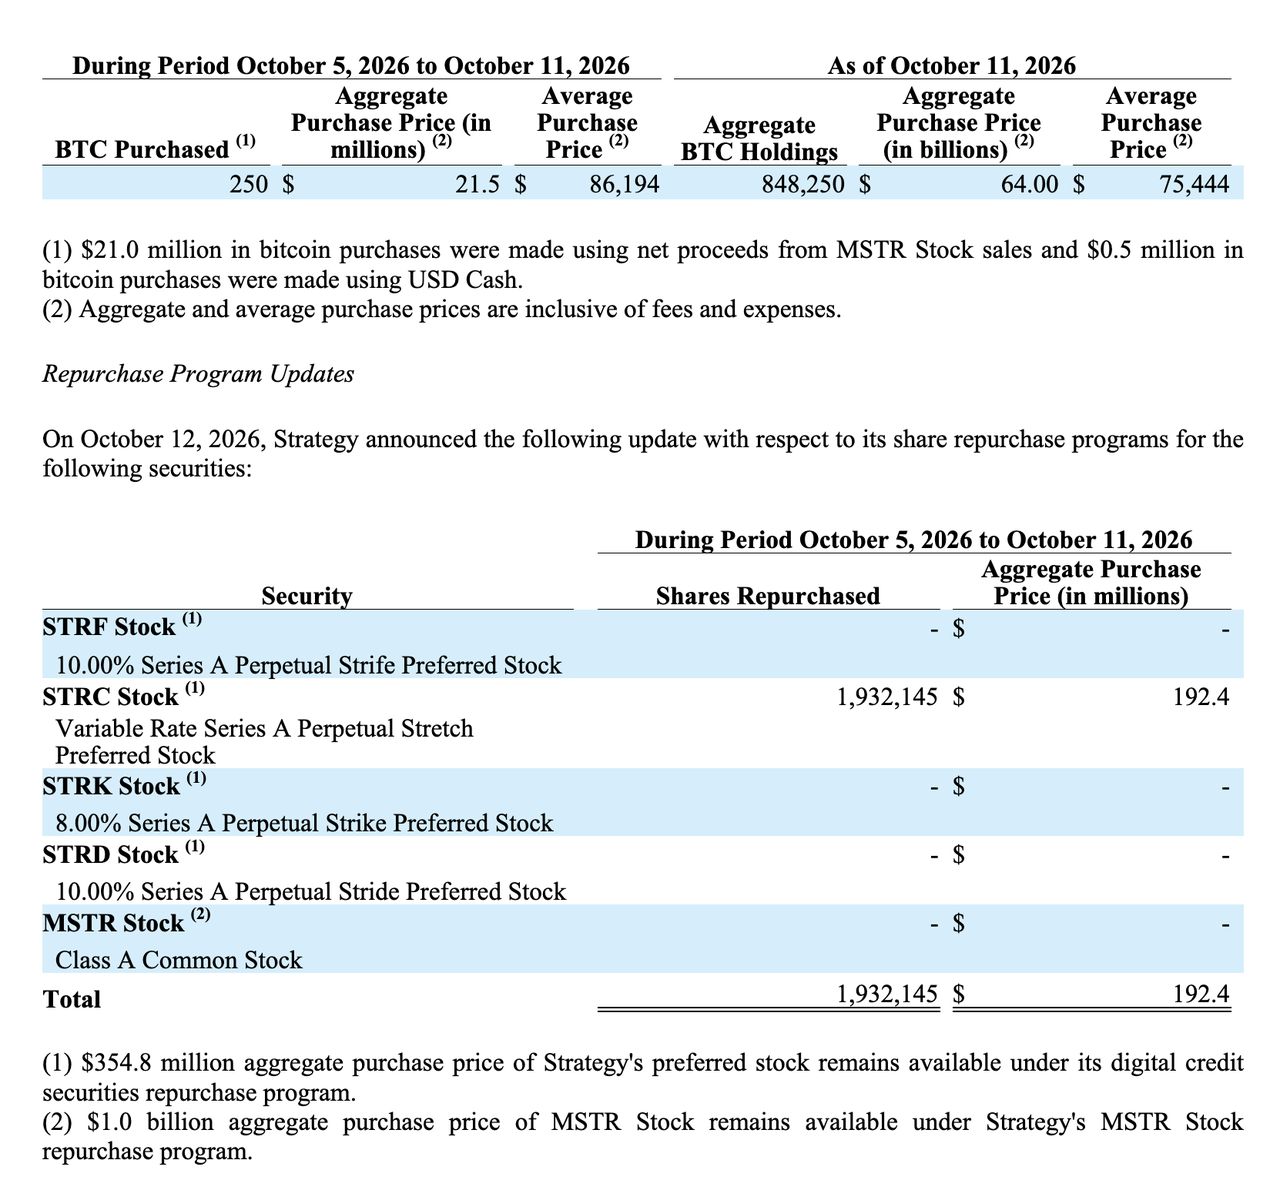
On October 13, Strategy released its latest weekly Form 8-K filing. According to the filing, between September 28 and October 11, the company repurchased 3,705,947 shares of STRC while adding 584 BTC to its Bitcoin holdings. The BTC purchases totaled approximately $50.2 million, while STRC repurchases amounted to around $368 million. This indicates that Strategy allocated a substantial portion of its capital to repurchasing preferred stock rather than directly increasing its BTC holdings during the period.
On September 30, Strategy disclosed that STRC's annual dividend rate remained at 12%. Management intended to recommend maintaining this rate until STRC could trade consistently and sustainably near its $100 target price. The company also stated that the repurchases were expected to reduce annual dividend expenses by approximately $44.5 million. Overall, Strategy's recent capital allocation decisions suggest that, alongside accumulating BTC, the company is placing greater emphasis on STRC's market performance and the management of its dividend costs.
Data Source: Strategy
Bitcoin On-Chain Spot Market: Average Holding Cost Rises to $70,000 as Unrealized Gains Narrow to 15%
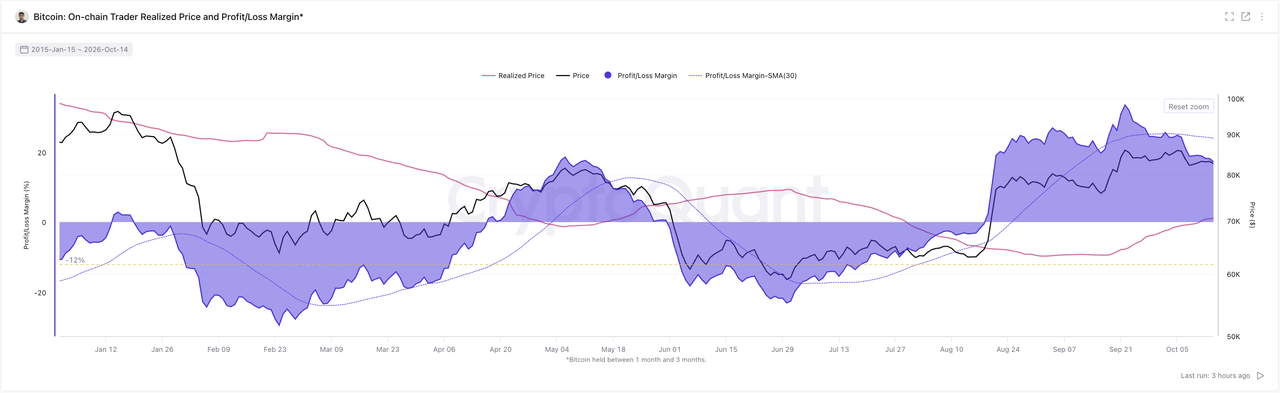
Over the past two weeks, the average on-chain cost basis for BTC holders has risen as Bitcoin spent time trading above $80,000. The average acquisition cost across on-chain BTC holdings has increased from approximately $67,000 to $70,000, while the average unrealized profit among BTC holders has narrowed to around 15%. Earlier in the current market cycle, the on-chain cost-basis curve and BTC's spot price curve converged near $64,000 during Bitcoin's rally on August 19. As prices continued to climb, the average unrealized profit on on-chain holdings subsequently peaked at around 33%.
More recently, however, BTC has pulled back amid hotter-than-expected US CPI data and rising rate hike expectations, bringing average unrealized profits down to approximately 15%. The narrowing profit cushion means holders have less room to absorb further price declines. If BTC continues to fall, some investors may face greater incentives to take profits or reduce their positions.
Data Source: CryptoQuant
Bitcoin On-Chain Derivatives: Long Positions Increase, With Notional Long Exposure Nearly Double Short Exposure
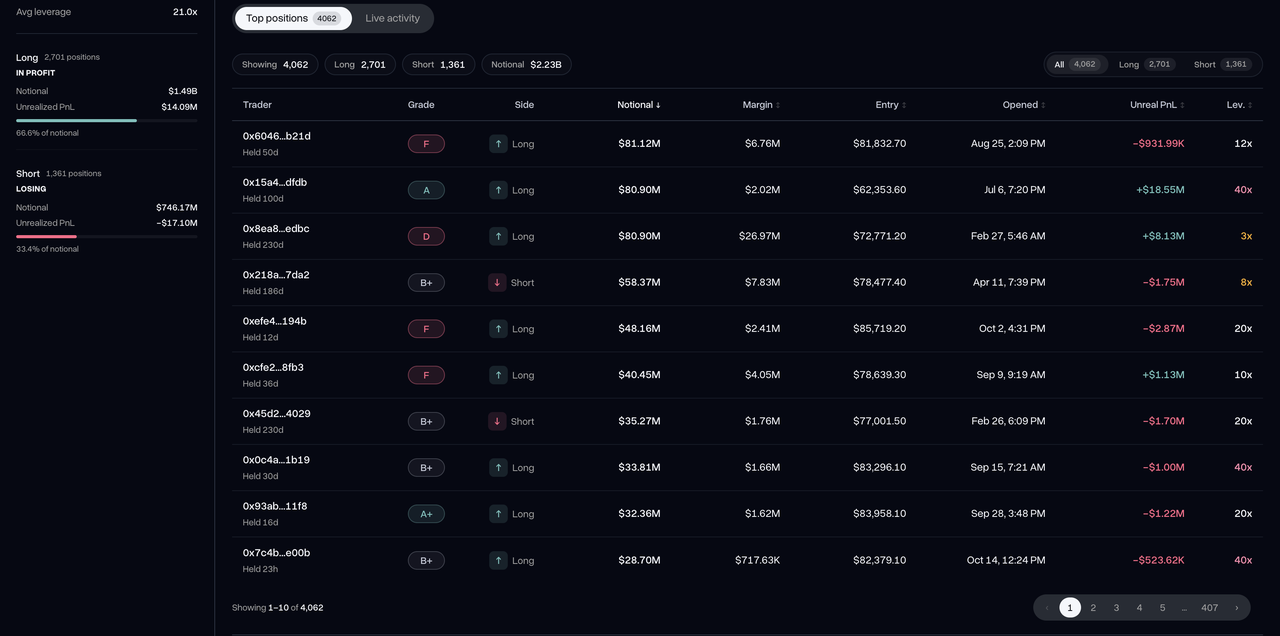
Hyperliquid is one of the largest decentralized derivatives trading platforms, and its on-chain derivatives data provides insight into leveraged market sentiment and the balance between long and short positions. As of September 3, BTC long positions on Hyperliquid had a notional value of approximately $1.49 billion, compared with $746 million in short positions. The long-to-short ratio stood at roughly 66:33, with bullish positioning reaching a recent high.
Among large traders, the on-chain wallet address "0x15a" established a BTC long position relatively early, at an entry price of approximately $62,353. Despite Bitcoin's recent pullback from its highs, the address continues to hold unrealized profits of more than $18 million. This suggests that some large traders who entered long positions earlier in the cycle still have substantial profit cushions. However, the performance of a single wallet cannot represent the direction of the broader market. Changes in platform-wide long and short positioning, together with the trading activity of other large holders, will be important in determining whether leveraged market sentiment is beginning to shift.
Data Source: Hyperstats
ETH Price Performance: Ether Falls Below $2,400, Underperforming Bitcoin
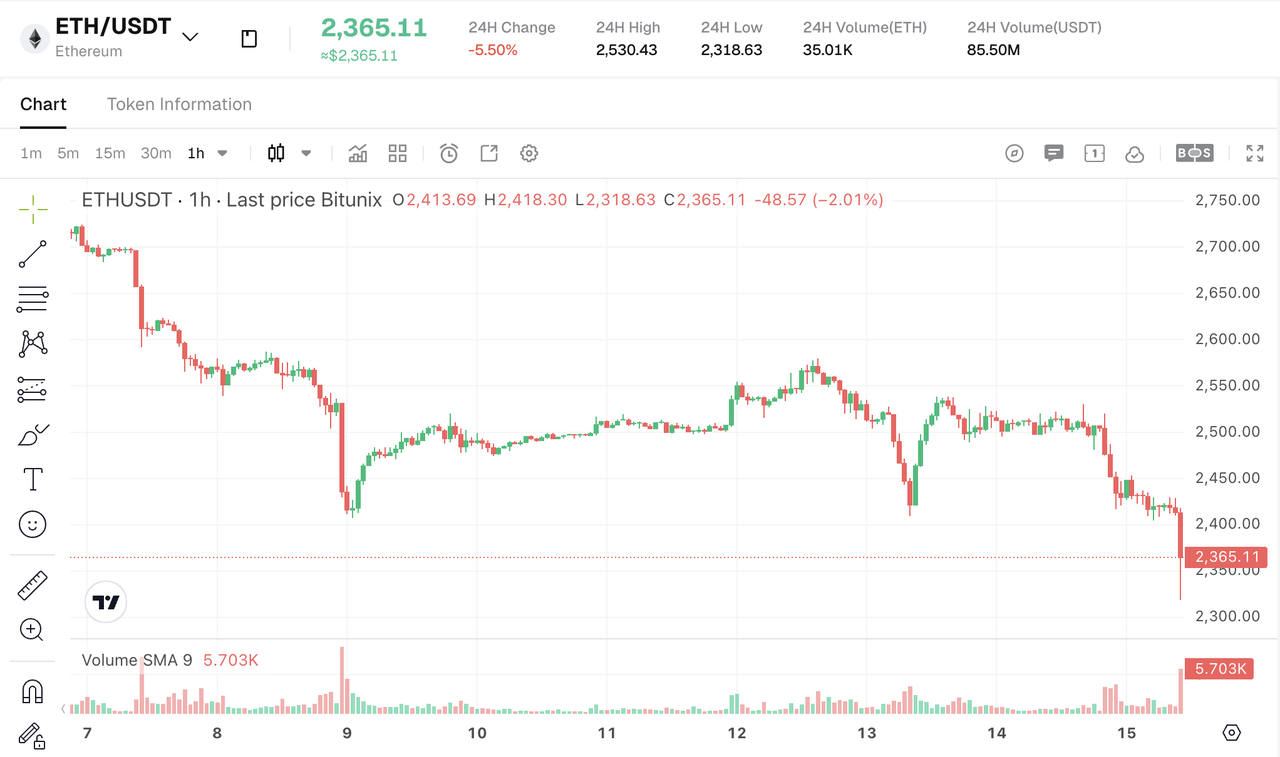
ETH experienced a significant decline this week following the release of hotter-than-expected US CPI data. Its price fell from approximately $2,700 to $2,300, representing a 7-day loss of 8.60% and underperforming BTC over the same period. Rising inflationary pressure and increased expectations of further Fed rate hikes have weighed on risk appetite, intensifying near-term downside pressure on ETH.
Data Source: Bitunix
ETH Spot ETF Flows: Ten Consecutive Trading Days of Net Outflows as Institutional Capital Continues to Exit
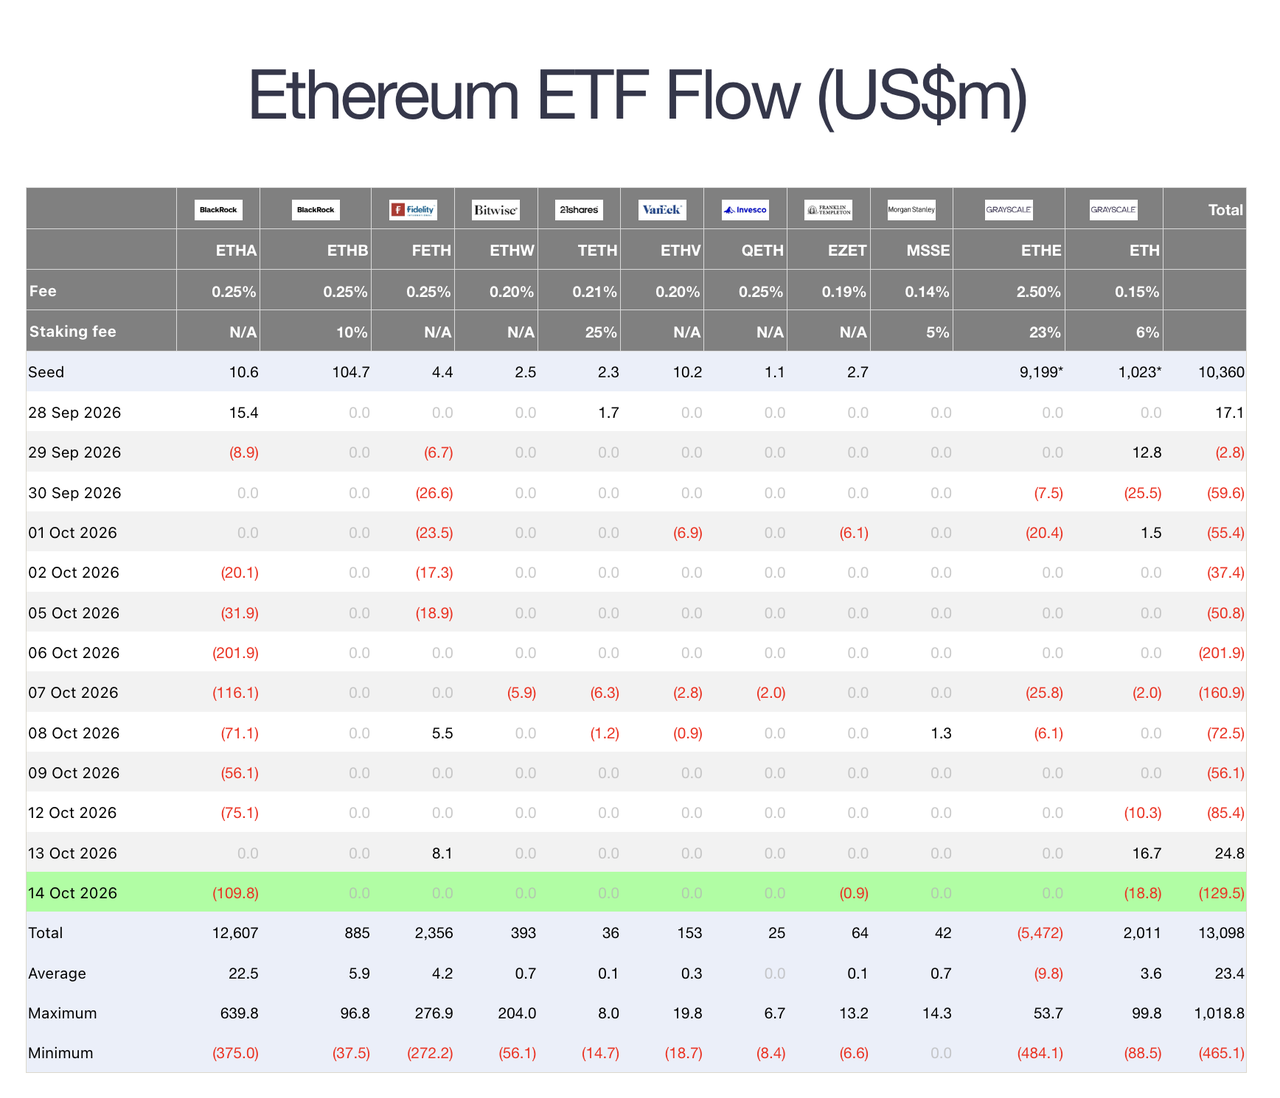
Before the release of US CPI data, spot Ethereum ETFs had already recorded net outflows for 10 consecutive trading days, with cumulative outflows exceeding $700 million. Previously, sustained inflows into ETH ETFs had been one of the key factors supporting Ether's relative outperformance. Continued buying from traditional financial market participants helped underpin its price. However, the shift toward substantial ETF outflows has weakened buying momentum and exposed ETH to greater selling pressure, contributing to its underperformance relative to the broader crypto market over the past two weeks.
Data Source: Farside Investor
ETH Treasury Holdings: Bitmine Holds More Than 6 Million ETH as Its Staking Position Expands
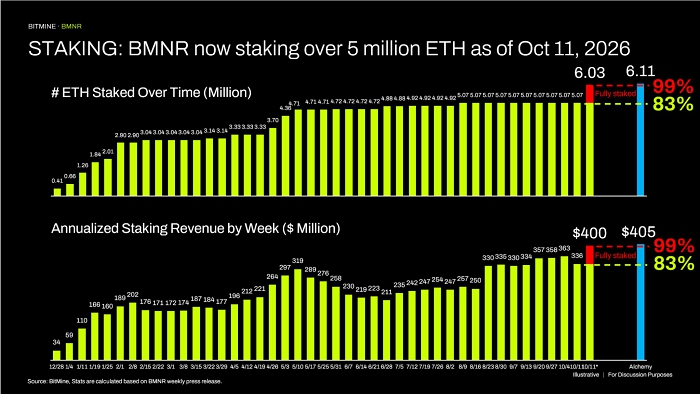
Bitmine, one of the world's largest corporate ETH treasury holders, has continued accumulating Ether over the past two weeks. The company now holds approximately 6.02 million ETH, with an average acquisition cost of around $2,544 per ETH. Of that total, approximately 5 million ETH has been staked. Based on estimated staking yields, these assets could generate roughly $400 million in annual income for the company. However, with ETH falling below $2,400, its market price is now below Bitmine's average cost basis. This means that although the company continues to expand its ETH treasury through accumulation and staking, the recent price decline could put pressure on the market value of its holdings.
Data Source: SEC
ETH On-Chain Spot Market: Smaller Whale Wallets Turn Unprofitable as Cost Bases Vary Across Holder Groups
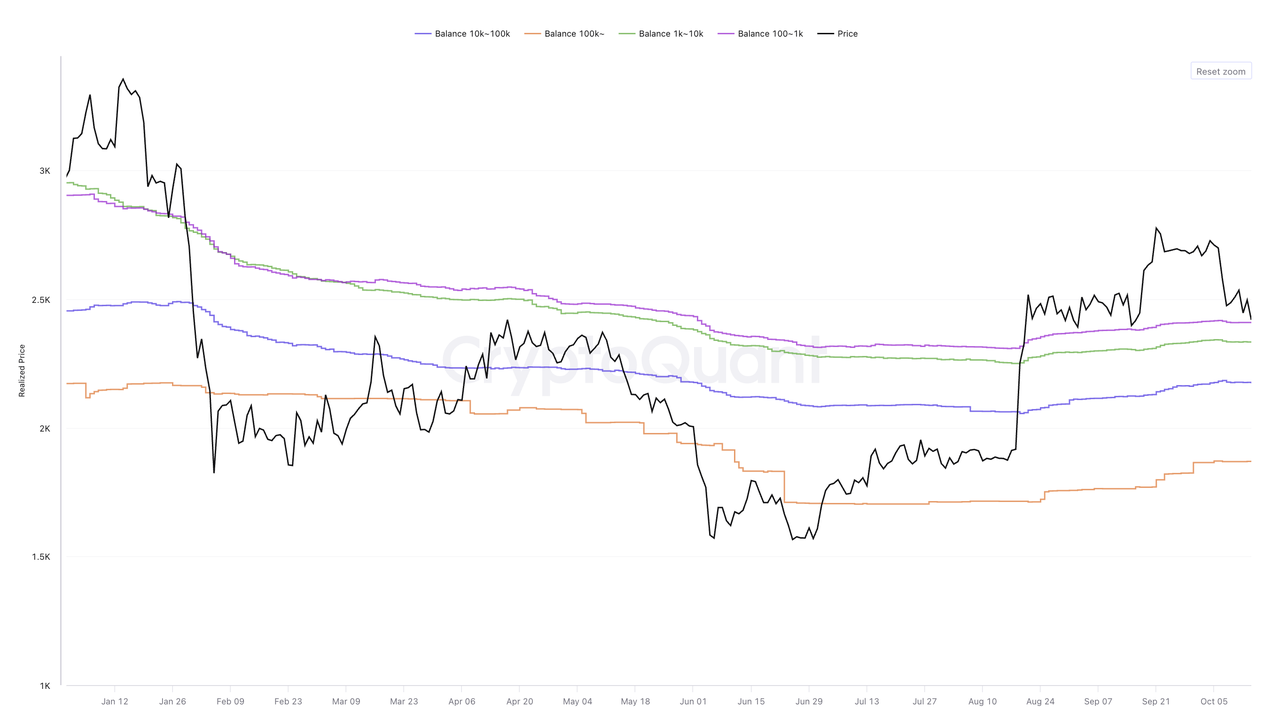
According to CryptoQuant data, some on-chain ETH holders have moved from unrealized profits to losses as ETH fell below $2,400. Addresses holding fewer than 1,000 ETH are sitting on average unrealized losses of approximately 2%, while the average cost basis of addresses holding between 1,000 and 10,000 ETH is roughly in line with the current market price.
Average acquisition costs vary considerably across different holder groups, resulting in different levels of unrealized profit and downside protection.
ETH Holdings per Address | Average Cost Basis |
More than 100,000 ETH | $1,869 |
10,000–100,000 ETH | $2,172 |
1,000–10,000 ETH | $2,331 |
100–1,000 ETH | $2,400 |
These differences suggest that larger holders with lower average cost bases retain greater unrealized profits, while smaller holders are more exposed to the recent pullback. Further price declines could put additional pressure on holders whose cost bases are close to or above the current market price.
Data Source: CryptoQuant
ETH On-Chain Derivatives: Long Exposure Increases, but Several Large Traders Are Sitting on Unrealized Losses
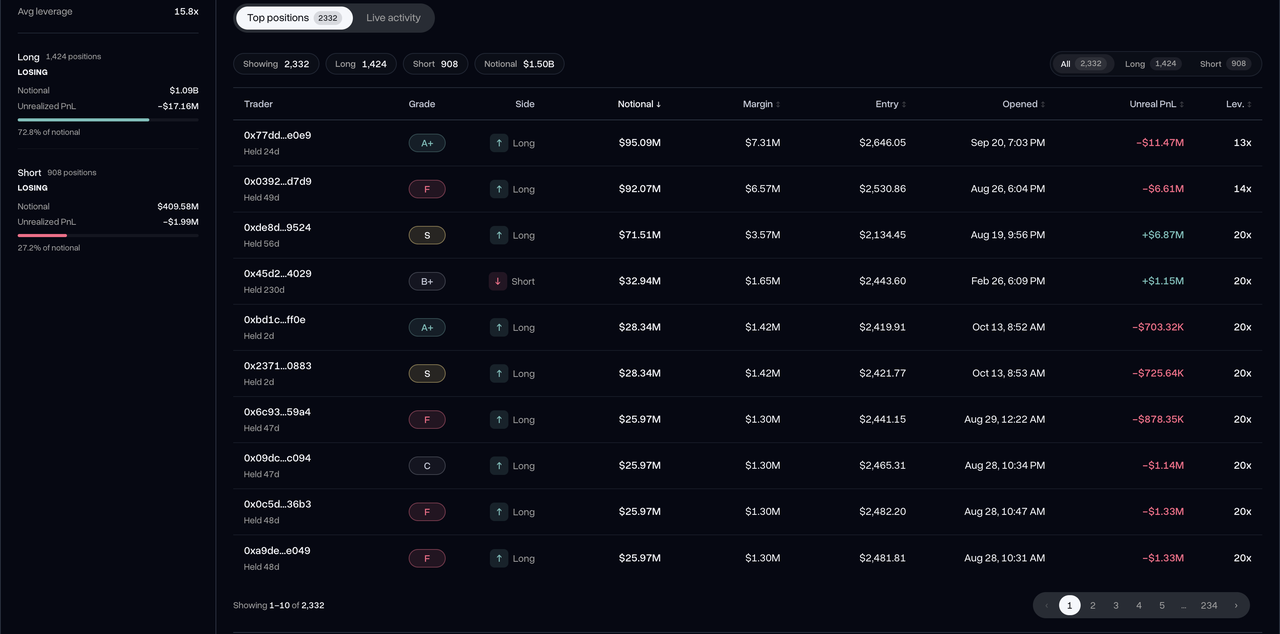
As of September 3, ETH long positions on Hyperliquid had a notional value of approximately $1.09 billion, compared with $409 million in short positions. The long-to-short ratio stood at around 72:28, indicating a clear advantage for bullish positioning. Notably, long exposure to the derivatives market continued to increase even as spot prices for major crypto assets, including BTC and ETH, weakened and ETF capital continued to flow out. This suggests that some on-chain traders remain optimistic about the outlook for major crypto assets. However, an examination of the ten wallet addresses with the largest ETH derivatives positions shows that eight are currently sitting on unrealized losses. This indicates that some large traders are maintaining their long positions despite facing increasing pressure from the recent price correction.
The divergence between weakening spot markets and rising derivatives long exposure suggests that market participants remain divided over ETH's near-term direction. In addition to tracking changes in long positioning, traders should monitor whether unrealized losses among large holders deepen and whether these traders begin reducing or closing their positions.
Data Source: Hyperstats
TRX Price Performance: TRX Holds Near $0.33, Significantly Outperforming the Broader Market
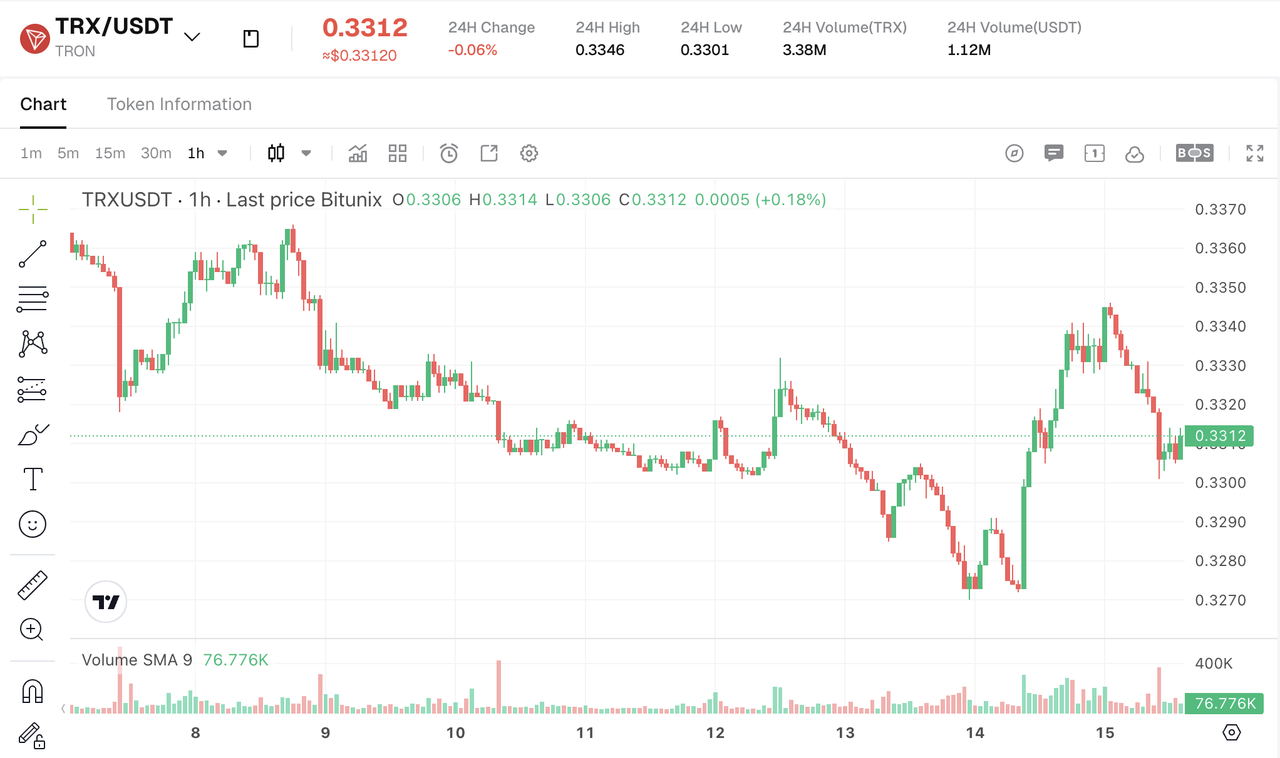
TRX has been one of the more resilient major crypto assets over the past two weeks. As cryptocurrency ranked among the top 10 by market capitalization, TRX has traded largely around $0.33, holding steady while major assets such as ETH, SOL, and HYPE experienced more substantial declines. Its largely range-bound performance highlights its relative resilience during the recent market pullback.
However, this price stability has not translated into meaningful upside momentum. Even after the US government signaled stronger support for the crypto industry in August 2026, TRX failed to stage a significant breakout. Since June 2026, its price has remained broadly stable around $0.33, suggesting a balance between buying and selling pressure and a continued consolidation phase.
Data Source: Bitunix
TRX Treasury Strategy: Tron Inc. Plans to Raise Up to $200 Million Through a Stock Offering to Accumulate More TRX
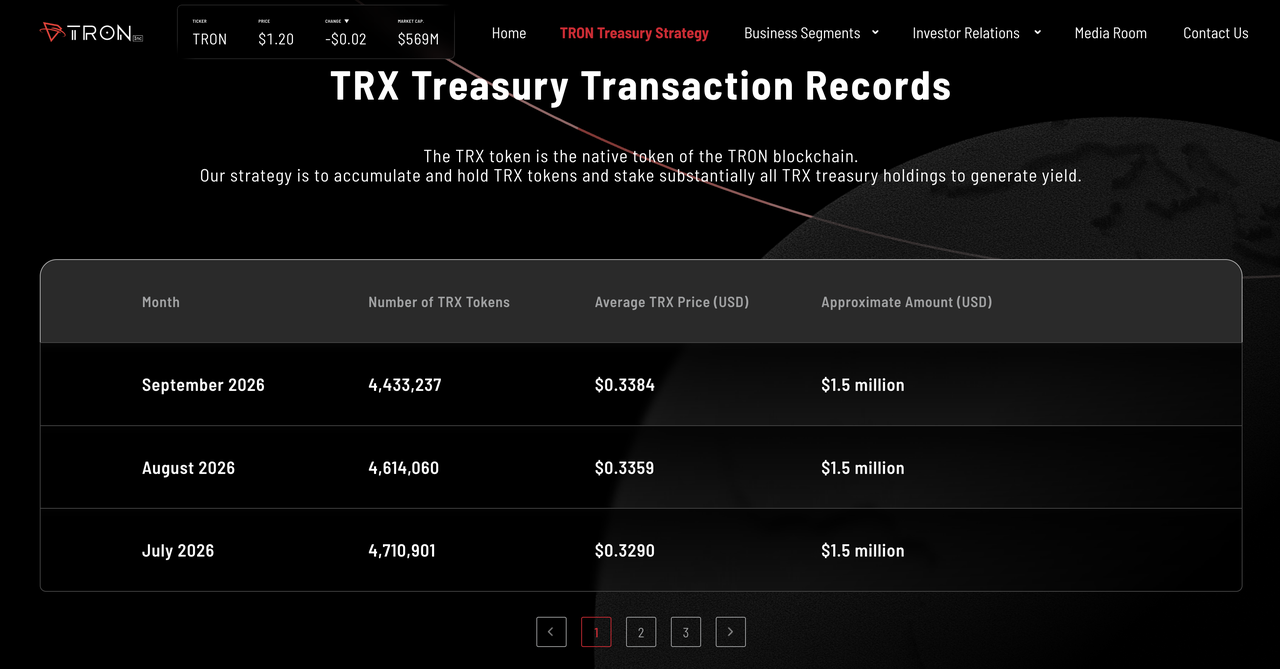
On October 14, 2026, Tron Inc. signed a stock sales agreement with broker Clear Street LLC, allowing the company to raise up to $200 million through the sale of common shares over time. According to the company's filing with the US Securities and Exchange Commission (SEC), the net proceeds are intended primarily for additional TRX purchases, expanding its digital asset treasury. Beyond accumulating TRX, Tron Inc. plans to stake a large portion of its treasury holdings and pursue yield-generating activities through mechanisms associated with the TRON ecosystem, including JustLend DAO. These activities are intended to generate staking rewards and income from energy leasing.
If the company successfully completes the offering and uses the proceeds to purchase TRX as planned, the purchases could create additional market demand for the token. As of October 12, 2026, Tron Inc. held approximately 718 million TRX. Going forward, key metrics to monitor include the actual amount raised, the pace at which proceeds are deployed into TRX, and whether the company's holdings continue to expand.
Data Source: Tron lnc
TRX On-Chain Derivatives: Shorts Outnumber Longs, While Notional Exposure Remains Far Below BTC and ETH
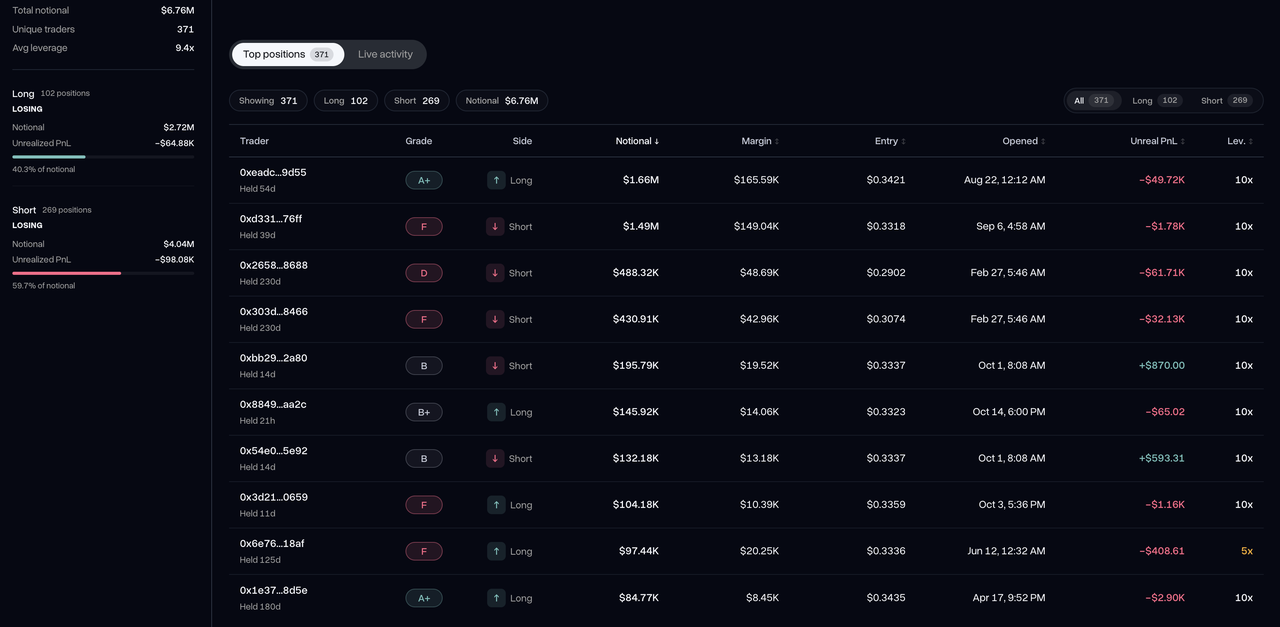
As of September 3, TRX long positions on Hyperliquid had a notional value of approximately $2.72 million, compared with $4.04 million in short positions. The long-to-short ratio stood at roughly 41:59, indicating that short positioning had the upper hand. By comparison, the notional value of derivatives positions in assets such as BTC, ETH, and HYPE exceeded $1 billion. TRX's derivatives market is therefore considerably smaller, with much lower trading participation. One possible explanation is TRX's prolonged lack of a clear price trend. Extended periods of sideways trading offer fewer opportunities for short-term traders seeking directional moves, making the token less attractive to on-chain traders who favor high-volatility, high-risk opportunities.
Data Source: Hyperstats
Blue-Chip Asset Biweekly Summary
Over the past two weeks, hotter-than-expected US CPI and core CPI readings have fueled expectations of further Fed rate hikes, pushing BTC below $81,000 and ETH below $2,400. Persistent spot ETF outflows have added to the pressure on crypto markets. On-chain data shows that long positions still dominate BTC and ETH derivatives markets, although some large ETH holders are now sitting on unrealized losses, highlighting a divergence between weakening spot markets and bullish derivatives positioning. Meanwhile, Strategy and Bitmine continue to allocate capital to BTC and ETH through their respective treasury strategies. In contrast, TRX has held near $0.33 and demonstrated relative resilience. Tron Inc. also plans to raise up to $200 million through a stock offering to accumulate more TRX, making its actual fundraising progress and subsequent purchases important developments to watch.