

Article Summary
- This article explains the concept of Bitcoin dominance (BTC.D) and its significance in the cryptocurrency market.
- It details how Bitcoin dominance is calculated by comparing Bitcoin's market capitalisation to the total market cap of all cryptocurrencies.
- The article explores the relationship between Bitcoin dominance and "altcoin seasons," providing a framework for understanding capital flow.
- It includes a practical guide on how traders use the BTC.D chart to make informed decisions about portfolio allocation.
- The piece addresses the limitations of the metric, particularly the impact of stablecoins on the calculation.
Crypto never sits still. New tokens launch, old narratives fade, and every cycle produces a fresh batch of supposed world-changers. Yet one metric still helps traders make sense of the noise: Bitcoin dominance. It tells you how much of the total crypto market belongs to Bitcoin, and that simple ratio can reveal a lot about risk appetite, sector rotation, and where money is clustering at a given moment.
At the time of writing, CoinMarketCap's global charts page shows Bitcoin dominance at 58.5%, Ethereum at 10.9%, and the Altcoin Season Index at 32 out of 100, indicating a firmly Bitcoin Season rather than an altcoin season.
If you want to track those market rotations while trading, Bitunix is one crypto exchange where you can monitor BTC, ETH, and altcoin markets across spot and futures, and it also offers a mobile app for trading on the go. But the bigger point is not the platform. It is the signal. This guide explains how Bitcoin dominance is calculated, why it changes, and how traders use it to read crypto market cycles more clearly.
Understanding the Metric
CoinMarketCap's BTC dominance page defines the indicator clearly:
"Bitcoin (BTC) dominance is a metric used to measure the relative market share or dominance of Bitcoin in the overall cryptocurrency sector."
The math is simple: Bitcoin market cap divided by total crypto market cap, then multiplied by 100, on CoinMarketCap's global charts page, which currently works out to about 58.5%. TradingView presents the same idea through its BTC.D chart, which lets you watch the ratio change over time rather than treating it like a static number.
So, what is Bitcoin dominance in daily trading terms? It is a rough way to measure whether traders prefer Bitcoin or the rest of the market. When Bitcoin takes a bigger share of the total pie, BTC.D rises. When altcoins start gaining share faster than Bitcoin, BTC.D falls. High dominance usually points to stronger confidence in Bitcoin during uncertain periods, while low dominance suggests greater willingness to take risks in other crypto assets.
In the earliest years, Bitcoin made up almost the whole market because the market barely existed beyond Bitcoin itself. By late 2017 and early 2018, Binance data showed BTC dominance falling from 86.3% to 38.69% as the ICO boom sent capital into altcoins. Then the cycle turned again. Binance Research showed BTC dominance reaching a four-year high of 63% in April 2025, and later slipped from 65% in May 2025 to about 59% by August 2025 as early altcoin rotation returned.
Stablecoins complicate the picture. CoinMarketCap's dominance page says the chart includes tokens and stablecoins, not just cryptocurrencies. That matters because stablecoins now represent a significant share of the denominator. Reuters reported the stablecoin market cap at a record $251.7 billion in June 2025, and CoinMarketCap's stablecoin page now shows about $319.3 billion. So BTC.D can fall even when traders are simply moving into cash-like crypto rather than rotating into riskier altcoins.
The Capital Rotation Cycle
Bitcoin dominance becomes more useful when you stop looking at it in isolation and start reading it as part of a cycle. Higher BTC dominance typically occurs when investors prefer Bitcoin amid volatility, while lower dominance often emerges when traders are more willing to chase higher-upside assets. In other words, BTC.D is less about hero worship for Bitcoin and more about whether the market feels brave or cautious.
That is why BTC.D often rises in stressful markets. Binance Research linked Bitcoin's April 2025 move to 63% dominance with tight financial conditions, geopolitical uncertainty, and Bitcoin's digital-gold narrative. Bitunix made the same point in its February 2026 crash explainer, noting that Bitcoin fell during the selloff but held up better than Ethereum because the market still treated BTC as the lowest-risk crypto asset.
The opposite happens when confidence returns. Coinbase Institutional's August 2025 outlook said Bitcoin dominance dropped from 65% in May to about 59% by August, which it viewed as the early stage of rotation into altcoins. During that same period, the altcoin market cap had climbed more than 50% since early July to $1.4 trillion. That is the classic risk-on setup: Bitcoin rallies first, then large-cap altcoins start moving, and later the smaller names try to steal the spotlight.
You can think about crypto market cycles in four broad phases:
- Bitcoin rallies while altcoins lag, so BTC.D rises.
- Bitcoin steadies and large-cap names like Ethereum begin catching up, so BTC.D eases.
- Smaller altcoins join the move, and BTC.D falls more sharply.
- The market overheats, exhaustion sets in, and traders rotate back toward Bitcoin, stablecoins, or the sidelines.
If you still ask what is Bitcoin dominance after watching a few of these rotations, the practical answer is that it is a market-share gauge that often tells you whether traders are seeking safety, reaching for more risk, or quietly preparing to do one after the other. That is why many traders keep the BTC dominance chart open next to price charts.
How to Trade Using Bitcoin Dominance
CoinMarketCap's current dashboard shows Bitcoin dominance at 58.5% and the Altcoin Season Index at 32, indicating the market is still tilted toward Bitcoin rather than broad altcoin strength. If you trade on Bitunix or any similar venue, that sort of context can help you size exposure, decide whether to lean into BTC or alts, and avoid buying the weakest part of the market at the wrong time.
To trade safely using Bitcoin dominance, combine BTC price direction, BTC.D direction, and broader market sentiment. If Bitcoin is rising and BTC.D is rising, the market is usually rewarding Bitcoin first. If Bitcoin is steady while BTC.D falls, altcoins are taking market share. If both Bitcoin and altcoins are falling but BTC.D rises, that usually means traders are cutting risk harder in altcoins. And if both price and BTC.D fall together, the market is often in a more aggressive washout.
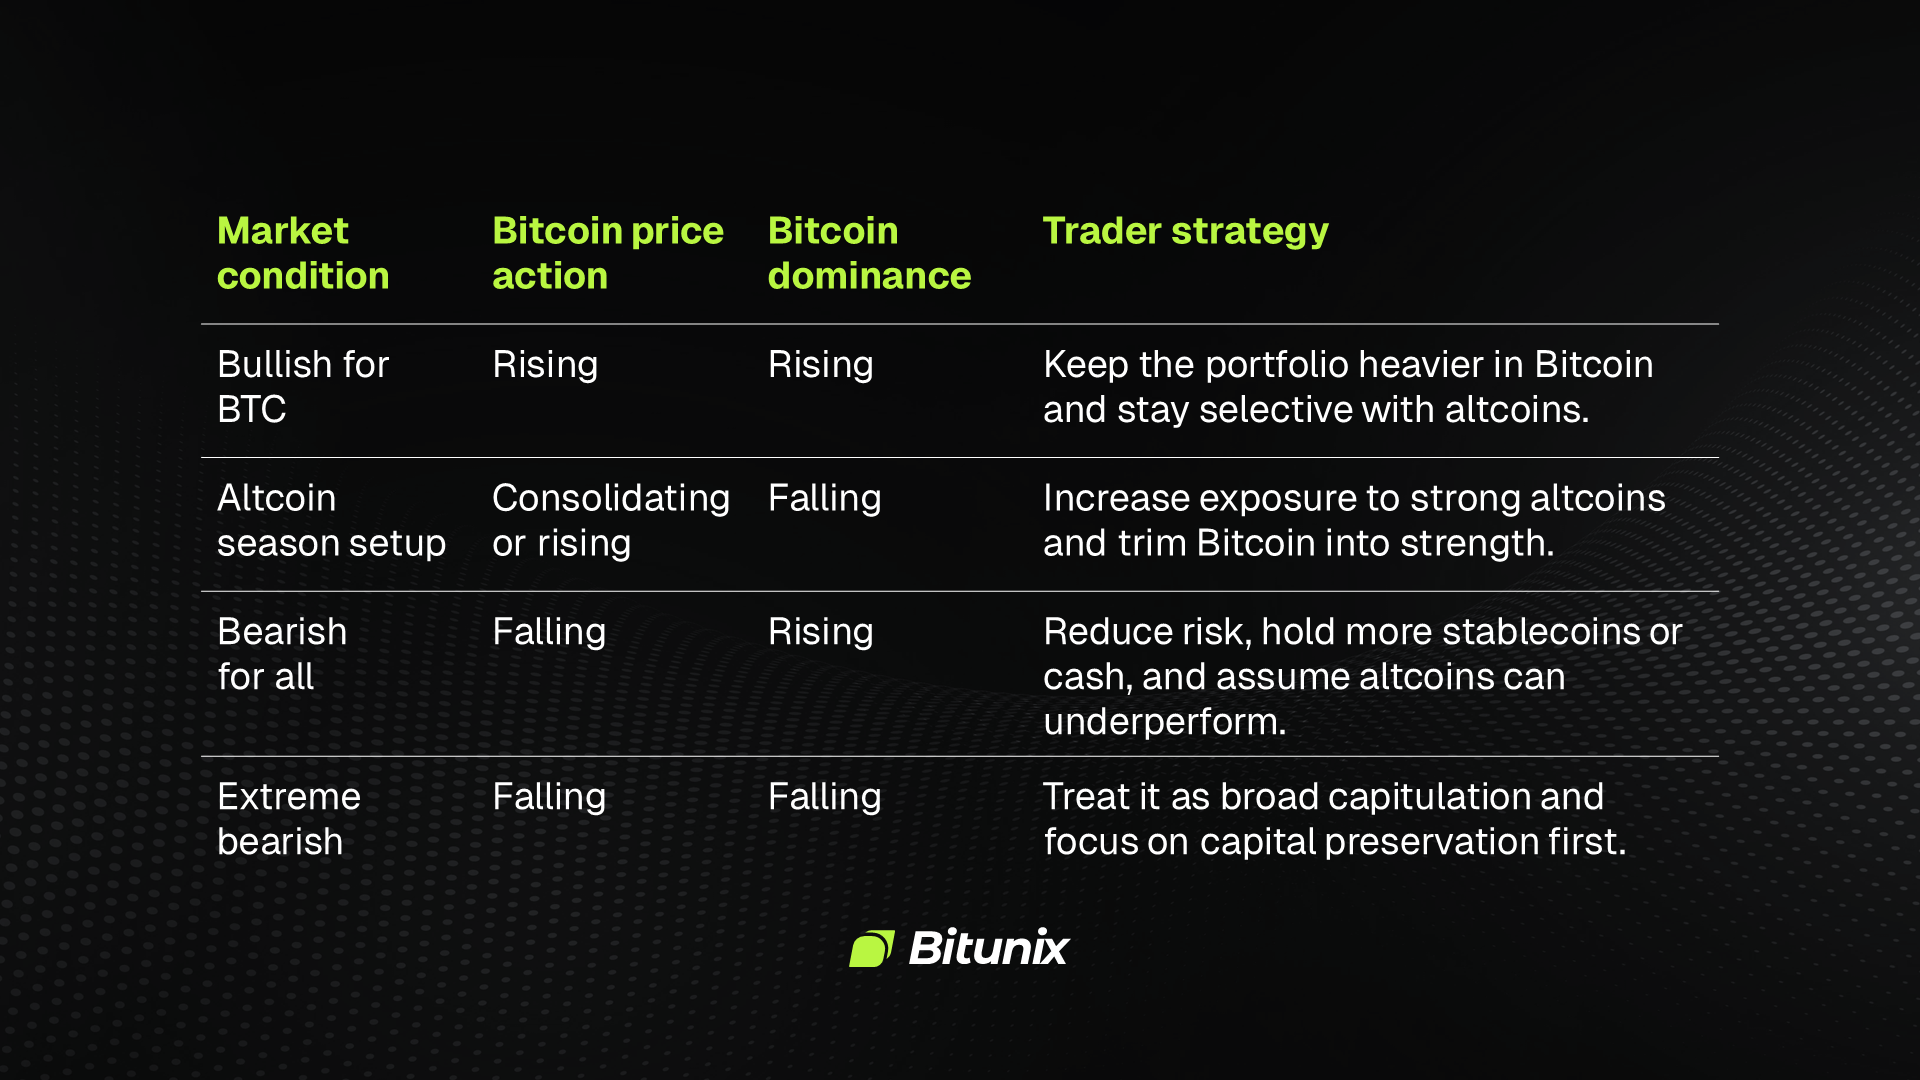
Strategy table showing how traders can position for rising or falling Bitcoin dominance across bullish, altcoin, and bearish market conditions.
CoinMarketCap defines altcoin season as a period when 75% of the top 100 altcoins outperform Bitcoin over 90 days. Coinbase Institutional said the index was still only in the low 40s in August 2025, even after meaningful altcoin gains, and CoinMarketCap now shows it at 32. So the lesson is that one strong week in altcoins does not automatically mean a full altcoin season has arrived.
Limitations and Criticisms
The first weakness in Bitcoin's dominance is the denominator: the dominance chart includes tokens and stablecoins, not just cryptocurrencies. This means, by inference, BTC.D can understate Bitcoin's practical weight if the denominator contains thinly traded, illiquid, or effectively dead assets that still carry a market cap on paper.
The second weakness is that the market no longer revolves around Bitcoin alone. Ethereum and its surrounding sectors are too large for that old reality. Amundi's 2025 research separates Bitcoin, Ethereum, programmable blockchains, and stablecoins into distinct segments of the market. Arkm's 2025 Ethereum report adds that Ethereum held just over $70 billion in TVL as of November 2025, far ahead of other Layer 1 chains. That kind of scale helps explain why BTC.D is unlikely to revisit its earliest-era extremes. Crypto now has permanent non-Bitcoin sectors with real economic weight.
So use Bitcoin dominance like a compass. It can show direction, but it cannot tell you every obstacle in the road. You still need price action, breadth, sentiment, and sector-level strength to avoid reading too much into one ratio.
Conclusion: A Compass, Not a Crystal Ball
Bitcoin dominance remains one of the best macro indicators in crypto because it shows where relative strength is concentrating. When BTC.D rises, the market usually favors Bitcoin over altcoins. When it falls, traders usually take more risk outside Bitcoin. That does not guarantee profits, but it gives you a better read on the market's appetite for risk and a stronger framework for navigating crypto market cycles.
However, stablecoins can distort the denominator, thin or abandoned tokens can make Bitcoin's real influence look smaller than it feels in practice, and Ethereum plus the wider smart-contract sector mean Bitcoin no longer rules a nearly empty field. Even so, BTC.D still deserves a place on your screen because it helps you judge whether the market is clustering in quality, broadening out into speculation, or simply trying to survive.
If you want to put the signal to work, Bitunix gives you access to BTC, ETH, and a wide range of altcoin markets across spot and futures, and you can download the Bitunix app and register there if you want to track these rotations from one place. Just do not treat any single metric as a substitute for risk management.
FAQ Section
What is a good Bitcoin dominance percentage?
There is no perfect percentage. A higher reading usually means Bitcoin is leading and risk appetite is lower. A lower reading usually indicates that altcoins are gaining market share. In early April 2026, CoinMarketCap showed BTC dominance around 58.5%, which still points to Bitcoin strength rather than a broad altcoin season.
What happens when Bitcoin dominance goes up?
When Bitcoin dominance rises, Bitcoin is taking a larger share of the total market. That often means traders prefer BTC over altcoins during uncertain conditions or early bull phases. Higher dominance is usually tied to stronger confidence in Bitcoin during volatility.
What happens when Bitcoin dominance goes down?
When Bitcoin dominance falls, altcoins are gaining share faster than Bitcoin. That usually happens when traders are more comfortable taking risks and rotating into Ethereum, Solana, and smaller names.
How do I know when altcoin season is starting?
Start with the CMC Altcoin Season Index and the BTC dominance chart together. CoinMarketCap says altcoin season happens when 75% of the top 100 altcoins beat Bitcoin over 90 days. A falling BTC.D and improving breadth usually give the clearest early signal.
Does Bitcoin dominance include stablecoins?
Yes. CoinMarketCap's BTC dominance page says the chart includes tokens and stablecoins, not just cryptocurrencies. That is why a move into USDT or USDC can affect BTC.D even when traders are not buying more Bitcoin. Stablecoins now represent a very large share of total crypto market value.
Where can I view the Bitcoin dominance chart?
Two common places are CoinMarketCap and TradingView. CoinMarketCap shows live global metrics, including BTC dominance and the Altcoin Season Index. TradingView offers the BTC.D chart as a standalone instrument, which is useful if you like chart-based analysis and want to compare it with price action.
Why did Bitcoin dominance drop so much in 2017?
The 2017 ICO boom sent huge speculation into altcoins, especially Ethereum-based tokens. Binance data cited a drop in BTC dominance from 86.3% to 38.69% between late 2017 and early 2018. That period showed how quickly market share can shift when traders chase higher-risk returns.
Can Bitcoin dominance ever reach 100% again?
That is highly unlikely. Today's market includes Ethereum, stablecoins, major Layer 1 networks, and many other sectors with lasting economic weight. Amundi and Arkm both describe a crypto market where Bitcoin is important, but no longer the only serious segment. The market is structurally broader now.
How does Ethereum affect Bitcoin dominance?
Ethereum lowers Bitcoin dominance simply by being large. It now anchors a major smart-contract economy with DeFi, NFTs, stablecoins, and Layer 2 activity. Arkm's 2025 Ethereum report said Ethereum held just over $70 billion in TVL in November 2025, which shows how large the non-Bitcoin side has become.
Is Bitcoin dominance a reliable trading indicator?
It is useful, but it is not enough on its own. BTC.D helps you see relative strength and risk appetite, but stablecoins, dead tokens, and temporary speculation can distort it. Use it alongside price action, breadth, and sentiment rather than treating it as a standalone trading system.
Glossary
- Bitcoin dominance: The percentage of total crypto market cap represented by Bitcoin.
- BTC dominance chart: A live chart that tracks Bitcoin's share of total crypto market value over time.
- Market capitalization: The total value of an asset, calculated by price multiplied by circulating supply.
- Altcoin season: A period when most major altcoins outperform Bitcoin over a set window, commonly 90 days.
- Stablecoin: A token designed to maintain a stable value, usually tied to a fiat currency such as the U.S. dollar.
- Risk appetite: The willingness of traders to move from safer assets into higher-volatility assets.
- ICO boom: The 2017 period when token sales drove huge speculation into Ethereum-based and other altcoins.
- Digital gold narrative: The idea that Bitcoin behaves like a scarce macro hedge inside and sometimes beyond crypto markets.
- Altcoin Season Index: CoinMarketCap's gauge of whether top altcoins have outperformed Bitcoin over the last 90 days.
- Portfolio diversification: Spreading exposure across assets rather than concentrating in one token or sector.
- Total crypto market cap: The combined market value of all tracked crypto assets.
- Programmable blockchains: Networks such as Ethereum that support smart contracts and decentralized applications.
- TVL: Total value locked, or the dollar value deposited in DeFi protocols.
- Relative strength: A comparison of how one asset or sector is performing against another.
- Sector rotation: A market shift where traders move from one part of crypto, such as Bitcoin, into another, such as altcoins or stablecoins.
Disclaimer
This article does not provide:
(i) investment advice or investment recommendations;
(ii) an offer or solicitation to buy, sell, or hold digital assets;
(iii) financial, accounting, legal, or tax advice.
Digital assets, including stablecoins and NFTs, involve high risk and may fluctuate significantly. Consider whether trading or holding digital assets is appropriate for you given your financial situation. Consult a qualified legal, tax, or investment professional when needed. You are responsible for understanding and complying with applicable local laws and regulations.
About Bitunix
Bitunix is a global cryptocurrency derivatives exchange trusted by over 3 million users across more than 100 countries. At Bitunix, we are committed to providing a transparent, compliant, and secure trading environment for every user. Our platform features a fast registration process and a user-friendly verification system supported by mandatory KYC to ensure safety and compliance. With global standards of protection through Proof of Reserves (POR) and the Bitunix Care Fund, we prioritize user trust and fund security. The K-Line Ultra chart system delivers a seamless trading experience for both beginners and advanced traders, while leverage of up to 200x and deep liquidity make Bitunix one of the most dynamic platforms in the market.
Bitunix Global Accounts
X | Telegram Announcements | Telegram Global | CoinMarketCap | Instagram | Facebook | LinkedIn | Reddit | Medium