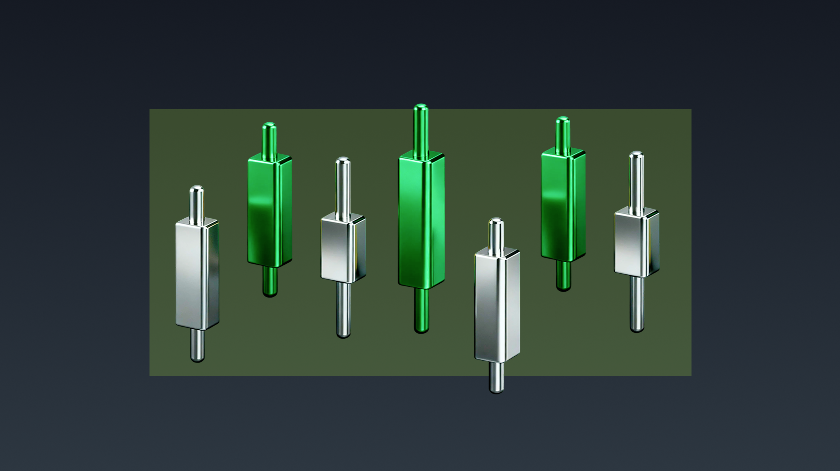
1.Quick Information Summary
Item | Details |
Platform | Bitunix — Futures K-Line / perpetual contracts |
Pattern | M-top = Double top (bearish reversal near uptrend end) |
Structure | Left peak → pullback → neckline (support) → right peak (often weaker) → break below neckline |
Invalidation | Right peak clearly above left peak / prior high |
Confirmation | Close below neckline (not wick only) + volume + optional MACD bear cross |
Multi-TF (lesson) | Daily structure · 4H neckline weakness · 15m execution |
Above neckline | Bulls still short-term control — avoid aggressive shorts |
Below neckline | Bears favored — short bias, cautious longs |
Entry style | Retest of neckline as resistance after break (vs chasing first tick down) |
TP (measured move) | Peak–neckline height projected down; ~50% at TP1, remainder at 2× projection |
Trend filter (examples) | Hold short while below Daily EMA30 / EMA120; exit on decisive close above |
SL (examples) | Close above double-top high (e.g. BTC 82,800, ETH 3,403.44 in lesson) |
Trading fees | Futures maker/taker per fill; failed breaks add churn |
Signal timing | Pattern completes on neckline close; cases use 4H/D confirms |
Related | W-bottom · Box range · S/R TA 2 · MACD · 3-step SOP · Academy |
Valid vs Failed M-Top — Comparison
Signal | Valid M-top (bearish) | Failed / false M-top |
Right peak | Fails to exceed left peak meaningfully | New high above first peak |
Neckline | Close below + selling volume | Holds as support, repeated reclaim |
Rallies to right peak lighter than left | Strong buy volume on break up | |
Indicators | MACDweakness / bear cross (optional) | Momentum stays bullish |
Action | Short on retest or confirmed break plan | Exit shorts; pattern dead |
HTF | D/4H structure aligned | 15m M-top in strong HTF bull = often noise |
2.Product DefinitionWhat Is the M-Top Pattern?
The M-Top Pattern, commonly known as the Double Top Pattern, is a classic bearish reversal pattern in technical analysis.
It is called an M-top because the price structure resembles the letter “M”. The pattern typically forms near the end of an uptrend and signals that bullish momentum is weakening while selling pressure is gradually increasing.
In essence, the pattern reflects:
Exhaustion of bullish momentum
Increasing bearish participation
Failure to establish new highs
A potential transition from an uptrend to a downtrend
For futures traders, the M-top pattern is one of the most effective tools for identifying potential short-selling opportunities.
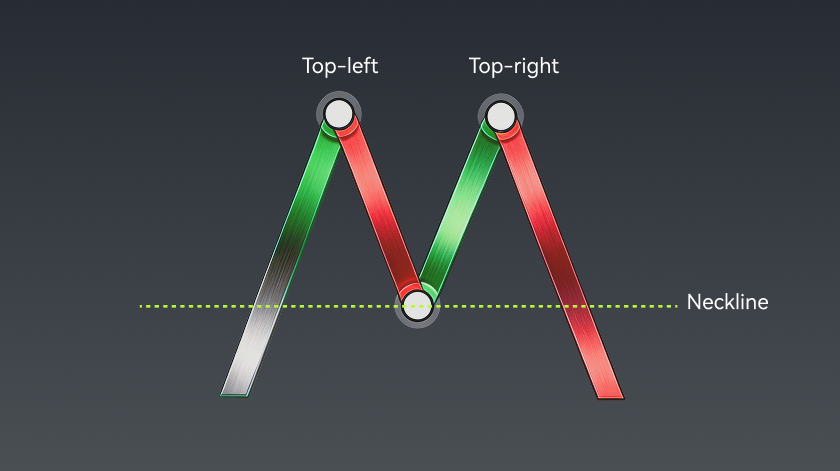
Core Components of an M-Top Pattern
Left Peak
After a strong bullish advance, buying momentum begins to weaken and price forms the first major peak.
Typical characteristics include:
Strong prior uptrend
Increasing profit-taking activity
Volume begins to decline after reaching a peak
Momentum starts to weaken
This creates the first peak of the M-top formation.
Neckline
After the first peak forms, profit-taking causes price to decline.
The subsequent swing low creates the neckline, which serves as the key support level of the pattern.
The neckline is the most important level in the entire structure because it separates bullish control from bearish control.
Right Peak
After rebounding from the neckline, price attempts another rally.
However:
Buying momentum is weaker than during the first rally.
Price often fails to make a meaningful new high.
Trading volume is usually lower than at the left peak.
This failure to generate a stronger rally suggests that buyers are losing control while sellers are becoming more aggressive.
Neckline Breakdown
The pattern is confirmed only when price breaks below the neckline.
A valid breakdown generally includes:
Strong bearish candles
Increased selling volume
A close below the neckline
Once confirmed, the M-top becomes a completed bearish reversal pattern.
Additional confirmation may come from indicators such as a MACD bearish crossover, creating a confluence of bearish signals.
2.M-Top Futures Trading Rules
2.1 Pattern Confirmation Rules
Avoid False M-Tops
The right peak should not decisively break above the left peak.
If price makes a strong new high above the first peak, the M-top structure is invalidated and bullish momentum remains dominant.
Neckline Breakdown Requirement
A valid breakdown requires:
A candle close below the neckline
Not merely a wick or brief intraday breach
Temporary moves below the neckline without a confirmed close should be treated as potential false breakouts.
Multi-Timeframe Confirmation
For higher-probability setups:
Use the Daily chart to identify the overall M-top structure.
Use the 4-hour chart to confirm neckline weakness.
Use the 15-minute chart for precise trade execution.
This top-down approach significantly improves signal quality.
2.2 The Neckline as the Key Decision Level
The neckline divides the market into two distinct zones.
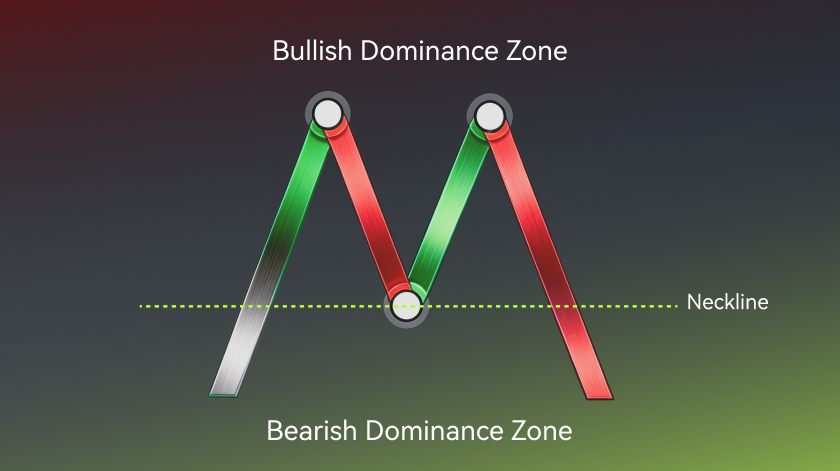
Below the Neckline
Sellers are in control.
Bearish momentum dominates.
Short positions are favored.
Aggressive long positions should be avoided.
Above the Neckline
Buyers still retain short-term control.
Market sentiment remains uncertain.
Aggressive short positions carry higher risk.
Successful M-Top
A successful M-top occurs when:
Price closes below the neckline.
Selling volume increases.
Bearish momentum accelerates.
This often triggers stop-loss orders from long positions and creates further downside pressure.
Failed M-Top
A failed M-top occurs when:
Price repeatedly holds above the neckline.
The neckline acts as strong support.
Selling pressure weakens.
In this scenario, the bearish setup is invalid and the market may resume its uptrend.
3.Practical Example
3.1 BTC/USDT Perpetual Futures (Daily + 4-Hour Multi-Timeframe Analysis) ✅
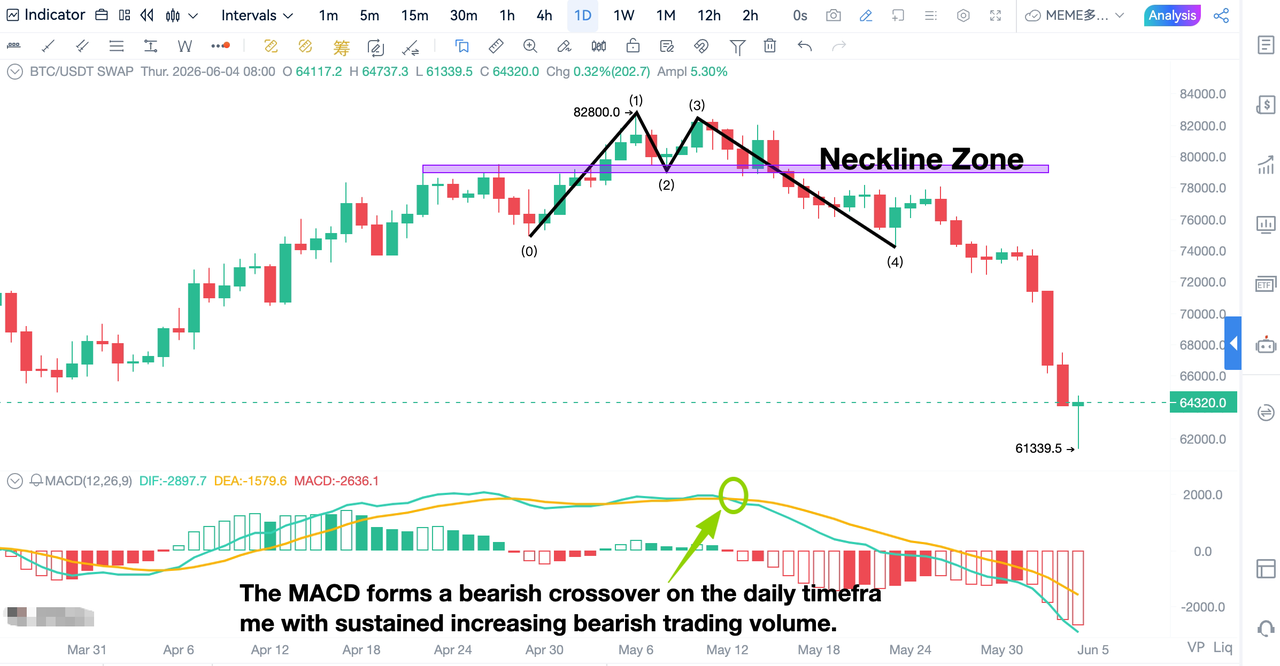
BTC/USDT perpetual contract (daily level)
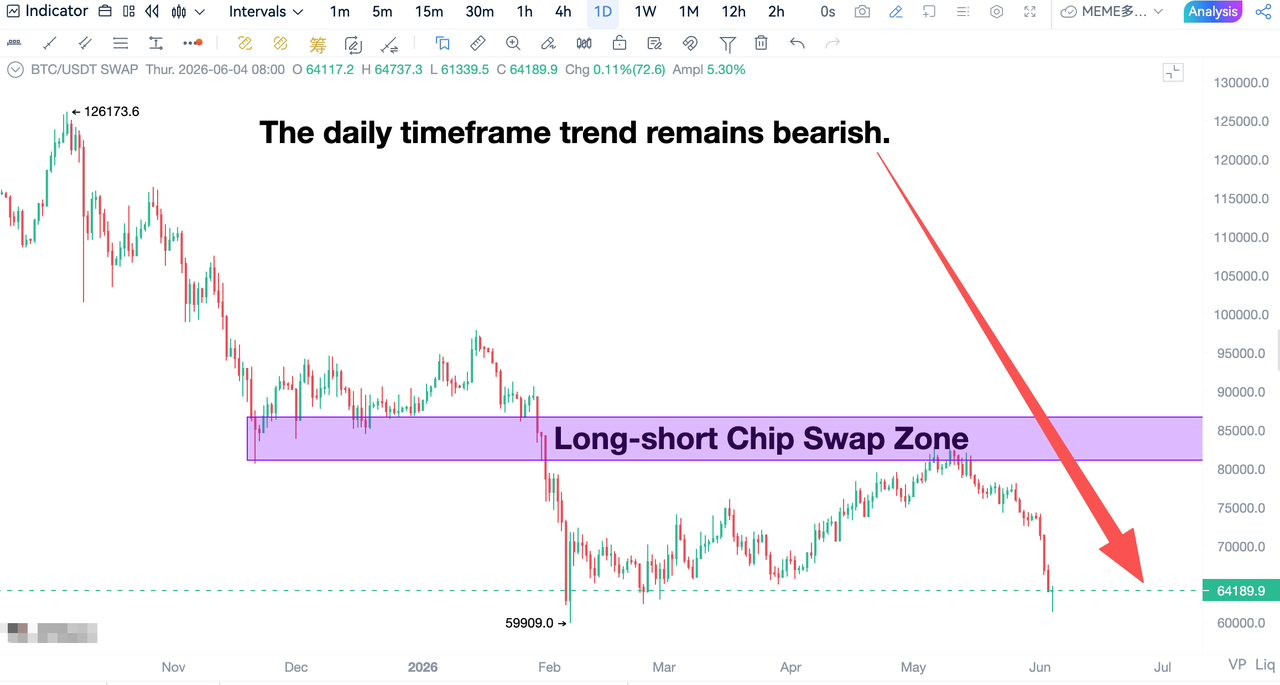
BTC/USDT perpetual futures (daily level MACD volume chart)
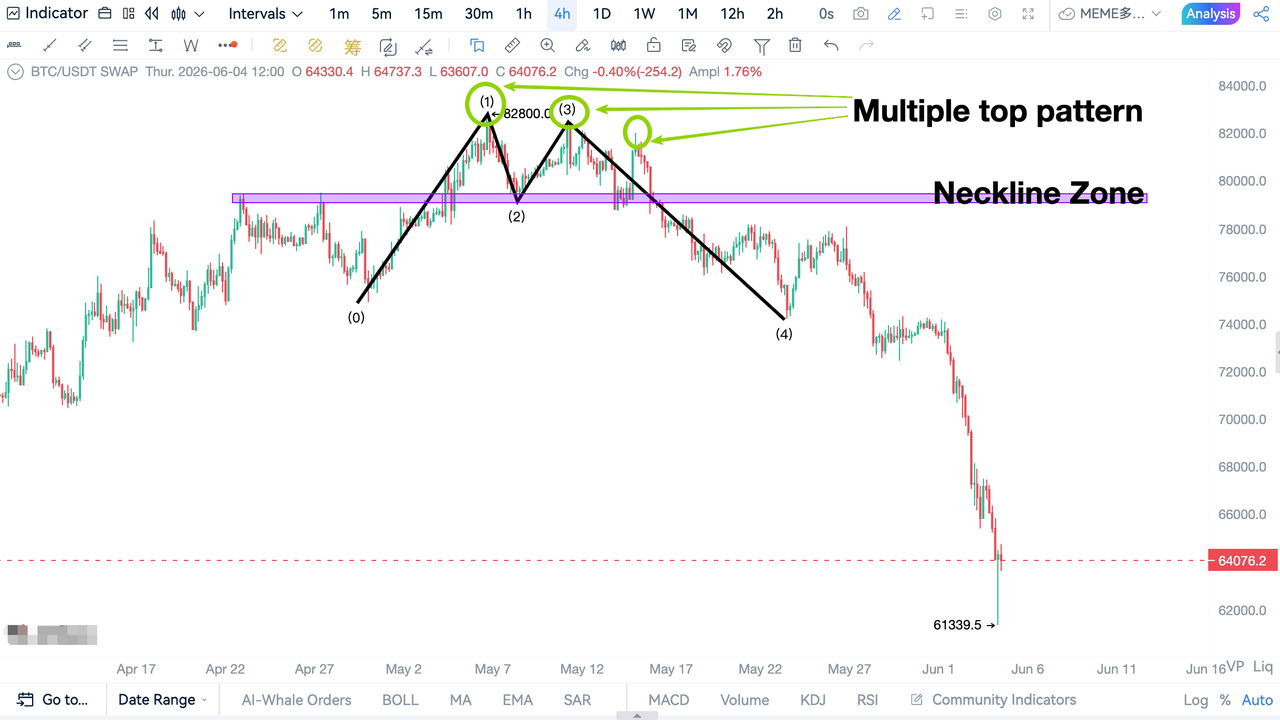
BTC/USDT perpetual futures (4-hour level)
1、M-Top Structure
The Daily and 4-hour charts formed a clear M-top structure:
Double-top resistance: 82,800
Neckline support: 79,000
Price repeatedly tested resistance but failed to establish a higher high.
At the same time:
MACD momentum weakened.
A bearish MACD crossover developed.
Trading volume declined during rallies.
These signals indicated weakening bullish momentum.
2、Confirmation Conditions
The bearish setup was confirmed when:
Price failed to break above 82,800.
Multiple rejections occurred near resistance.
Price broke below the 79,000 neckline.
MACD remained bearish.
This confirmed the bearish reversal signal.
3、Short Entry Strategy
After the neckline broke, traders could look for short opportunities during pullbacks toward the 79,000 neckline area, which had now become resistance.
Scaling into positions gradually can help improve execution and risk management.
4、Risk Management
Take-Profit Targets
First Target
Measure the distance between the peaks and the neckline.
Project the same distance downward.
Close approximately 50% of the position.
Second Target
Extend the same measured move again.
Close the remaining portion of the position.
Trend Management
For longer-term trades:
Use the Daily EMA30 or EMA120 as trend filters.
Maintain short positions while price remains below these moving averages.
Exit positions if price closes decisively above the relevant trend filter.
Stop-Loss
The bearish setup becomes invalid if:
Price closes decisively above the previous high at 82,800.
In that case:
The M-top pattern is invalidated.
All short positions should be closed according to the predefined stop-loss plan.
3.2 ETH/USDT Perpetual Futures (Daily + 4-Hour Analysis) ✅
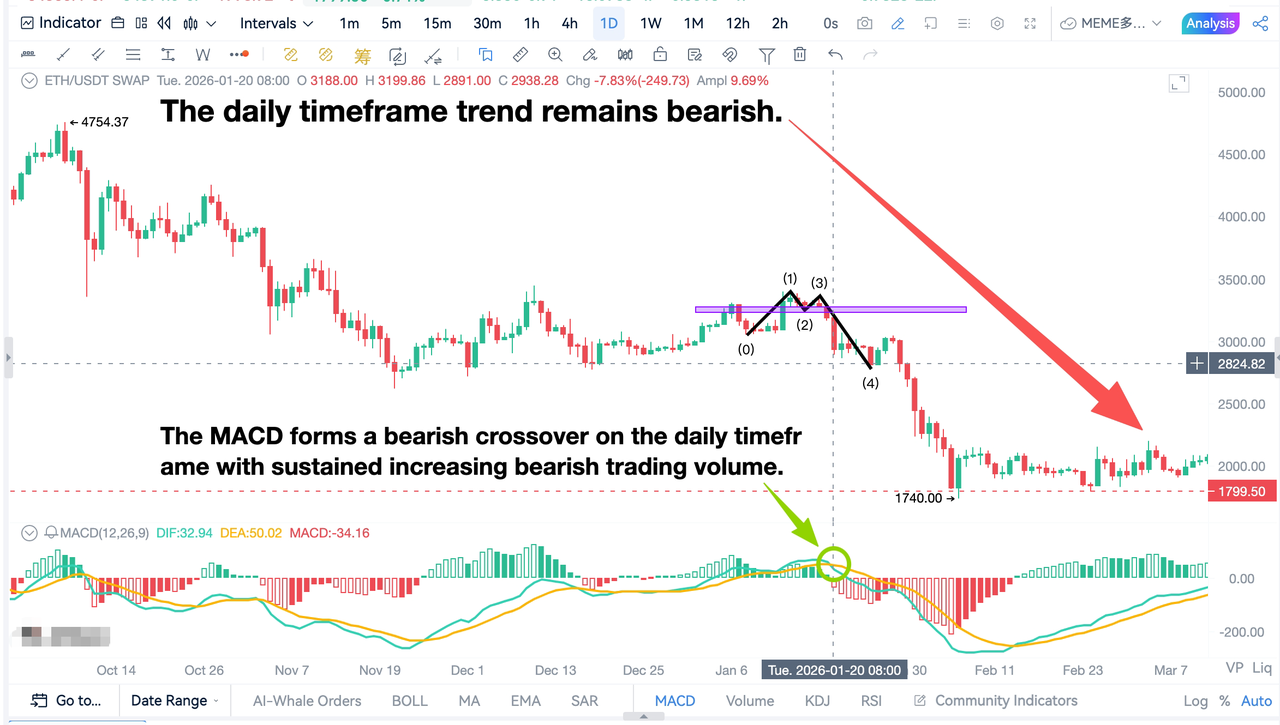
ETH/USDT perpetual futures (daily K-line + MACD volume chart)
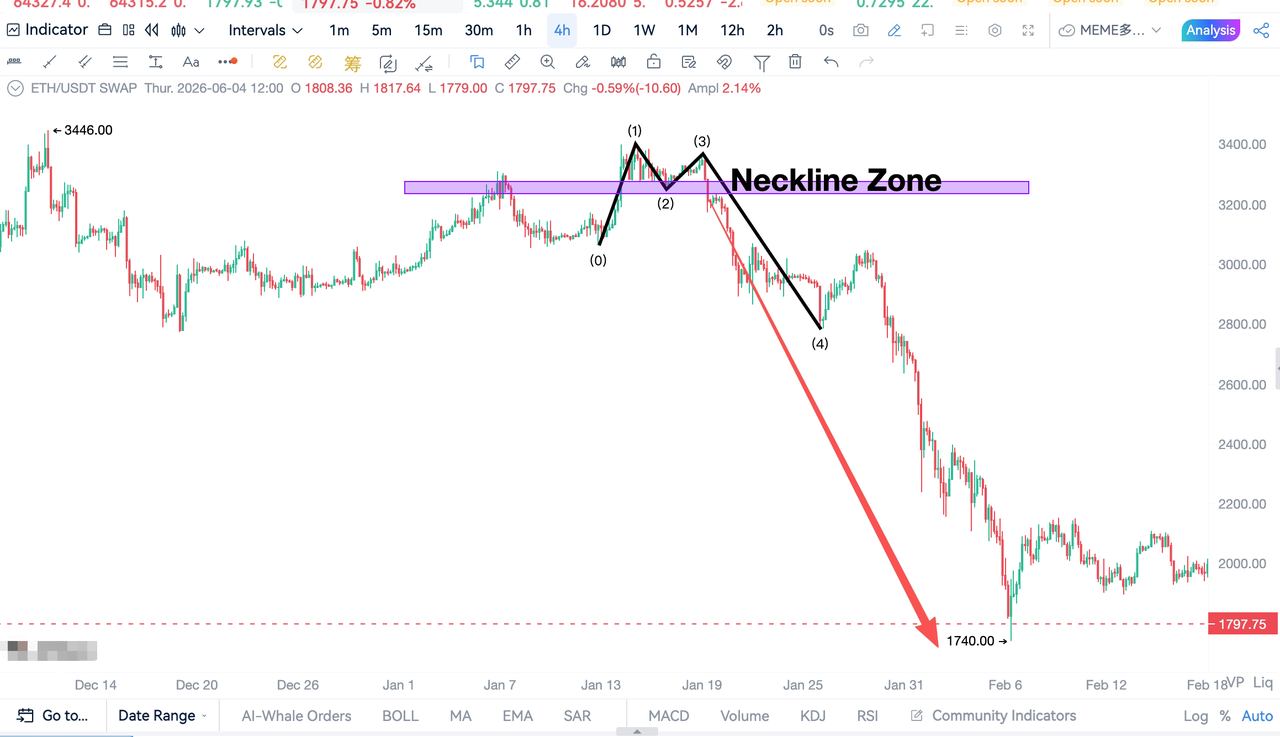
ETH/USDT perpetual futures (4-hour level)
1、M-Top Structure
ETH formed a classic M-top pattern with:
Double-top resistance: 3,403.44
Neckline support: 3,260
Price attempted to retest the previous high but failed to break higher.
Additional bearish confirmation included:
Bearish MACD crossover
Weakening bullish momentum
Resistance holding firm after multiple tests
2、Confirmation Conditions
The bearish signal was confirmed when:
Price failed to break above the previous high.
The 4-hour chart showed increasing bearish momentum.
Price broke below the 3,260 neckline for the second time.
This confirmed the validity of the bearish reversal setup.
3、Short Entry Strategy
After the neckline breakdown, traders could consider entering short positions on pullbacks toward the 3,260 neckline resistance zone.
This approach offers a more favorable risk-to-reward ratio than chasing the breakdown.
4、Risk Management
Take-Profit Targets
First Target
Measure the height between the peaks and neckline.
Close approximately 50% of the position at the projected target.
Second Target
Project the same distance downward again.
Close the remaining position.
Trend-Based Position Management
Maintain short positions while:
Price remains below the Daily EMA30 or EMA120.
Market structure remains bearish.
Exit positions if the trend reverses and closes above key moving averages.
Stop-Loss
The bearish setup becomes invalid if:
Price closes above 3,403.44.
A breakout above the previous high invalidates the M-top structure and requires a full position exit.
Core Precautions for the M-Top Strategy (Avoiding Common Trading Mistakes)
Although the M-top pattern has a relatively high success rate, many traders still lose money because they enter positions too early, misinterpret signals, or ignore key confirmation factors. The following principles can help improve trade quality and reduce false signals.
1、Prioritize Higher Timeframes
Higher-timeframe M-top formations carry significantly more weight than lower-timeframe patterns.
An M-top that forms on the Daily or 4-hour chart is generally far more reliable than one appearing on the 15-minute or 1-hour chart.
If a lower-timeframe M-top forms while the higher-timeframe trend remains strongly bullish, it is often nothing more than a temporary correction rather than a true trend reversal.
Key principle:
Higher timeframes determine trend direction.
Lower timeframes are used to refine entries and exits.
Short positions generally have a higher probability of success when the larger timeframe has already established a valid bearish reversal structure.
2、Avoid Overtrading and Low-Quality Setups
Not every M-top pattern is worth trading.
Patterns that form:
Too quickly
Within a narrow price range
Without meaningful price expansion
In highly choppy markets
often generate unreliable signals.
These formations frequently produce:
False breakdowns
Whipsaw price action
Increased trading costs
Poor risk-to-reward opportunities
Focus only on well-developed M-top structures that exhibit:
Clear symmetry
Adequate price range
Sufficient formation time
Strong structural integrity
Patience is often more profitable than frequent trading.
3、Confirm Breakdowns with Volume and Indicators
One of the most common reasons traders lose money on M-top trades is entering after a neckline break that lacks confirmation.
Many false breakdowns occur when:
Price briefly moves below the neckline.
Trading volume remains weak.
Momentum indicators fail to confirm the move.
A higher-quality bearish setup typically includes:
Increased selling volume during the neckline breakdown
A bearish MACD crossover
Strong bearish candlestick closes
Sustained follow-through below support
The strongest signals occur when price structure and technical indicators align, creating multiple layers of confirmation.
Avoid entering trades based solely on a neckline breach without additional confirmation.
4、Trade With the Trend
Attempting to short against a strong bullish trend is one of the most common trading mistakes.
In powerful uptrends:
Many M-top formations become temporary consolidations.
Reversals often fail.
Price frequently resumes the primary trend.
The most reliable M-top patterns usually develop after:
Extended bullish trends
Significant price advances
Clear signs of momentum exhaustion
Always evaluate the broader market context before entering a trade.
Key principle:
Trade in the direction of the dominant trend whenever possible.
Avoid anticipating market tops without sufficient confirmation.
Let the market prove a reversal before committing capital.
Trading with the trend generally produces better long-term results than repeatedly attempting to call market tops.