
Quick Information Summary
Item | Details |
Platform | Bitunix — Futures K-Line / K-Line Ultra |
Strategy type | Range (box) trading + confirmed breakout trend follow |
Market fit | Sideways markets (~lesson: much of the time is range-bound vs pure trend) |
Box parts | Upper resistance · Lower support · Midline (equilibrium) · Breakout zone |
Multi-TF (recommended) | Daily = box structure · 15m = entries/exits & breakout confirm |
Range mode | Buy support / sell resistance with reversal candles + volume cues |
Breakout mode | Close outside box + volume + next 15m confirm → switch to trend follow |
Midline rule | Avoid new positions near center (poor R:R, unclear bias) |
Measured move TP | Box height projected from breakout; scale 50% at target 1, rest at target 2 |
Trend filter (examples) | Daily EMA30 — hold with trend, exit on decisive cross against |
Invalidation (examples) | 2× consecutive 15m closes back inside/beyond key level (RIVER/ETH rules) |
Trading fees | Futures maker/taker per fill; range trading = more round trips |
Signal timing | Box levels update live; rules use candle close (esp. 15m confirm) |
Related | S/R (TA 2) · Bear rectangle · 3-step SOP · Patterns · Academy |
Range Trading vs Breakout Trading — Comparison
Feature | Range (inside box) | Breakout (outside box) |
When | No valid break of boundaries | Decisive close beyond upper/lower + volume |
Direction | Long at support, short at resistance | Long above box, short below box |
Confirm | Reversal candles (Hammer, Doji, Shooting Star, Engulfing) | Strong break candle + next 15m + volume |
Stop | Beyond opposite boundary or invalidation rule | Failed break = return to range rules |
TP style | Opposite side of box or partial | Measured move (1× / 2× box height) |
Skill level | Beginner–intermediate | More experienced (larger trend moves) |
After failed break | Continue range playbook | Abandon breakout bias |
Product Definition:What Is the K-Line Box Pattern?
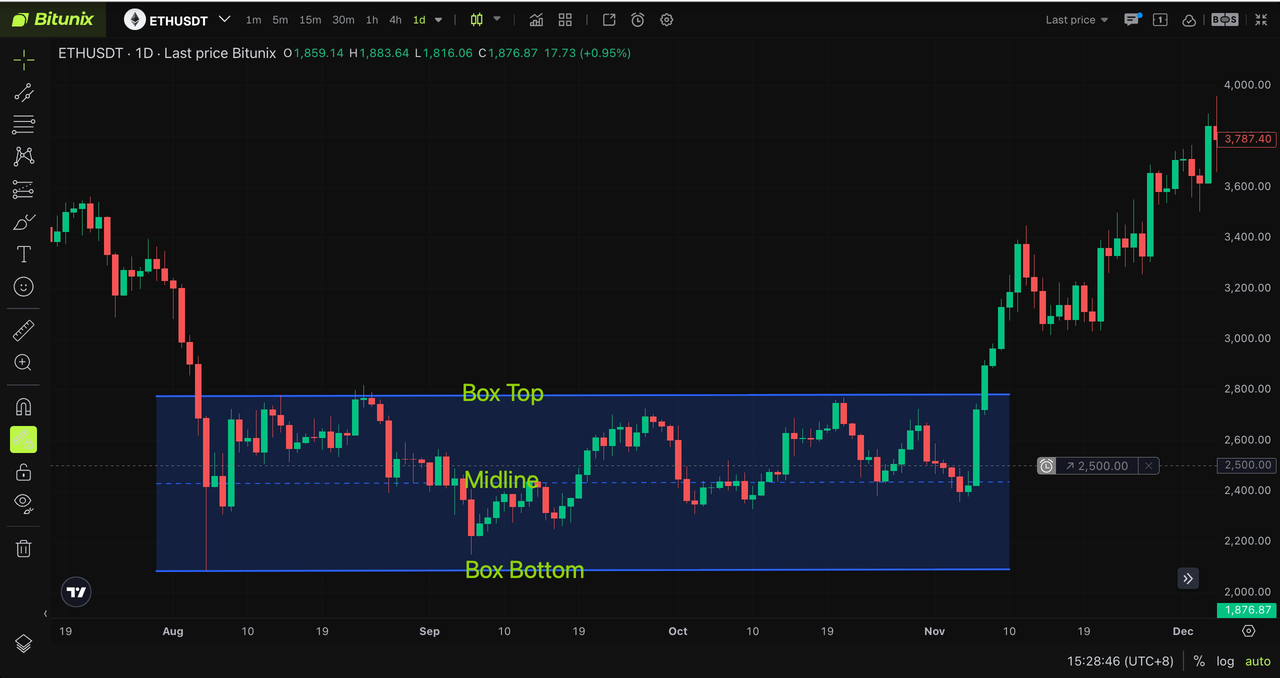
The K-line Box Pattern is a technical analysis tool used to identify periods of price consolidation.
A box is formed when price repeatedly fluctuates between a clearly defined resistance level (upper boundary) and support level (lower boundary) over an extended period.
In simple terms, the market moves sideways within a horizontal range, creating a “box” structure.
The upper boundary acts as resistance and limits upward price movement, while the lower boundary acts as support and prevents further declines. Until either level is decisively broken, price remains trapped within the range.
Components of a Box Structure
Upper Boundary (Box Resistance)
The upper boundary is formed by connecting multiple swing highs where price repeatedly encounters selling pressure.
When price approaches the upper boundary, sellers often become more active, making it difficult for buyers to push the market higher.
The more times resistance is tested without being broken, the stronger and more significant the resistance level becomes.
Lower Boundary (Box Support)
The lower boundary is formed by connecting multiple swing lows where buyers consistently step in to support the market.
When price declines toward the lower boundary, bearish momentum often weakens and buying interest increases.
The more frequently support is tested and successfully defended, the stronger the support level becomes.
Midline (Equilibrium Zone)
The midline is drawn halfway between the upper and lower boundaries of the box.
It represents the market’s equilibrium zone, where bullish and bearish forces are relatively balanced.
Since market direction is often unclear near the midline, traders generally avoid initiating new positions in this area.
Breakout Zone
A breakout occurs when price closes decisively above the upper boundary or below the lower boundary of the box.
This signals that the consolidation phase has ended and that a new directional trend may be developing.
Breakouts often provide the highest-probability trend-following opportunities.
Complete Box Trading Rules
Example: (UTC + 8)
Multi-Timeframe Analysis
The recommended approach is:
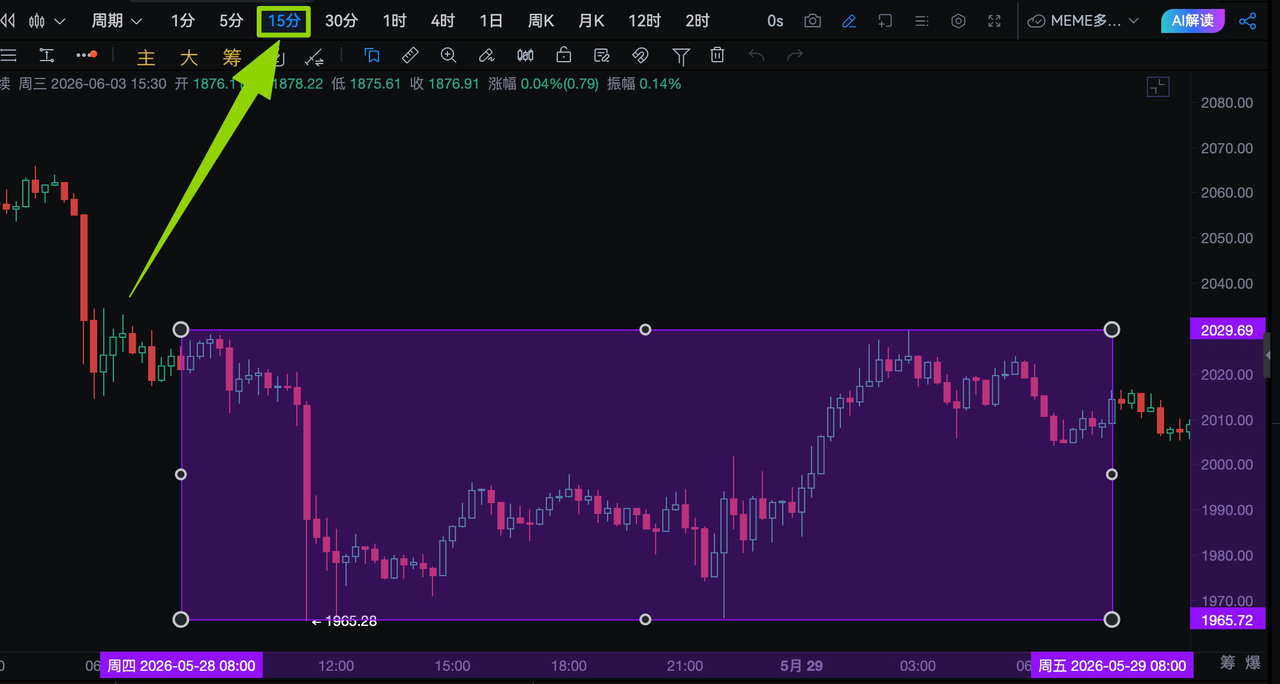
Use the Daily timeframe to identify the box structure.
Use the 15-minute timeframe to refine entries and exits.
This method combines higher-timeframe trend analysis with lower-timeframe precision entries.
Drawing the Box
At the start of each trading session:
Identify the highest price within the consolidation range.
Identify the lowest price within the consolidation range.
Draw the upper and lower boundaries.
Draw the midline at the center of the box.
These levels serve as the primary decision-making framework for the trading day.
Timeframe Switching
After establishing the box on the Daily chart, switch to the 15-minute chart to monitor intraday price action and identify trading opportunities.
Trading Direction Rules
Short Positions Near Resistance
When price approaches the upper boundary of the box:
Selling pressure is expected to increase.
Look for bearish rejection signals.
Consider short positions after confirmation.
Long Positions Near Support
When price approaches the lower boundary of the box:
Buying pressure is expected to increase.
Look for bullish reversal signals.
Consider long positions after confirmation.
Avoid Trading Near the Midline
When price trades near the center of the box:
Market direction is unclear.
Bullish and bearish forces are balanced.
Risk-to-reward conditions are generally unfavorable.
Avoid opening new positions in this area.
Purpose of the Midline
The midline serves as a reference point for measuring market strength rather than a direct trading signal.
Because neither side has a clear advantage near the midpoint, this area is generally considered a no-trade zone.
Breakout Confirmation Rules
When price tests either boundary of the box:
Wait for a strong breakout candle.
Confirm the breakout with the next 15-minute candle.
Verify that volume supports the breakout.
If the breakout is confirmed, abandon the range-trading strategy and switch to a trend-following approach.
If the breakout fails, continue trading the range by selling near resistance and buying near support.
Two Core Box Trading Strategies

Range Trading Strategy (Buy Support, Sell Resistance)
This strategy is designed for markets that remain within the box without producing a valid breakout.
Long Setup
Enter a long position when:
Price reaches the lower boundary.
Bullish reversal candlestick patterns appear.
Selling momentum weakens.
Volume declines during the sell-off.
Examples include:
Doji
Hammer
Bullish reversal candle
Short Setup
Enter a short position when:
Price reaches the upper boundary.
Bearish reversal candlestick patterns appear.
Buying momentum weakens.
Volume increases during rejection.
Examples include:
Shooting Star
Bearish Engulfing
Long upper wick rejection
Breakout Trading Strategy (Trend Following)
A breakout signals that market equilibrium has been disrupted and a directional trend may be beginning.
This strategy is better suited for experienced traders seeking larger trend moves.
Bullish Breakout
Enter a long position when:
Price closes above the upper boundary.
Trading volume increases significantly.
The breakout is confirmed by subsequent candles.
This indicates buyers have gained control and an uptrend may be developing.
Bearish Breakout
Enter a short position when:
Price closes below the lower boundary.
Selling volume increases significantly.
The breakout is confirmed by subsequent candles.
This indicates sellers have gained control and a downtrend may be developing.
Practical Example
1. RIVER/USDT Perpetual Futures (Daily + 15-Minute Multi-Timeframe Analysis) ✅
1、Box Structure Definition
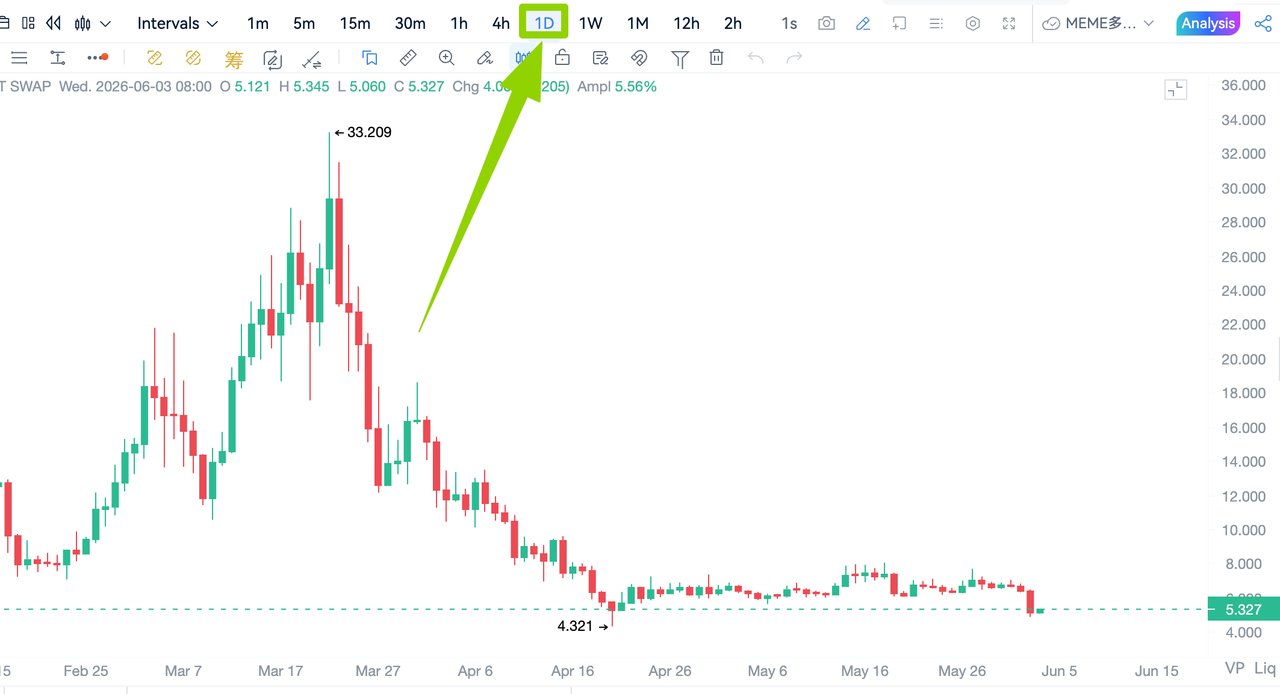
From the daily chart, RIVER/USDT has been in a long-term downtrend since reaching a peak of 33.209. The price subsequently declined to a low of 4.321 before entering a period of consolidation, while the overall market structure remained bearish.
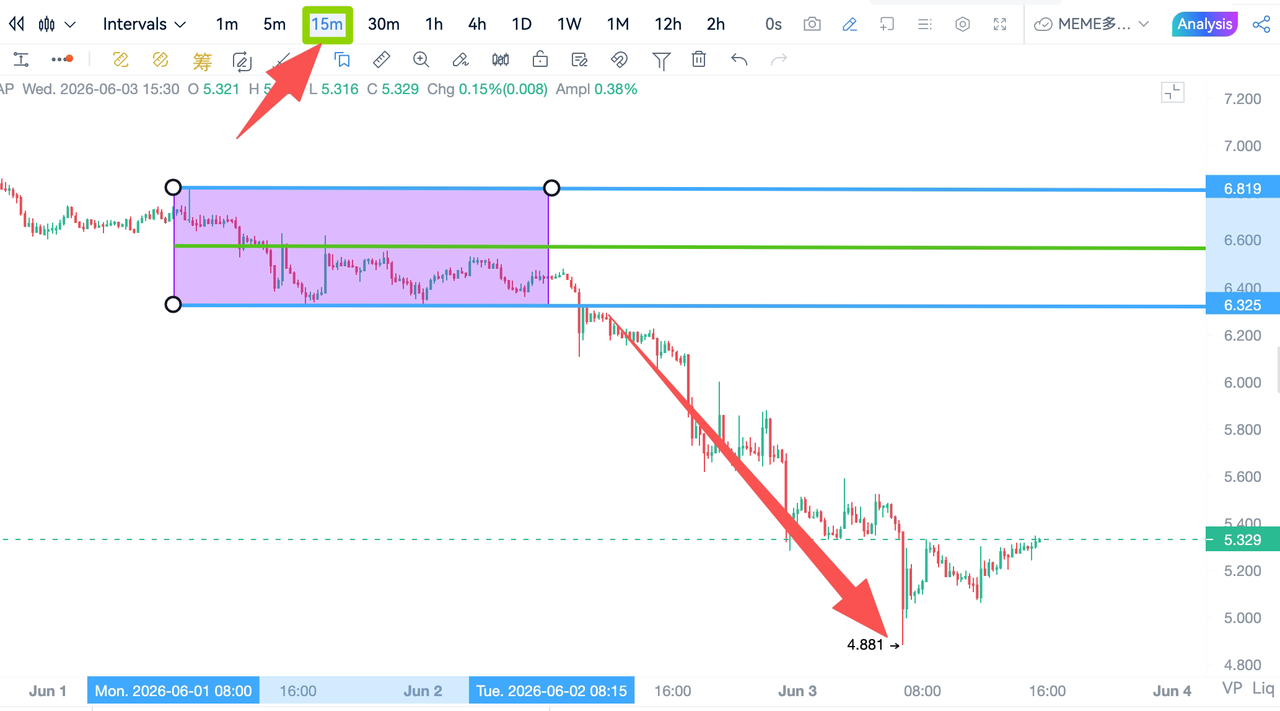
On the 15-minute timeframe, a consolidation box can be identified:
Upper Boundary (Resistance): 6.819
Lower Boundary (Support): 6.325
Midline: Green horizontal line
Between June 1, 08:00 and June 2, 08:00 (UTC+8), price traded sideways within the range. The subsequent breakdown below the lower boundary confirmed a bearish breakout. The former support level then became a resistance level, forming a valid bearish box-breakout structure.
2、Breakout Confirmation and Entry Conditions
After price broke below the box support at 6.325, traders should monitor whether the bearish breakout is valid.
The key confirmation criterion is:
Two consecutive 15-minute candlesticks fail to close back above 6.325.
Once this condition is met, the bearish breakout is confirmed and a short-selling opportunity becomes valid.
At this stage, traders may consider setting price alerts and looking for short-entry opportunities on pullbacks toward the breakout level.
3、Short Position Setup
After the breakout is confirmed, traders can look for short positions when price retests the former support level near 6.3, which has now become resistance.
This approach allows traders to participate in the prevailing downtrend while maintaining a favorable risk-to-reward ratio.
4、Take-Profit and Stop-Loss Rules
Take-Profit Rules
First Profit Target (Measured Move Target)
Measure the height of the box.
Project the same distance downward from the breakout point.
Use this level as the initial take-profit target.
Consider closing 50% of the position when the first target is reached.
Second Profit Target (Extended Target)
If bearish momentum remains strong:
Project an additional box height below the first target.
Use this as the secondary profit target.
Close the remaining position as the target is reached.
Trend-Based Profit Management
For longer-term trades:
Use the Daily EMA30 as a trend filter.
Maintain short positions while price remains below the EMA30.
Exit remaining positions if price closes decisively above the EMA30, signaling a potential trend reversal.
Stop-Loss Rules
Short Position Stop-Loss
The bearish breakout becomes invalid if:
Two consecutive 15-minute candlesticks close above 6.4.
In this case:
The breakout structure is considered failed.
Former support and resistance levels revert to their original roles.
All short positions should be closed immediately according to the stop-loss plan.
This rule helps protect capital and prevents losses from expanding during false breakdowns.
2. ETH/USDT Perpetual Futures (Daily Timeframe) ✅
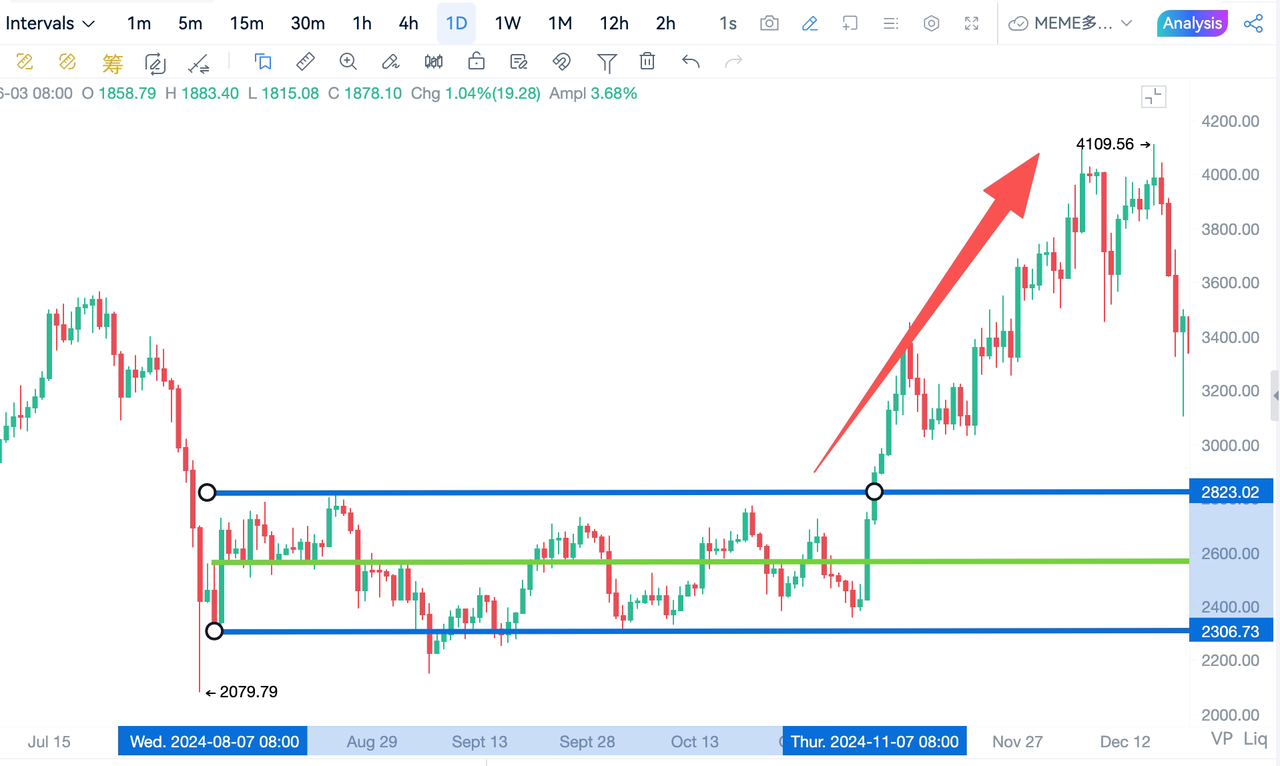
1. Box Structure Definition
From the daily chart, ETH/USDT experienced a sharp decline and established a major low at 2,079.79 before entering a prolonged consolidation phase. Price subsequently traded within a horizontal range for nearly three months before eventually breaking out to the upside.
The box structure can be defined as follows:
Lower Boundary (Support): 2,300
Midline (Equilibrium Zone): 2,600
Upper Boundary (Resistance): 2,800
The rising swing lows within the consolidation range indicated weakening selling pressure and gradually increasing bullish momentum, resulting in the formation of a well-defined box pattern.
2. Pullback Entry Conditions
When price retraces toward the 2,360-2,400 support zone above the lower boundary, traders should monitor for signs of bullish exhaustion and stabilization, including:
Bullish reversal candlestick formations
Decreasing selling volume
Failure of bears to push price lower
Support holding successfully
These signals suggest bearish momentum is weakening and that buyers may be regaining control.
3. Scaling Into Long Positions
Using the box structure as the primary support framework, traders may consider scaling into long positions at key support levels.
Potential accumulation zones include:
2,360
2,400
2,450
2,500
Scaling entries across multiple support levels helps improve average entry price while reducing timing risk.
4. Bullish Breakout Confirmation
The bullish breakout is confirmed when:
Price closes decisively above the upper boundary at 2,800
Trading volume increases significantly
Subsequent candles hold above the breakout level
Once the breakout occurs, the original consolidation range is no longer valid, and the market transitions into a bullish trend.
In this example, ETH rallied to a high of 4,109.56, demonstrating the substantial profit potential of a successful box-breakout strategy.
5. Take-Profit and Stop-Loss Rules
Take-Profit Rules
First Profit Target (Measured Move Projection)
Calculate the height of the box.
Project the same distance upward from the breakout point.
Use this level as the initial take-profit target.
Consider closing 50% of the position at this target.
Second Profit Target (Extended Projection)
If bullish momentum remains strong:
Project an additional box height above the first target.
Use this as the second profit target.
Close the remaining position as the target is reached.
Trend-Based Profit Management
For longer-term positions:
Use the Daily EMA30 as a trend-management tool.
Continue holding long positions while price remains above the EMA30.
Exit remaining positions if price closes decisively below the EMA30, signaling potential trend weakness or reversal.
Stop-Loss Rules
Long Position Stop-Loss
The bullish setup becomes invalid if:
Two consecutive 15-minute candlesticks close below the 2,300 support level.
If this occurs:
The support structure is considered broken.
The box setup is invalidated.
All long positions should be closed according to the predefined stop-loss plan.
This rule helps protect capital during failed support tests or false bullish signals.
Common Pitfalls in Box Trading
1. Prioritize Higher Timeframes
Higher-timeframe box structures such as the Daily and 4-Hour charts carry significantly greater weight than lower-timeframe structures.
If a lower-timeframe breakout occurs while the higher timeframe remains range-bound, the breakout is often false.
Always align trades with the dominant higher-timeframe structure whenever possible.
2. Avoid Overtrading
Not every consolidation range offers a high-quality trading opportunity.
Boxes with:
Extremely narrow ranges
Choppy price action
Frequent whipsaws
often generate poor risk-to-reward setups.
Focus on clean, well-defined box structures and avoid forcing trades.
3. Volume Is Critical for Breakout Confirmation
Many false breakouts occur because traders ignore volume.
A valid breakout should generally include:
Increased trading volume
Strong candlestick closes outside the box
Sustained follow-through after the breakout
Breakouts without volume confirmation are more likely to fail and trap traders.
4. Trade With the Trend
Trend alignment significantly improves trading performance.
In a Downtrend
Short positions near resistance are generally preferred.
Bearish breakdowns have a higher probability of success.
In an Uptrend
Long positions near support are generally preferred.
Bullish breakouts have a higher probability of success.
Attempting to trade against the dominant trend is one of the most common causes of losses when using box-trading strategies.