1.Bitcoin ETF data fundamentals
What is a Bitcoin spot ETF?
A Bitcoin Exchange Traded Fund (ETF) is a financial product that gives investors exposure to the Bitcoin market through a traditional securities account. Instead of buying and holding Bitcoin directly, investors buy shares of the ETF on a stock exchange.
The core idea is to convert Bitcoin exposure into standardized securities shares. This lets investors participate in the cryptocurrency market through their regular brokerage accounts, while reducing operational barriers such as private key management and wallet security.
Depending on the product design, a Bitcoin ETF may hold spot Bitcoin or track its price using other instruments. In this article, we focus on Bitcoin spot ETFs displayed on Coinglass.
2.Steps to View Bitcoin Spot ETFs on Coinglass
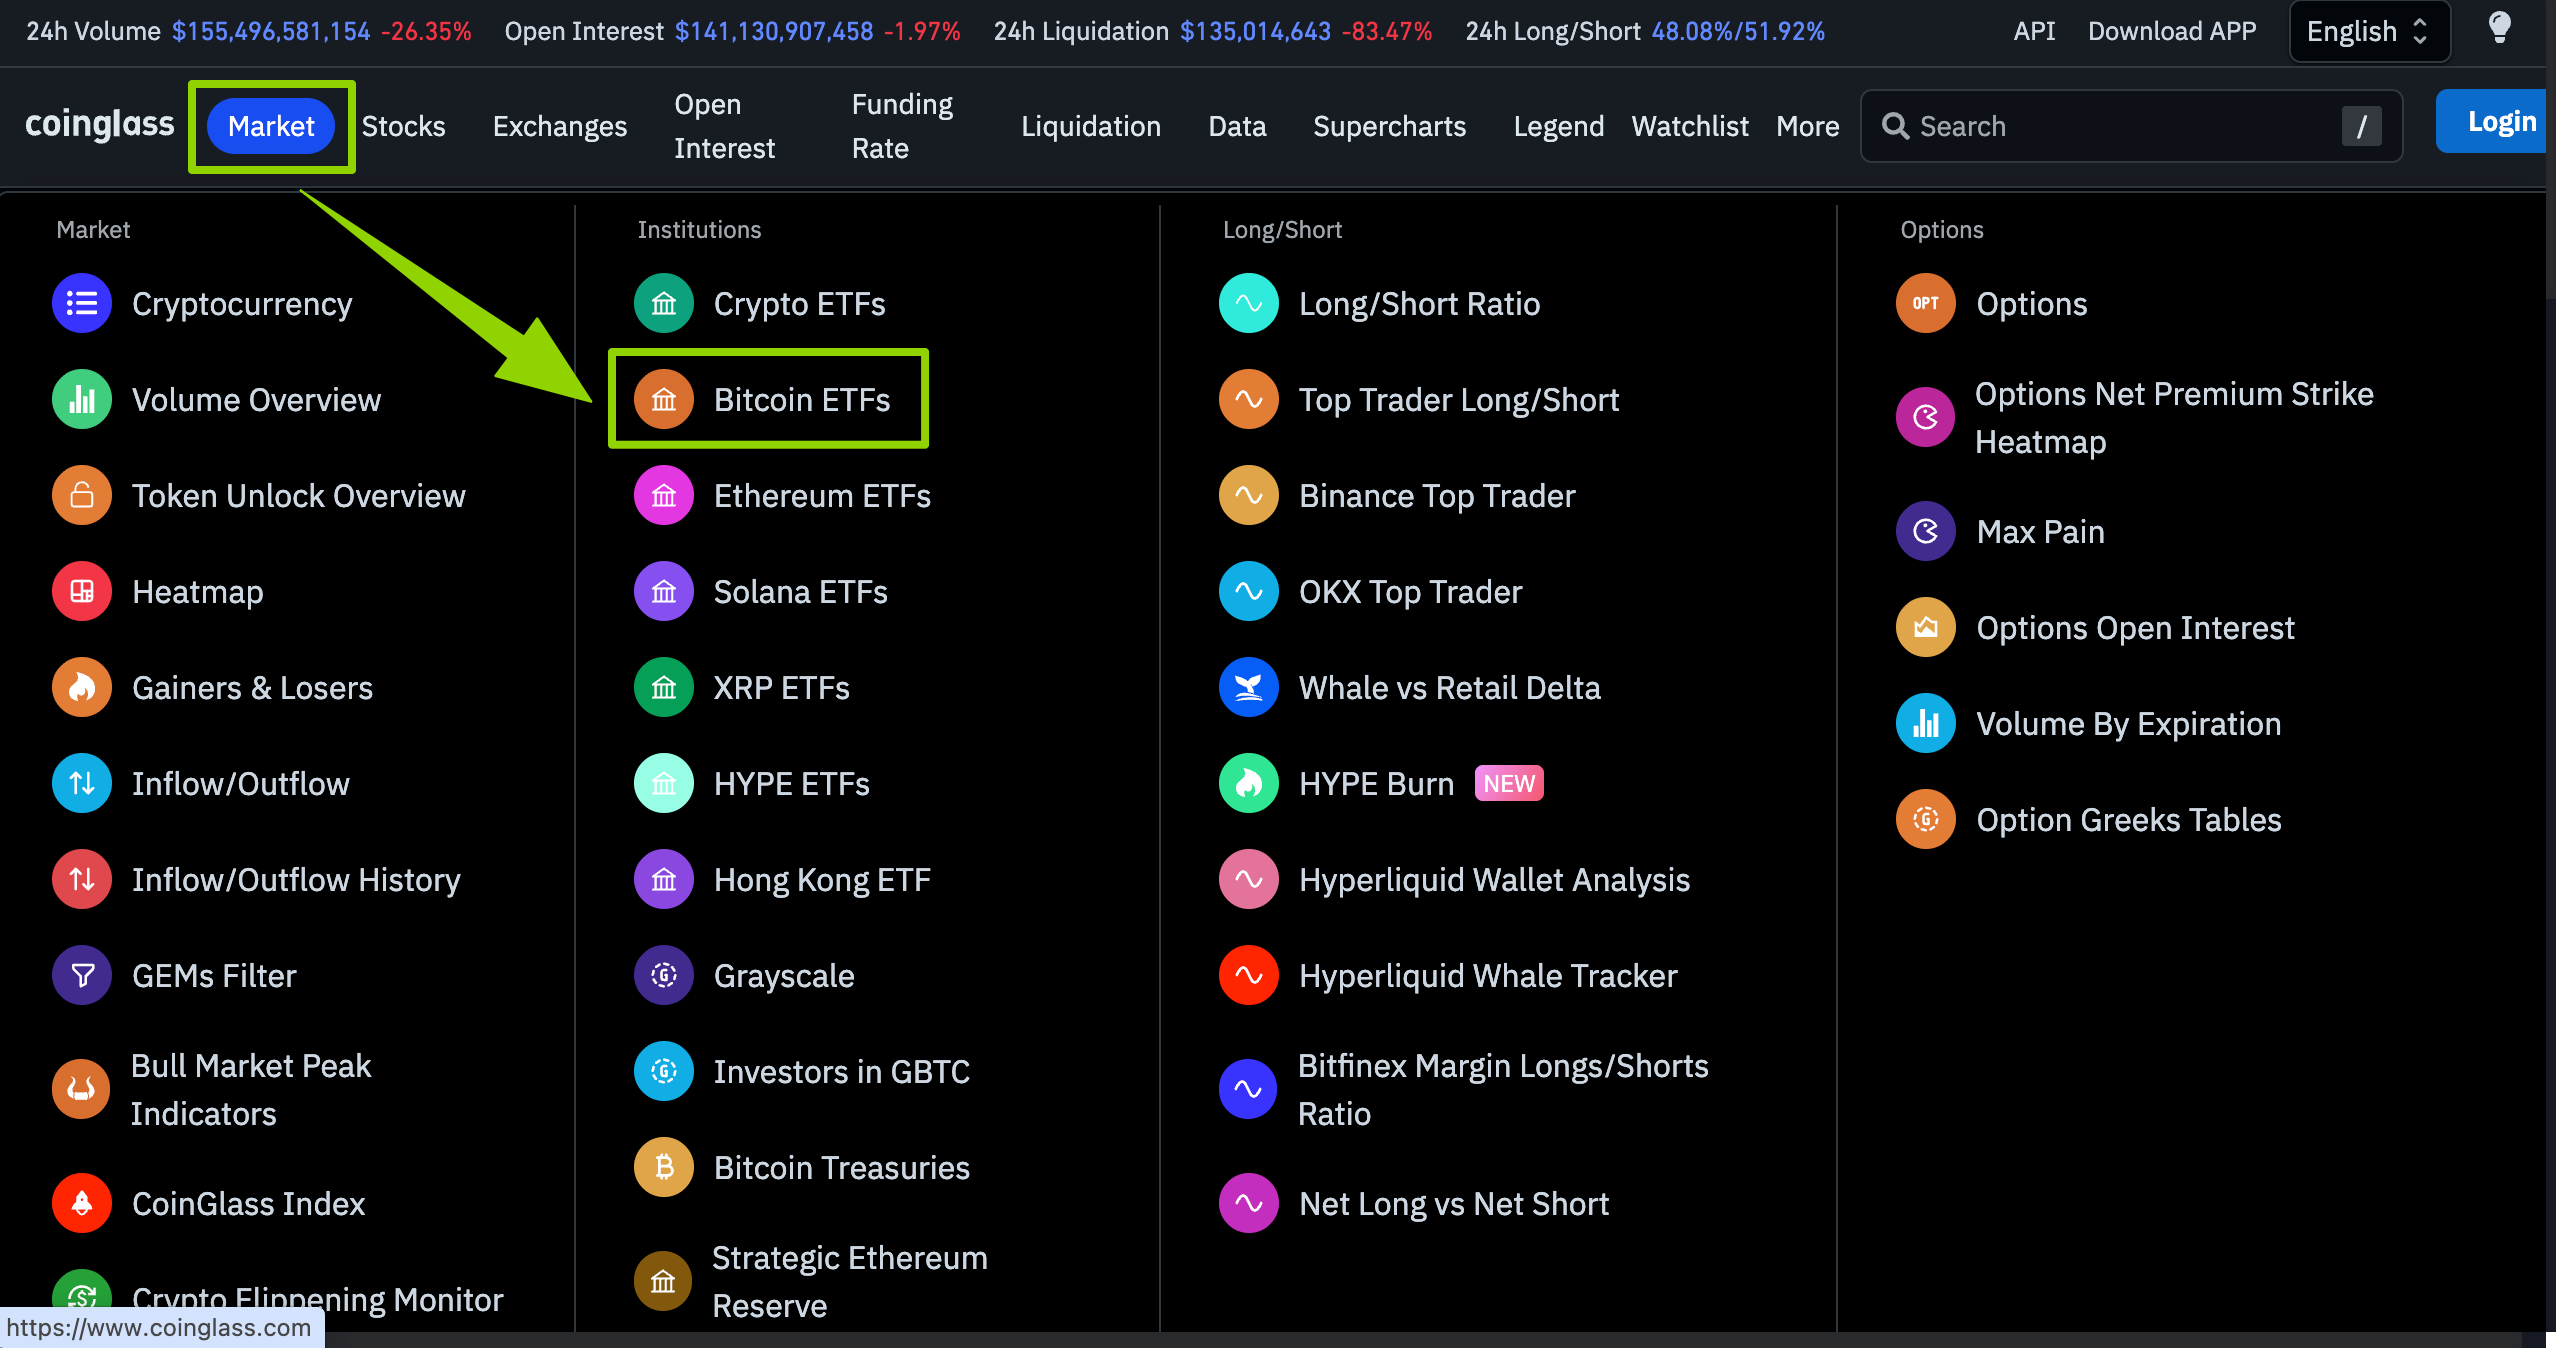
Open your browser and go to Coinglass.com.
In the top navigation bar, click Market.
In the left column under Market, select Bitcoin ETFs.
3.Net Inflows and Outflows Through Bitcoin Spot ETFs (BTC): Reading Market Trends
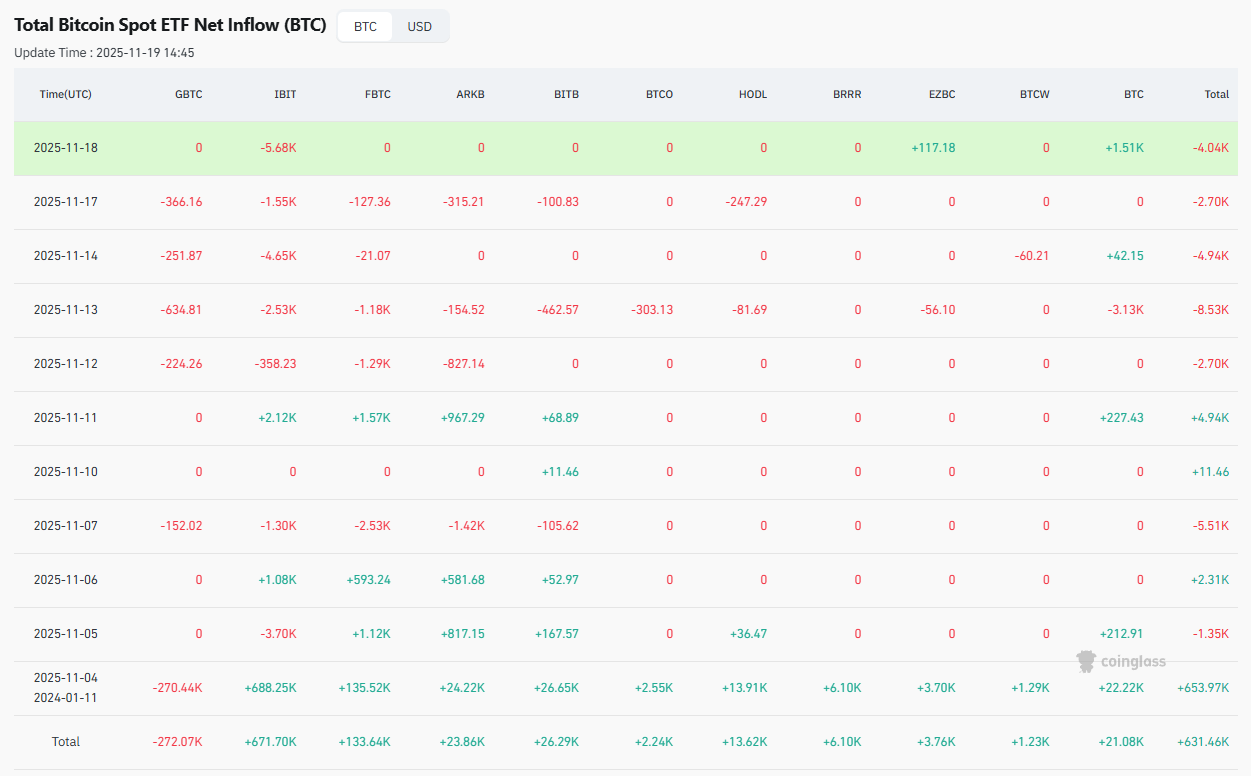
From the recent net inflow and outflow data of Bitcoin's spot ETFs, we can draw the following conclusion.
Overall, Bitcoin spot ETFs have recently shown a sustained net outflow of funds. This continuous capital is likely to put downwards pressure on both the BTC spot market and BTC futures.
Apart from a single large net inflow of roughly +660.57K BTC on 4 November 2025, most other trading days in November show clear net outflows. Sometimes amounting to several thousand BTC in a single day.
Persistent redemptions from spot ETFs increase selling pressure in the Bitcoin spot market and weigh on spot prices. At the same time, spot market sentiment is transmitted to the futures market, which changes the balance between long and short positions and can lead to:
Pressure on Bitcoin futures prices
Adjustments in position structures
Larger price swings in both perpetual and dated futures
This pattern often results in an overall bearish impact on the BTC futures market.
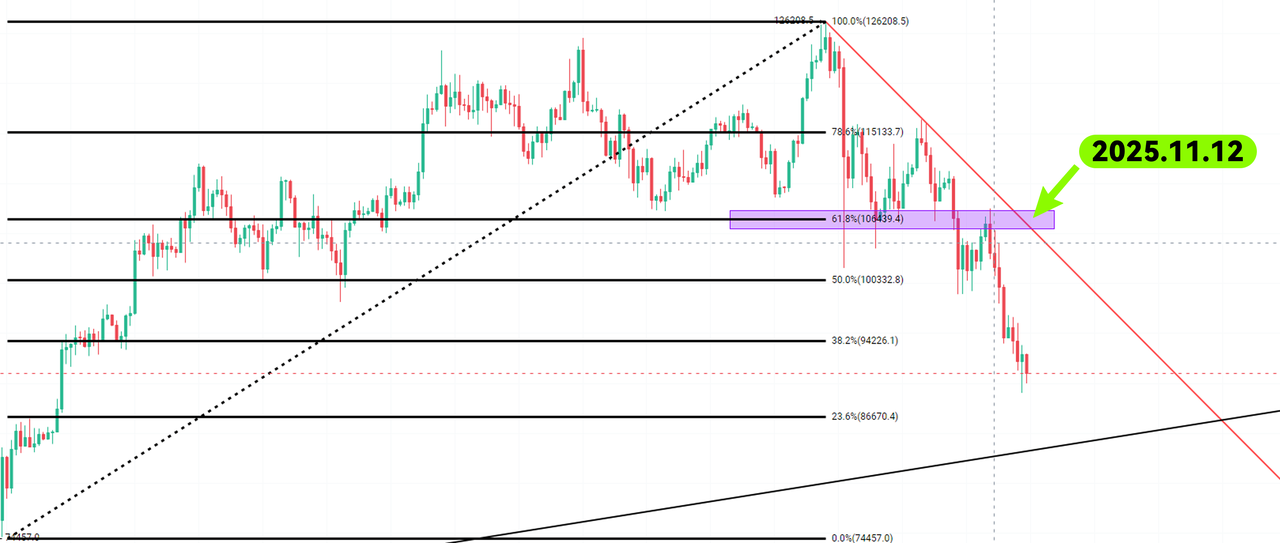
Combined with Market Trend Chart Confirmation
The daily Bitcoin chart above shows price touching the resistance zone around the 61.8 percent Fibonacci retracement level on 11 October, then reversing sharply lower. At the same time, the previous support zone flipped into resistance, creating a clear resistance band.
Bitcoin spot ETF data in the table also shows a concentrated wave of redemptions starting from 12 November. This continuous selling pressure has driven a clear structural downturn in the daily chart.
The key takeaway is that Bitcoin spot ETF inflows and outflows move largely in line with the broader Bitcoin futures trend and exert a meaningful influence on futures prices.
3.Confirming the Market Trend with Bitcoin Spot ETF Net Flows (USD)
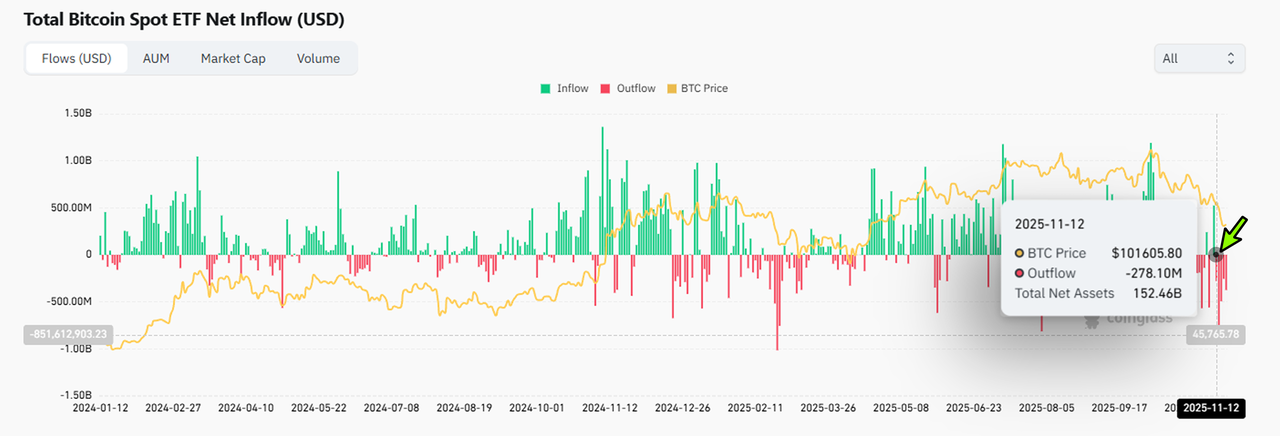
By analyzing the net inflows and outflows of Bitcoin spot ETFs in USD, we can further verify the current market trend. The data shows that ETF flow is closely correlated with Bitcoin price movements.
For example, on 12 November 2025, when Bitcoin was trading around 101,605.80 USD, Bitcoin spot ETFs recorded a net outflow of approximately 278.10 million USD, while total net assets stood at about 152.46 billion USD. This large wave of redemptions coincided with a clear weakening in price, reinforcing the view that sustained outflows tend to accompany or accelerate market declines.
This correlation between ETF capital flows and price action provides an additional tool for confirming trend direction and judging market conditions.
How to Read ETF Flow Data
The flow of funds through Bitcoin spot ETFs is a direct reflection of institutional sentiment and large-capital positioning.
Net inflows usually indicate that institutions and large investors are increasing long exposure. These flows provide buying support and can help stabilize or lift the market.
Net outflows usually indicate that institutions and large investors are making profits, reducing positions, or hedging. This removes buying support, increases selling pressure and can weigh on the market.
For traders, ETF flow data is a key capital-side indicator. When combined with technical factors such as trend lines, support and resistance levels, it can significantly improve the accuracy of market analysis and trading decisions.
4.How Traders Develop Contract Strategies (Combining Fundamental and Technical Fundamentals):
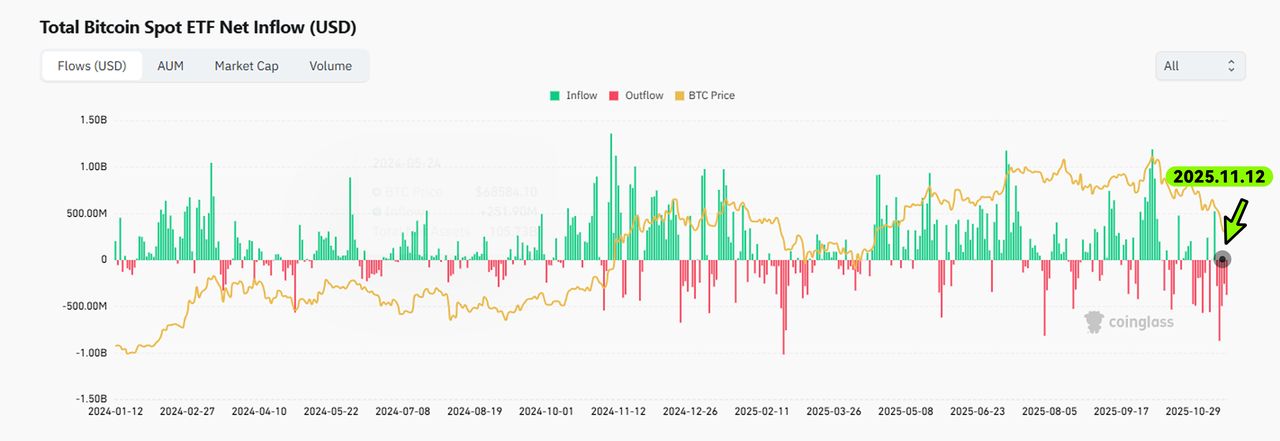
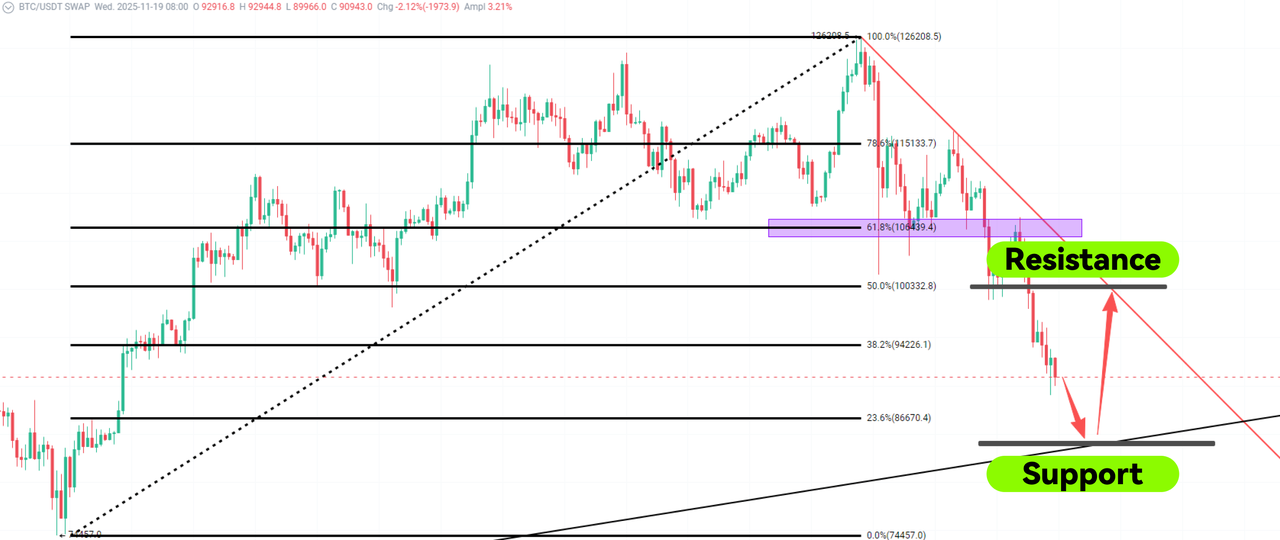
Judging the BTC Example in the Chart Above
Identifying risk and opportunity in a bearish trend
If net outflows of Bitcoin spot ETF funds continue to expand, it indicates that bearish pressure remains strong. Traders should stay alert to the risk of further downsides. During this stage, it is usually safer to stay on the sidelines or consider short positions only after clear technical confirmation.
Once the price breaks below the major daily black uptrend line with continued ETF net outflows, this often signals a new wave of downward trends. In such a scenario, short positions can be considered in line with the prevailing trend.
If the price tests the support of the major daily black trend line and ETF net outflows shrink significantly, or even flip back to a small net inflow, this suggests that support is holding and selling pressure is easing. In this case, a rebound from support combined with improving fund flows can justify trying a small, tactical long position.
Verifying resistance during rebounds
When the market rebounds toward the upper daily red downtrend line (resistance), ETF flows become an important confirmation signal:
If ETF flows switch from net inflow back to net outflow when price retests this resistance zone, it suggests that the resistance is effective and that the market is likely to resume its decline. Traders should consider taking profits on long positions and may look for opportunities to open or add short positions.
If ETF flows remain in net inflow while price is testing resistance, long positions can be held in combination with strong technical signals. However, traders should be cautious of false breakouts and set clear stop-loss levels.
Putting ETF flows and technicals together
In practice, Bitcoin spot ETF fund flows act as a “weathervane” for institutional capital. When combined with support and resistance levels and key trend lines, ETF data helps traders:
Identify where trends may continue or reverse
Refine entry and exit timing
Build more structured futures strategies
The same approach can be applied not only to BTC, but also to other assets that have spot ETFs, such as ETH, SOL and others, in order to design corresponding futures or derivatives strategies.
Risk Warning
Coinglass Bitcoin ETF data can help traders and beginners develop a macro view of market sentiment and capital flows. However, data is only one decision-making tool and should not be treated as a standalone basis for trading. The cryptocurrency market is highly volatile and uncertain. Effective risk management, position sizing and discipline are essential to navigating market swings.