Bitcoin and the U.S. stock market often move in the same direction, but their relationship is neither constant nor guaranteed. When investors become more cautious about economic growth, interest rates or financial conditions, both Bitcoin and equities can face selling pressure. Yet Bitcoin can also outperform stocks during an equity downturn or respond to crypto-specific developments that have little effect on traditional markets.
The key to understanding Bitcoin stock market correlation is to look beyond whether prices rise or fall together. The strength of the relationship depends on the period measured, the forces driving the market and how investors position their portfolios. The S&P 500 and Nasdaq-100 provide useful benchmarks, while Treasury yields, the U.S. dollar, institutional flows and crypto-market leverage help explain why Bitcoin sometimes follows stocks and sometimes diverges.
What Is the Correlation Between Bitcoin and the U.S. Stock Market?
Bitcoin stock market correlation measures how closely Bitcoin returns move in relation to stock-market returns over a specified period. Analysts commonly compare BTC with the S&P 500, which represents a broad segment of the U.S. equity market, and the Nasdaq-100, which has substantial exposure to large non-financial technology and growth companies.
Correlation is measured on a scale from -1 to +1:
Correlation | Meaning | What it suggests for Bitcoin and stocks |
Close to +1 | Strong positive correlation | BTC and equities tend to move in the same direction. |
Close to 0 | Little linear correlation | Their returns show little consistent linear relationship over the measured period. |
Close to -1 | Strong negative correlation | BTC tends to move in the opposite direction to equities. |
A correlation near zero does not mean two assets never move together. They may react similarly during some events and diverge during others, producing a low average relationship across the full measurement window.
It is also important to distinguish correlation from causation. A decline in the S&P 500 does not, by itself, cause Bitcoin to fall. Both assets may be responding to a third factor, such as tighter financial conditions, or to different factors that happen to produce the same price direction.
Research published by CME Group in 2025 examined Bitcoin's relationship with major equity indices and found that the strength of the relationship varied across time. Its historical analysis supports treating correlation as a changing market condition rather than a fixed property of Bitcoin.
Is Bitcoin Correlated With the S&P 500 or Nasdaq-100?
Both indices are useful, but they answer slightly different questions.
The S&P 500 provides a broad view of U.S. large-cap equities. Comparing BTC with the index helps assess whether Bitcoin is moving alongside general equity-market sentiment.
The Nasdaq-100 offers a more concentrated view of large growth-oriented and technology-related companies. It can be particularly useful when evaluating periods dominated by changes in technology valuations, AI investment expectations or demand for growth assets.
Neither index is a perfect proxy for Bitcoin. BTC trades continuously, including weekends, while U.S. stock markets follow defined trading hours. Differences in trading hours, return frequency, index composition and calculation windows can affect measured correlation.
For a more meaningful comparison, use consistent daily or weekly return intervals and specify the period. A 30-day rolling correlation may tell a different story from a 90-day or one-year measurement.
Why Bitcoin and U.S. Stocks Sometimes Fall Together
Bitcoin and equities can sell off simultaneously because investors respond to the same macroeconomic pressures or reduce exposure to assets they perceive as risky. Several mechanisms can contribute to this behavior.
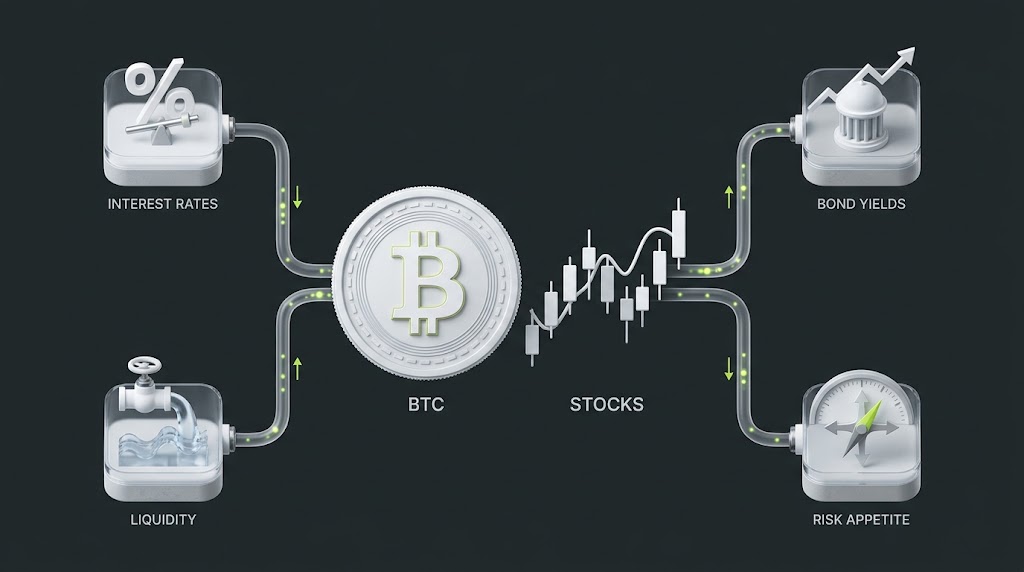
Interest rates, Treasury yields, and market liquidity can influence both Bitcoin and U.S. equities.
Interest Rates, Treasury Yields and Financial Conditions
Interest rates influence borrowing costs, asset valuations and the relative attractiveness of different investments. When Treasury yields rise because markets expect tighter monetary policy or persistently high inflation, financial conditions may become less supportive of risk-taking.
Higher yields can make interest-bearing assets more attractive relative to assets that do not generate contractual income, including Bitcoin. They can also raise the discount rates applied to future corporate earnings, putting pressure on equity valuations, particularly for growth-oriented companies.
The relationship is not mechanical. Rising Treasury yields can reflect stronger growth expectations rather than monetary tightening, and different parts of the yield curve can move for different reasons. Bitcoin's reaction therefore depends on what is driving yields higher, how markets have priced in that development and whether the U.S. dollar strengthens at the same time.
Risk Appetite and Institutional Portfolio Flows
During periods of economic uncertainty, investors may reduce exposure to multiple asset classes at once. Funds facing portfolio risk limits, margin requirements or redemption pressure may sell liquid holdings, including equities and Bitcoin.
Institutional participation can strengthen these connections. Investors who trade BTC alongside equities, exchange-traded funds or other liquid assets may respond to the same portfolio constraints and market signals.
The introduction and growth of U.S. spot Bitcoin exchange-traded funds have also made BTC exposure more accessible through traditional investment accounts. This expands the ways in which Bitcoin can be incorporated into diversified portfolios, although ETF participation alone does not prove that Bitcoin must become more correlated with stocks.
Leverage, Liquidations and Market Liquidity
Leverage can amplify a decline after selling pressure begins.
In crypto derivatives markets, traders who use borrowed funds or leveraged positions may be forced to close positions when prices move against them. These liquidations can generate additional market orders, push prices further and trigger further liquidations.
A similar reduction in risk can occur across traditional markets when volatility rises or portfolio limits are breached. If investors reduce leverage across both equities and crypto, selling pressure can spread across asset classes even when the initial catalyst originates in only one market.
Bitcoin's continuous trading and crypto-specific liquidation mechanisms can make its short-term price action more volatile than that of major equity indices. Simultaneous declines may therefore reflect a combination of shared macroeconomic pressure and different market structures.
How Bitcoin's Correlation With Stocks Has Changed Over Time
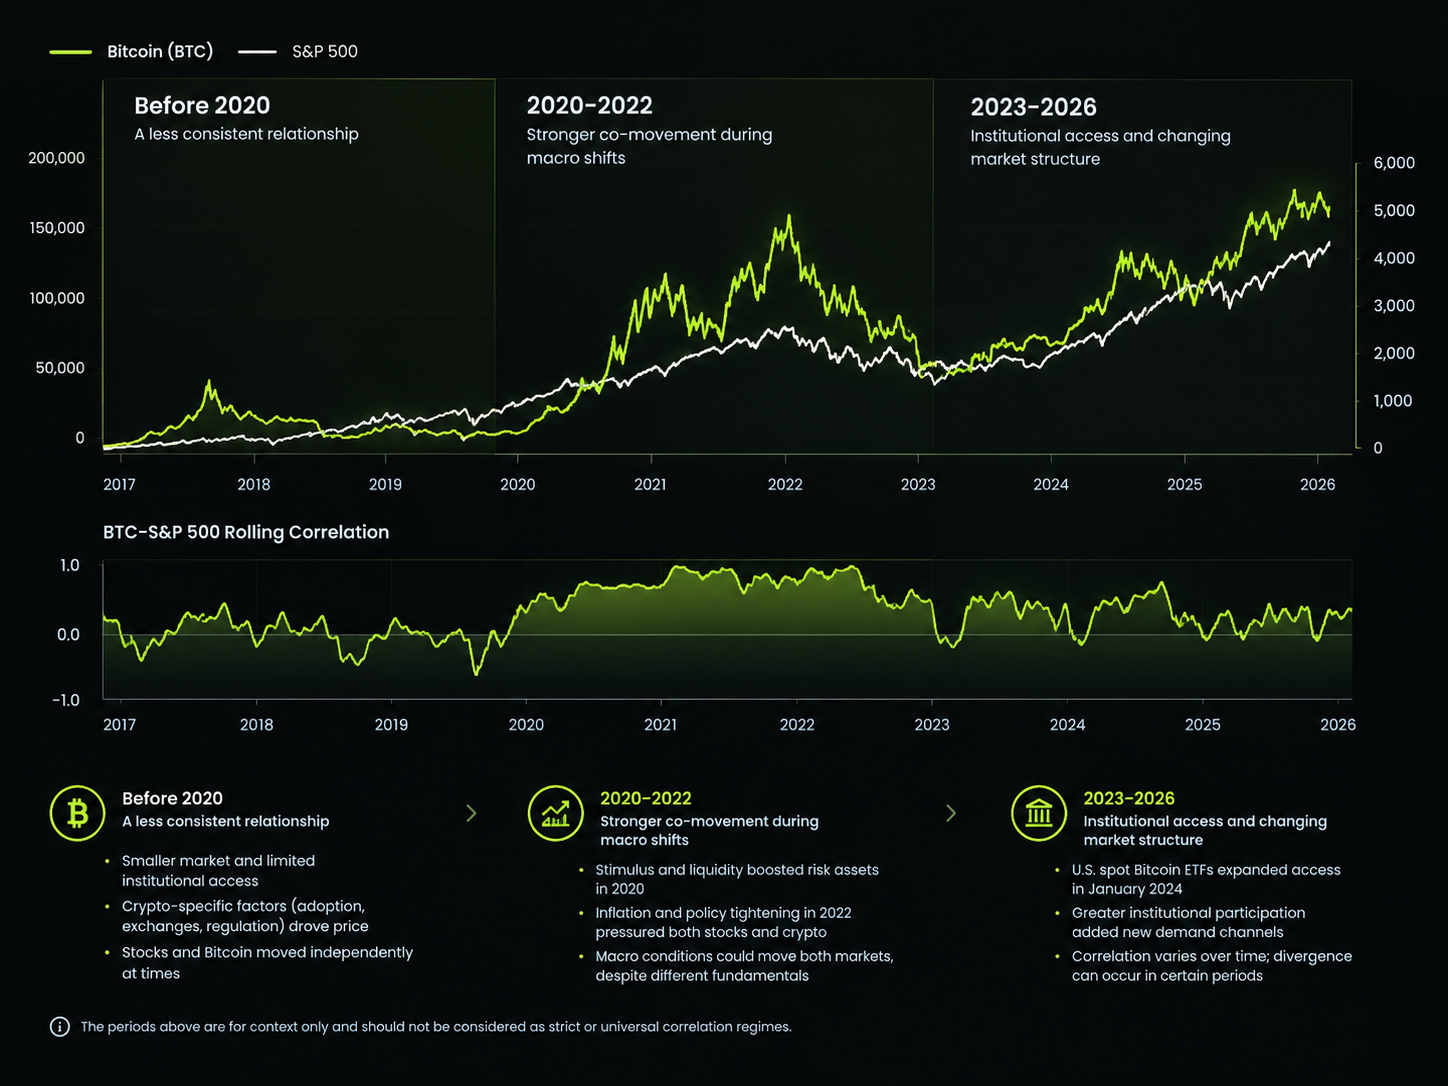
Bitcoin's correlation with the S&P 500 changes over time as market conditions and investor behavior evolve.
Bitcoin's relationship with U.S. equities has evolved as the crypto market has matured, institutional access has expanded and macroeconomic conditions have changed. The following periods provide useful context, but they should not be interpreted as sharply defined or universal correlation regimes.
Before 2020: A Less Consistent Relationship
In Bitcoin's earlier years, its relatively small market, limited institutional access and crypto-specific trading activity meant that its price could be driven by factors with little direct connection to U.S. equities.
Adoption expectations, exchange developments, regulatory announcements and changes in crypto-market liquidity often played a central role. Bitcoin could still react to global risk sentiment, but its relationship with stocks was less consistent across many historical windows.
This does not mean Bitcoin was completely independent of traditional markets. It means that the relationship varied with market conditions and the sample period being examined.
2020–2022: Stronger Co-Movement During Macro Shifts
The pandemic period and subsequent monetary-policy changes highlighted how Bitcoin could behave like a risk-sensitive asset.
In 2020, monetary and fiscal stimulus supported financial markets, while abundant liquidity and growing investor participation helped drive demand for a wide range of assets. Later, as inflation increased and central banks tightened policy in 2022, both equities and crypto assets faced pressure from changing financial conditions.
These episodes demonstrated how a common macroeconomic driver can influence assets with very different underlying characteristics. Bitcoin's fixed issuance schedule and decentralized network did not prevent its market price from responding to changes in liquidity and investor risk appetite.
2023–2026: Institutional Access and Changing Market Structure
The launch of U.S. spot Bitcoin ETFs in January 2024 expanded access to Bitcoin through traditional brokerage and investment platforms. Greater institutional participation created additional channels through which portfolio decisions and macroeconomic expectations could influence BTC demand.
However, greater access does not automatically produce a permanently stronger correlation with equities. Institutional investors can hold Bitcoin for different reasons, including diversification, long-term monetary-asset exposure or short-term trading.
Research published by CME Group in 2025 also highlighted changes in Bitcoin's relationship with equities over time. More recent analysis from Bitwise and other market researchers has shown that Bitcoin can diverge from U.S. stocks during particular periods, reinforcing the need to examine rolling data rather than rely on a single historical average.
What Industry Experts Say About Bitcoin and Stock Market Correlation
Recent research and industry commentary illustrate why Bitcoin's relationship with stocks remains contested. Some analysts emphasize its potential to diversify a traditional portfolio, while others caution that short periods of divergence may not represent a lasting structural change.
Robert Mitchnick, BlackRock: Bitcoin Can Act as a Portfolio Diversifier
In an August 2026 analysis, Robert Mitchnick, BlackRock's head of digital assets, argued that Bitcoin can exhibit a dual personality. It may trade alongside risk assets during broad deleveraging events but behave differently during other market disruptions.
Mitchnick pointed to periods when Bitcoin diverged from equities and argued that these episodes support its potential role as a portfolio diversifier. His assessment also distinguished crypto-specific selling pressure and changing investor flows from a fundamental change in Bitcoin's long-term investment case.
What it means: Bitcoin's short-term sensitivity to stocks does not necessarily define its behavior over longer investment horizons. However, the potential diversification benefit depends on the period measured, allocation size and portfolio risk, and it does not eliminate Bitcoin's substantial volatility.
André Dragosch, Bitwise: Bitcoin's Relationship With Equities Can Weaken
In a September 2, 2026 research memo, André Dragosch, head of research for Europe at Bitwise, reported that Bitcoin's 90-day rolling correlation with gold had reached its highest level since 2020. Over the same period, Bitcoin's correlation with the Nasdaq-100 had declined to a one-year low, according to Bitwise's analysis.
Dragosch argued that Bitcoin can trade more like a monetary or hard asset when macroeconomic concerns dominate, rather than behaving simply as a leveraged technology investment.
What it means: The assets most closely associated with Bitcoin can change as market priorities shift. A period of stronger BTC–gold correlation and weaker BTC–equity correlation does not prove that Bitcoin has permanently become a safe haven.
Glassnode Analysts: Short-Term Decoupling May Not Last
In reporting published by The Block on September 3, 2026, Glassnode analysts offered a more cautious interpretation of Bitcoin's divergence from U.S. equities. They noted that similar decoupling during previous bond-market sell-offs had often been short-lived, potentially reflecting temporary market conditions rather than a lasting change in the relationship.
The report also described Bitcoin's 30-day correlation with the S&P 500 falling toward zero during an August rally. That observation applied to a specific period and measurement window, not to Bitcoin's long-term correlation with equities.
What it means: A temporary break in correlation should be tested against subsequent market data. Investors should avoid treating a few weeks of independent price action as proof that Bitcoin will remain insulated from the next equity sell-off.
Taken together, these views point to a common conclusion: Bitcoin's relationship with stocks is conditional, not fixed. The useful question is not whether Bitcoin is always a risk asset or always a diversifier, but which market forces are dominating at a particular time.
Does Bitcoin Go Up When the Stock Market Goes Down?
Bitcoin does not have a reliable inverse relationship with the stock market. It can rise while equities fall, but that outcome depends on the reasons behind the sell-off and the factors supporting Bitcoin demand.
When Bitcoin May Fall With Stocks
Bitcoin may face downward pressure alongside equities when:
Investors reduce risk exposure: Broad selling can affect both crypto and stocks as investors cut positions.
Financial conditions tighten: Higher real yields, a stronger dollar or expectations of restrictive monetary policy can weigh on multiple risk-sensitive assets.
Leverage unwinds: Liquidations and margin pressure can accelerate selling across markets.
Institutional demand weakens: Reduced inflows into Bitcoin investment products or lower demand for crypto exposure can amplify broader market pressure.
These factors can reinforce one another, but none guarantees a particular BTC price move. For example, a rise in Treasury yields driven by stronger economic growth may produce a different market response from a rise driven by persistent inflation and tighter monetary policy.
When Bitcoin May Decouple From Equities
Bitcoin can outperform stocks during an equity sell-off when crypto-specific demand or a different macroeconomic narrative dominates.
Potential drivers include:
Stronger demand for spot Bitcoin ETFs or direct BTC exposure.
Bitcoin-specific developments that improve investor expectations.
A weaker U.S. dollar or changing concerns about government debt and currency purchasing power.
Differences in investor positioning, liquidity and selling pressure between crypto and equity markets.
A decoupling episode can be informative, but it should be assessed over multiple observation windows. Bitcoin rising for several days while stocks fall is not enough to establish a lasting negative correlation.
Which Stock Indices and Stocks Are Most Closely Related to Bitcoin?
The answer depends on the period, the measurement method and the stocks being compared. It is useful to distinguish broad equity indices, technology-heavy indices and individual companies with direct crypto exposure.
S&P 500 vs. Nasdaq-100
The S&P 500 is a useful benchmark for broad U.S. equity-market conditions, while the Nasdaq-100 can help capture movements in large growth-oriented and technology-related stocks.
CME Group's historical analysis found that Bitcoin's relationship with the S&P 500 and Nasdaq-100 became more positively correlated around 2020. The analysis also showed that the two indices exhibited similar patterns in their relationship with Bitcoin across the study period.
That does not mean the Nasdaq-100 will always be more closely correlated with BTC than the S&P 500. The result can change with the observation window and the factors driving each market.
Crypto-Related Stocks and Technology Stocks
Individual companies can provide additional context, but their exposure to Bitcoin differs substantially.
Bitcoin treasury companies: Their share prices may be affected by BTC holdings, financing structures, capital-raising decisions and the market's valuation of those holdings.
Crypto exchanges and trading platforms: Their performance can reflect trading activity, transaction revenue, regulatory developments and investor demand for crypto exposure.
Bitcoin miners: Their results depend on BTC prices, mining difficulty, energy costs, capital expenditure and, for some businesses, their expansion into data-center or AI infrastructure.
Large technology companies: Their valuations may respond to growth expectations, interest rates and AI-related investment cycles, which can overlap with the macroeconomic factors affecting Bitcoin.
These relationships are not interchangeable. A company's shares can move differently from Bitcoin because its operating performance, debt, cash flows and corporate decisions introduce additional variables.
There is also an important distinction between correlation and direct exposure. A company holding Bitcoin on its balance sheet has a more direct financial connection to BTC than a technology company whose shares simply respond to similar market sentiment. Neither relationship makes the stock a reliable predictor of Bitcoin's next move.
How to Monitor Stock-Market Risk When Analyzing Bitcoin
Correlation is most useful when combined with indicators that help explain why markets are moving. The following framework can help readers interpret equity-market developments without treating them as automatic trading signals.

Monitoring correlation, Treasury yields, ETF flows, and open interest can help traders assess Bitcoin’s exposure to broader market risks.
Track Rolling Correlation and Index Returns
Monitor BTC against the S&P 500 and Nasdaq-100 using a consistent return frequency and a clearly defined window.
A 30-day rolling correlation can help identify recent changes, while a 90-day window offers a broader perspective. Comparing multiple windows can show whether a change is recent or persists over a longer period.
For example, if BTC–S&P 500 correlation rises during a stock-market sell-off, that may indicate stronger shared risk sensitivity. If it subsequently falls, the assets may be responding to different drivers. Neither reading establishes what prices will do next.
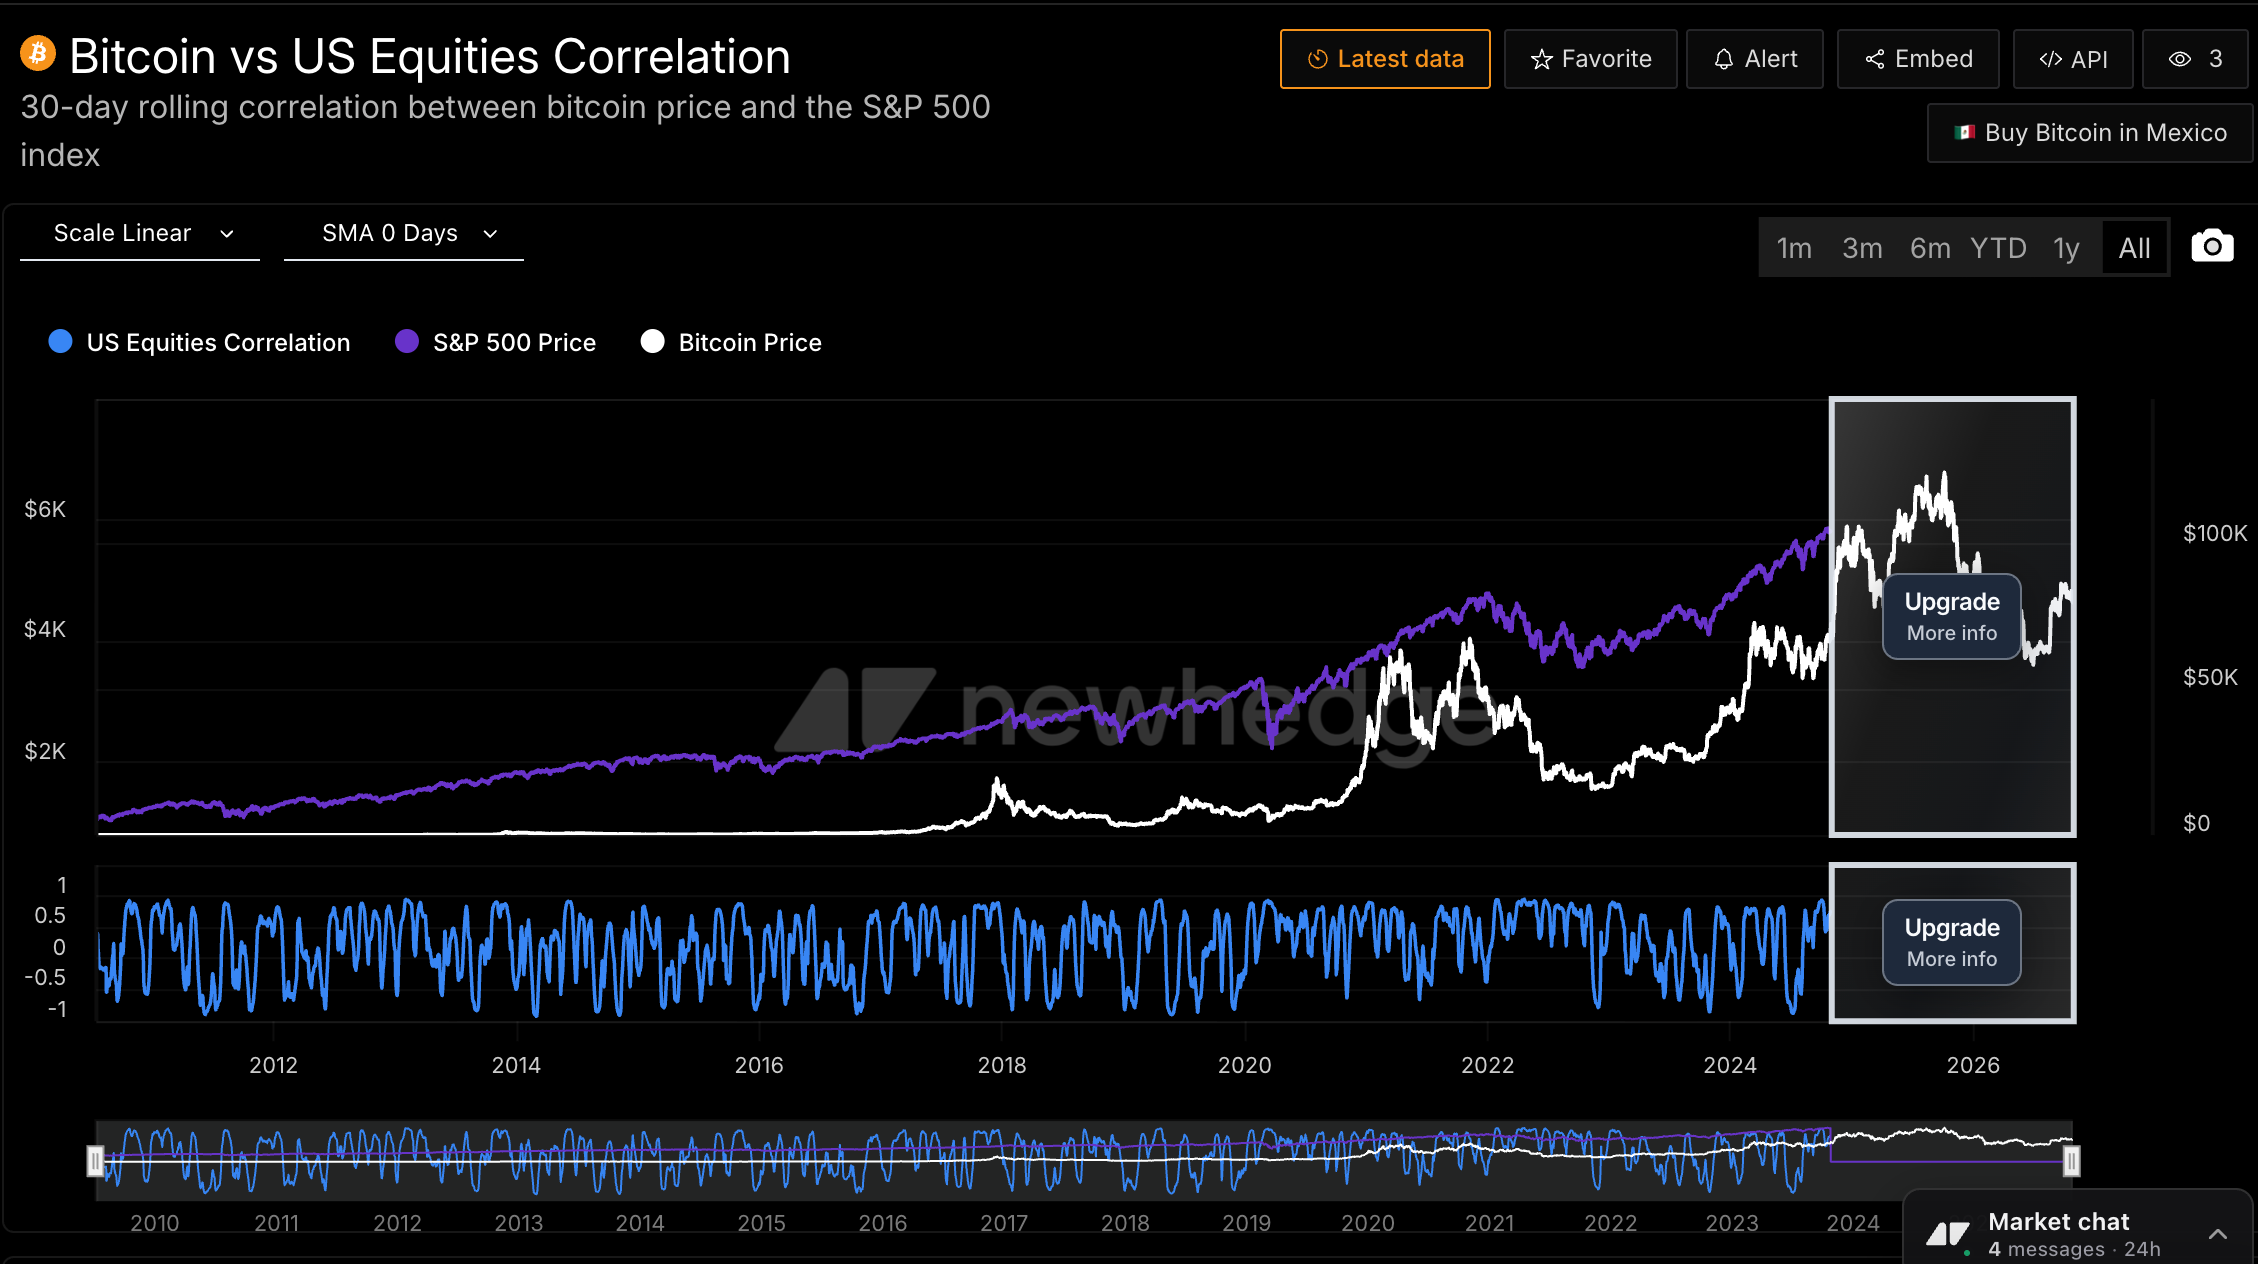
Newhedge's BTC–S&P 500 correlation chart can be used to examine the relationship across different timeframes.
Watch Treasury Yields, the Dollar and Economic Releases
The macroeconomic indicators worth monitoring include:
Treasury yields: Consider whether yields are rising because of inflation concerns, changing monetary-policy expectations or stronger growth.
The U.S. Dollar Index (DXY): A stronger dollar can coincide with pressure on dollar-priced risk assets, although the relationship is not fixed.
Inflation and employment data: These releases can change expectations for interest rates and economic growth.
Federal Reserve communications: Policy statements and officials' comments can alter market expectations before any policy change takes effect.
The goal is to identify the mechanism connecting a macroeconomic event to market prices, rather than assuming every increase in yields or decline in equities has the same implication for Bitcoin.
Cross-Check ETF Flows, Open Interest and Liquidations
Bitcoin-specific indicators can help determine whether a broader equity-market move is being reinforced by crypto-market positioning.
Spot Bitcoin ETF flows: Sustained inflows or outflows can provide evidence of changing demand through regulated investment products.
Open interest: Changes in outstanding derivatives positions can help reveal whether leverage is building or unwinding.
Liquidation data: Forced position closures can indicate that leveraged selling is amplifying price movements.
Trading volume and funding rates: These measures can provide context for market participation and positioning, although neither independently establishes future direction.
These indicators should be interpreted together. Rising open interest, for example, does not necessarily mean the market is bullish or bearish because every derivatives contract has both a long and a short side.
For a broader explanation of the forces that drive BTC price fluctuations, see Bitunix's guide to Bitcoin volatility and its impact on global markets.
For the sentiment side of the analysis, the related guide to bullish and bearish crypto-market sentiment covers how investor psychology and positioning can influence market behavior.
What Stock–Bitcoin Correlation Means for BTC Price Predictions
Bitcoin stock market correlation is one input into a BTC price outlook, not a standalone forecasting model.
When correlation is rising and equities are selling off because of tightening financial conditions, the broader macroeconomic environment may be an important source of downside pressure for Bitcoin. When correlation weakens, crypto-specific demand, institutional flows or other market drivers may have a greater influence on BTC's relative performance.
Neither situation establishes a price target. A credible Bitcoin outlook also needs to consider liquidity, supply and demand, ETF flows, derivatives positioning, regulatory developments and the uncertainty surrounding future economic conditions.
The practical takeaway is to assess the cause of a market move, the strength of the observed correlation and the evidence from Bitcoin's own market before drawing conclusions about future prices.
For a broader range of potential BTC outcomes and the assumptions behind them, see the Bitcoin price prediction for 2026–2030.