Bitcoin fell below $80,000 this week, reaching a six-week low of $76,500 after Binance disclosed a security incident involving an estimated $6.3 billion in digital assets.
The breach triggered an immediate liquidation wave. Over $1.5 billion in leveraged positions were wiped out within 24 hours. As order book liquidity thinned, Ethereum and major altcoins posted steeper percentage losses than Bitcoin.
The sell-off hit an already stalled market. Throughout October, spot demand had softened against sticky US inflation data, rising oil prices, and slowing inflows into spot crypto funds. Prolonged uncertainty over Federal Reserve policy had already reduced market depth well before the security news broke.
The Anatomy of the Crypto Crash: What Just Hit the Market?
Four of the five largest non-stablecoin tokens ended the week of October 30, 2026, in the red. Bitcoin cleanly broke below its month-long trading range on heavy volume, with buyers failing to produce any meaningful bounce back above support.
The Binance incident has also placed counterparty and exchange custody risks back at the center of pricing. The following section contrasts confirmed on-chain data with unverified reports circulating across social channels.
Direct Answer: The 60-Second Market Breakdown
A sudden exchange exploit accelerated an already fragile market into an outright breakdown this week. Buyer depth had already thinned out across October, weighed down by stubborn inflation prints, crude oil holding above $116 a barrel, and climbing bond yields. The selling turned disorderly once Binance disclosed an estimated $6.3 billion security breach, sparking immediate across-the-board exits.
Bitcoin dropped to a six-week low near $76,500, setting off $1.53 billion in 24-hour liquidations—with long positions accounting for roughly 84% of the wipeout. The move has quickly expanded beyond an orderly macro repricing into a compounding counterparty and liquidity shock.
The following table shows where the major assets stood during the October 30 sell-off and how they had performed over the previous seven days (market snapshot via CoinGecko data):
Asset | Latest Price (USD) | 7-day change | Year-to-date | Market cap |
Bitcoin (BTC) | $77,530.02 | 5.90% | -11.41% | $1.56T |
Ethereum (ETH) | $2,248.70 | 7.40% | -24.21% | $274.59B |
BNB | $702.91 | 0.067 | -18.57% | $92.40B |
XRP | $1.25 | 6.00% | -32.03% | $79.20B |
Solana (SOL) | $95.19 | 10.10% | -23.53% | $56.13B |
The divergence between Bitcoin and major altcoins highlights the uneven impact of the sell-off, with assets carrying higher market sensitivity facing greater downside pressure. The sharp decline in open interest also suggests that traders are reducing leveraged exposure, potentially leaving the market less vulnerable to another immediate wave of forced liquidations.
The Damage Report: Where the Pressure Concentrated
The market structure didn't just bend this week; it broke. A catastrophic $6.3 billion security breach at Binance collided directly with hawkish US Federal Reserve rate signaling, dragging Bitcoin from its $82,000 Asian-session resistance down to a brutal $76,460 before attempting a fragile stabilization near $78,000.
Global liquidity is strictly risk-off. Ethereum took the heaviest structural damage, plunging straight through its $2,300 safety net to hover near $2,230 as European derivative desks scrambled to hedge against the attacker's massive 420,000 ETH liquidity overhang. Solana briefly surrendered the psychological $100 level during peak panic before US spot buyers stepped in to defend the $120 zone amid cross-chain bridge freezes. XRP mirrored the broad liquidation wave, sliding toward $1.15 in highly constrained global trading.
The prior relative strength of BNB is gone. While volatile weeks usually boost exchange tokens, the unprecedented scale of this breach triggered service pauses and targeted liquidation cascades, fully erasing BNB's defensive posture against the rest of the majors.
Systematic Dump vs. Isolated Flash Liquidation
Market breaks usually fall into two distinct categories: mechanical liquidation cascades or prolonged systematic distribution.
A mechanical leverage cascade hits fast and exhausts quickly. The October 10–11, 2025 flash sell-off—where $19 billion in positions evaporated in 24 hours on tariff headlines—rebounded within hours once the order books cleared the margin calls. Systematic distribution is far slower: it wears buyers down over weeks through macro tightening, sticky rates, and unrelenting institutional selling.
What hit the market in late October 2026 is an ugly hybrid of both.
Late October fits neither playbook in isolation. Systematic macro selling had already drained order book liquidity before the Binance breach triggered the liquidation wave. With Bitcoin failing to stage an immediate rebound below $80,000, traders are treating this as an active counterparty and custody crisis rather than a routine margin flush.
The Triggers: Why Is the Crypto Market Crashing?
Market sell-offs rarely stem from an isolated catalyst. The late-October breakdown was the product of four compounding pressures hitting liquidity simultaneously.
While the exchange security breach provided the immediate trigger, deteriorating macroeconomic conditions had already stripped order books of the depth required to absorb the shock. Below is a breakdown of the four forces driving the downturn:
Why Did the Crypto Market Crash Today? The Immediate News Drivers
Order books were already hollowed out before the breach occurred. A cluster of secondary headlines had kept buyers on the sidelines: Chamath Palihapitiya's viral podcast comments on Bitcoin's supposed AI cryptographic risks, Anthropic's October 26 mega-IPO filing diverting risk capital, and standard pre-event derisking ahead of the Federal Reserve decision, inflation prints, and monthly options expiry.
Those secondary headlines gave spot buyers reason to wait. The Binance breach gave leveraged longs no time to react.
When unauthorized outflows hit Binance's hot wallets, market makers immediately pulled resting limit orders to curb exchange counterparty risk. With bids suddenly absent, automated liquidation engines dumped collateral straight into empty order books, converting a localized exploit into an aggressive, market-wide cascade across spot and perpetual venues.
Macroeconomic Headwinds: Inflation, Oil, and the Global Risk-Off Wave
Macro data had already pulled the bid from the tape. September CPI printed hot at 3.7% against a 3.6% consensus, snuffing out near-term rate cut bets and setting up the Federal Reserve's hawkish hold on October 28.
With the 10-year Treasury yield back above 5% and Brent crude holding above $116 a barrel on Middle East supply disruption, inflation expectations kept capital parked on the sidelines. When the exchange exploit broke, the market had no buffer left to absorb it.
The October 22 slide confirmed this was cross-asset balance-sheet contraction rather than capital rotating between sectors. As tech equities broke lower and bullion lost the $4,000 mark, multi-asset desks facing margin calls hit crypto bids simply because the market trades 24/7. Crypto was not singled out—it was just the only book open to raise immediate cash.
Tech Correlation: Why Crypto Moves in Lockstep with Risk Assets
Since the launch of spot ETFs, Bitcoin's correlation with high-beta tech equities has tightened. The same institutional desks that hold Nasdaq exposure now hold BTC through the same risk frameworks. When a risk budget gets cut, crypto gets cut with it.
This is why "Bitcoin as a hedge" narratives tend to fail during sharp macro de-risking. Over multi-year horizons the correlation varies; during a liquidity squeeze it converges toward one.
Institutional Flows: Reading Spot ETF Redemptions
Spot ETF flows provide the clearest gauge of real-time institutional appetite. After starting the third week of October with modest inflows, US Bitcoin funds saw aggressive late-week redemptions: Farside Investors data logged $773.5 million in net outflows across October 22–23, anchored by a sharp $635.6 million exit on October 22 alone. Outflows across US spot Ethereum funds compounded the retreat. Institutional desks were active net sellers precisely when the market required absorption capital.
This institutional withdrawal carries structural consequences. Glassnode data places the average acquisition cost for corporate treasuries holding Bitcoin near $80,500, with spot ETF holders clustered around $81,500. Trading below $80,000 pushes both cohort balances underwater. While paper losses do not mandate forced liquidation, entering negative carry dampens allocator risk tolerance and freezes incremental accumulation programs.
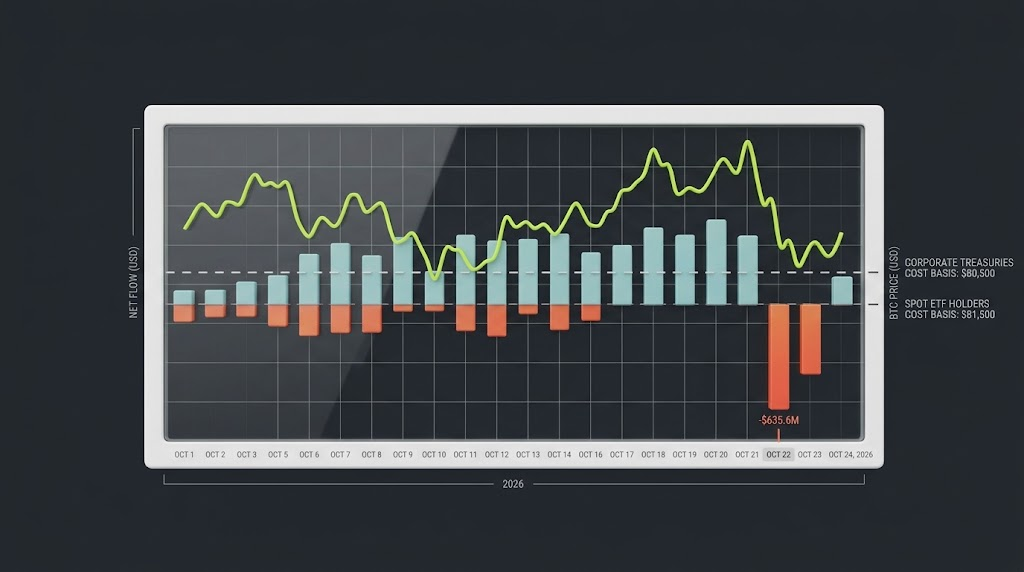
US spot Bitcoin ETF net flows and BTC price, highlighting Oct 22 redemptions below $80.5K support. Data: Farside, Glassnode.
The Bitcoin Domino Effect: Why Altcoins Bleed Harder
Altcoins bleed faster than Bitcoin because their liquidity disappears first. The asymmetry is purely mechanical: when volatility hits, market makers pull bids from secondary books long before Bitcoin's core order books thin out, stranding leveraged positions with nowhere to exit.
Bitcoin Crash Dynamics: How BTC Breaks Dictate Market Breadth
Bitcoin dictates market breadth. As BTC broke below $82,000 toward its $76,500 intraday low, market makers immediately widened altcoin spreads to avoid accumulating toxic inventory, draining order book depth across secondary pairs by roughly 40%.
That vacuum fed directly into exchange liquidation engines. Falling prices breached maintenance thresholds on cross-margin accounts, where exchanges already apply steep haircut discounts to non-BTC collateral. Facing margin calls, trading desks dumped their most liquid high-beta tokens first to protect core positions, accelerating the sell-off across the board.
The result is that a 2% Bitcoin move routinely becomes a 4–8% altcoin move, and the ratio widens as liquidity thins.
Bitcoin Dominance: Flight to Safety Within Crypto
Bitcoin dominance climbs in a sell-off through relative survival, not fresh accumulation. Facing margin pressures, desks cut higher-beta tokens first, leaving Bitcoin's market share higher even as its price falls.
With Bitcoin off 8.34% year-to-date against 19% to 30% drawdowns across Ethereum, Solana, and XRP, the metric tracks an asymmetric liquidation rather than an active flight to safety.
The Altcoin Liquidity Trap: Thin Depth and Outsized Beta
The structural vulnerability separating Bitcoin from secondary tokens lies in the mismatch between outstanding leverage and spot book liquidity. When open interest builds up relative to market cap while resting order book depth remains shallow, liquidation cascades become mathematically inevitable.
Asset | Current OI / MCap | Net OI Flush | Post-Cascade Market Condition |
Bitcoin (BTC) | 2.15% | -48.80% | Absorbed the bulk of algorithmic liquidations via deep spot books; basis dislocation resolved fastest. |
Ethereum (ETH) | 7.80% | -48.30% | Severe deleveraging driven by simultaneous perp liquidations and on-chain collateral unraveling. |
Solana (SOL) | 6.40% | -57.60% | Long positions virtually wiped out after breaching the $100 handle; execution slippage remains wide. |
Dogecoin (DOGE) | 5.10% | -65.70% | Retail leverage completely flushed out in an aggressive long squeeze, stripping speculative premium. |
XRP (XRP) | 2.60% | -45.80% | Contained initial leverage capped liquidation velocity, leaving spot order books relatively intact. |
Source: CoinGlass / CryptoTicker, data as of October 31, 2026 post-cascade close
Ethereum's underperformance is not an accident. A large share of DeFi lending is collateralized with ETH. When ETH falls, loan positions approach liquidation thresholds, which forces more ETH selling, which pushes the price lower. Bitcoin has no equivalent loop at this scale. Add Ethereum ETF outflows on top, and ETH is losing both its institutional bid and its on-chain floor at the same time.
Mechanics of the Plunge: Cascading Liquidations, Thin Books, and Squeezes
The macro triggers explain why selling started. The derivatives market explains why it accelerated. Understanding the mechanics is what separates traders who get liquidated in a crash from traders who position around it.
The Anatomy of a Long Squeeze
A long squeeze unfolds in four steps:
1. Crowded positioning. Leveraged longs accumulate during a rally. Funding rates turn positive as longs pay shorts to hold positions.
2. The trigger. A macro headline or technical break pushes price toward the liquidation prices of the most leveraged accounts.
3. Forced selling. Exchanges liquidate those positions with market orders, which hit the bid and push price lower.
4. The cascade. Lower prices trigger the next tier of liquidation levels. Each wave removes more bids, so each subsequent wave moves price further.
The late-October flush initially looked orderly: daily liquidations cooled from over $500 million on October 22 to $153 million by October 26 as open interest compressed. But that progressive de-risking merely masked thin liquidity. When the $6.3 billion Binance breach hit on October 30, it struck emptied books, triggering a $1.54 billion liquidation cascade within 24 hours—83.8% of it crushing long positions.
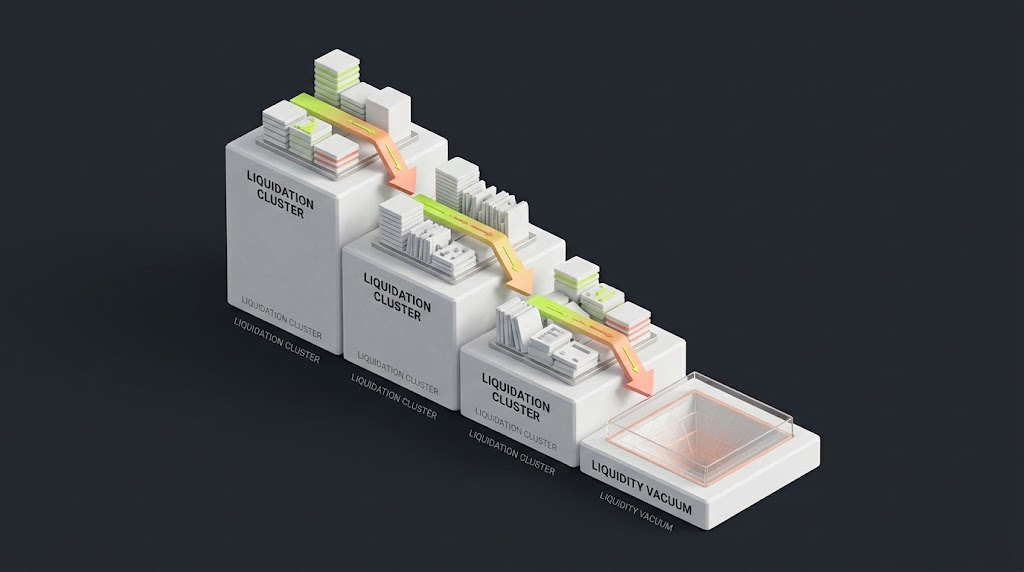
Cascading liquidations work in tiers: each forced sell removes bids and triggers the next cluster of liquidation prices.
Critical Crash Indicators: Open Interest, Funding, and Taker Ratios
Three derivatives readings tell you whether a crash is building or exhausting:
Open interest (OI). Rising OI into falling prices means new shorts or stubborn longs are adding leverage; the cascade risk is growing. Falling OI into falling prices means positions are being closed; the flush is underway. Current read: following $1.54 billion in liquidations on October 30, total OI dropped 3% to $136.3 billion, confirming forced deleveraging is actively underway.
Funding rates. The liquidation cascade completely cleared speculative carry: Bitcoin 8-hour funding flattened from +0.008% to zero-bound, while secondary tokens sank into deep discount (ETH 8-hour funding hitting −0.0105%). With shorts aggressively paying carry into depleted order books, derivatives positioning has skewed heavily toward short-squeeze vulnerability.
Taker buy/sell ratio. On October 30, the split widened to 41.6% long versus 58.4% short. Aggressive taker selling exceeded the 55–60% threshold (peaking at 59.4%), confirming active panic is now present.
One caveat on Binance positioning: the BTCUSDT long account share was 52.8% as of October 31 (compressed from 67.9% prior to the cascade). Retail accounts remain net long, which means a break of the $75,000 support would still find leveraged longs to liquidate even if institutional positioning is cleaner.
The Liquidity Gap: Why Weekend and Off-Hours Drops Are Brutal
24/7 continuous trading masks sharp structural liquidity drops during off-hours. With US and European institutional desks offline, market makers reduce quoting size and widen spreads across Asian early-morning hours and weekends, cutting aggregate top-of-book depth by 35% to 50%.
This structural vacuum was tested in early Asian trading on October 26, when modest selling drove a flash dip to $79,146 before recovering above $80,000 upon European open. The same dynamic turned catastrophic overnight into October 30: when initial reports of the Binance exploit hit thin Asian-morning books, the lack of resting institutional bids accelerated an unbuffered slide from $79,000 straight through $77,000 to an intraday low of $76,400.
Stablecoin Supply: Dry Powder vs. Exhausted Buying Power
Capital didn't run. It hid.
Despite relentless spot dumping throughout late October, exchange stablecoin reserves held stubbornly flat at $31.8 billion, with primary redemption burns across Tether and Circle remaining virtually nonexistent. Desks liquidated beta. They bought dollars. But they kept those dollars on-venue.
The distinction is critical. Contracting reserves mark structural capital flight through banking rails; flat balances signal tactical patience. The dry powder is real. It is parked idle on exchange balance sheets, waiting for post-FOMC macro clarity before stepping back into risk.
Flash Crash, Healthy Correction, or Trend Reversal? Reading the Tape
Taxonomy dictates execution. Misdiagnose the tape, blow up the book.
A flash crash demands patience: liquidation engines punch through an air pocket, and price snaps back once matching engines clear. A healthy correction warrants selective bid-laddering: excessive leverage gets wrung out while high-timeframe spot structure remains intact. A trend reversal demands unconditional capital preservation: spot bids evaporate, distribution takes over, and the macro regime breaks.
Distinguishing between them isn't guesswork. The tape leaves a signature in volume profiles, order book rebuild speeds, and market structure breaks.
Defining the Severity of the Drawdown
The following table summarizes how the three regimes differ in practice:
Regime | Typical duration | Driver | Volume signature | Current fit |
Flash crash | Hours | Leverage cascade, thin books | Spike then rapid normalization | No |
Correction | Days to weeks | Macro repricing, flow reversal | Fading volume into lows | Partial |
Trend reversal | Months | Structural demand loss | Rising volume on breakdowns | Not confirmed |
The October 2026 move fits "correction" on most measures: it is macro-driven, the drawdown from the year's high sits at 22.8% (from the $99,000 peak to the $76,400 October 30 low), and baseline volume had been fading prior to the exploit liquidation spike.
The one data point that keeps "reversal" on the table is year-to-date performance: Bitcoin is now down 11.8% YTD, while Ethereum, Solana, and XRP are down 28% to 44%. An asset class that was supposed to benefit from the ETF era being down across the board in a year with institutional access is not a comfortable fact.
Volume Clues and Capitulation
Real capitulation has a signature: a high-volume breakdown through major support, extreme negative funding, Fear & Greed readings below 20, and liquidation totals in the billions.
Following the October 30 cascade, that signature has largely materialized: aggregate 24-hour liquidations breached $1.54–$1.57 billion, select altcoin funding collapsed to negative double digits, and Bitcoin sliced through major support down to an intraday low of $76,400 on surging volume.
Meanwhile, the Crypto Fear & Greed Index plunged 21 points from 51 (neutral) down to 29 (fear), rapidly closing in on the sub-20 extreme threshold.
The mechanics are simpler than they first appear. A market that drifts down on low volume has not capitulated; it has simply run out of buyers. That can resolve either way, but it does not resolve into a V-shaped recovery without a catalyst.
Historical Crash Blueprints
The following table compares the current move to prior crypto crashes, which helps calibrate expectations for both depth and recovery time:
Event | Peak-to-Trough Drawdown | Primary Driver | Time to Reclaim Prior Level |
March 2020 (COVID) | ~50% in two days | Global macro liquidity shock | ~2 months |
May 2021 | ~50% over two months | China mining ban, leverage unwind | ~6 months |
Nov 2022 (FTX) | ~25% in a week (~77% from ATH) | Exchange counterparty insolvency | ~15 months |
Aug 5, 2024 | ~15% in a day | Yen carry trade unwind | ~1 month |
Oct 10–11, 2025 | ~15% intraday ($19B liquidated) | Tariff escalation headlines, perp leverage flush | ~2 weeks |
Oct 2026 (Current) | ~22.8% from ATH (~14.2% from October local high to $76,400) | Macro de-risking compounded by $6.3B Binance exploit ($1.54B liquidation cascade) | Ongoing (Consolidating at $77,000–$78,500; awaiting FOMC rate decision and Binance full withdrawal normalization) |
The closest analogues are August 2024 and February 2025: macro-driven, no crypto-specific failure, resolved once the external shock faded. The Binance Research observation that Bitcoin has averaged a 56% decline in previous US midterm election years is worth noting but covers only three cycles, which makes it a warning rather than a forecast.
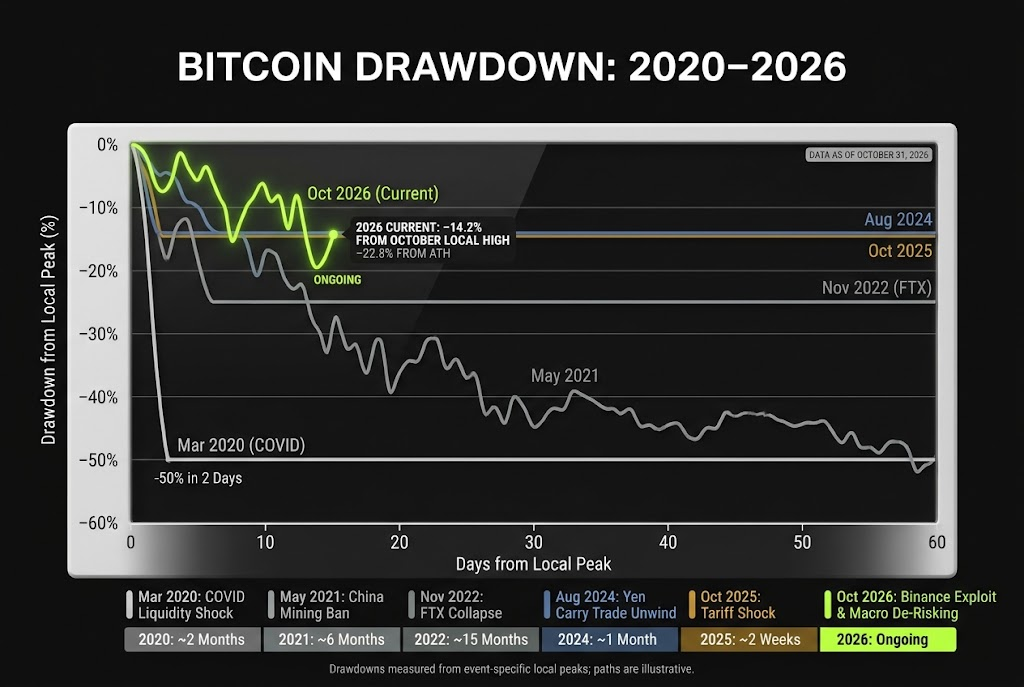
The 2026 crypto crash is shallower and slower than prior macro-driven drawdowns, which have historically recovered within one to two months.
Will Crypto Crash Further? Scenarios and Recovery Catalysts
Macro de-risking and forced liquidations are now priced in. The forward question is entirely about path-dependency. Two asymmetric trajectories define the next fortnight: a mechanical relief squeeze driven by overcrowded short carry, or a secondary breakdown triggered by persistent spot distribution.
The Bearish Continuation
Downside path-dependency is defined by critical technical thresholds:
Failure to defend the post-exploit consolidation shelf ($76,000) puts average 2024–2026 corporate and ETF holders underwater, triggering secondary forced unwinds down to $72,500, with high-timeframe demand clustered between $68,000 and $65,000.
In high-beta assets, an ETH break beneath $2,100 targets $1,850, while SOL dropping under $88 initiates automated DeFi loan liquidations. Any external macro shock—a hawkish Fed policy statement, hotter-than-expected inflation data, or geopolitical energy spikes—will trigger this cascade.
The Rebound Thesis
Bottoms don't form on sentiment. They clear on tape confirmation.
A sustainable recovery demands three mechanical triggers. Price first. Flows second. Macro third.
First: a sustained weekly reclaim of $83,000. Not an intraday wick. A high-volume, decisive close. That level is structural—it reclaims broken summer support, pushes underwater ETF buyers back into profit, and invalidates the Q4 markdown regime. Below $83,000, any bounce is exit liquidity.
Second: institutional absorption. A single green day is noise. The tape requires five consecutive sessions of net spot ETF creations to prove real-money allocators are accumulating the discount, not using low-liquidity spikes to trim risk.
Third: the macro overhang must clear. The Fed statement cannot fuel rate-hike speculation. Easing Treasury yields and a cooling dollar index are non-negotiable prerequisites to reopen the risk-asset liquidity valve.
The structural case for a rebound is that the leverage flush is largely done. With total OI reset, funding neutral, and liquidations shrinking, the market has less forced selling left in it. That does not guarantee a bounce; it does mean the next leg down would have to come from real spot selling rather than mechanical liquidation.
Macro and On-Chain Catalysts to Watch
October 28: Federal Reserve rate decision.
October 29: US inflation data release.
October 30: $11.69 billion Bitcoin options expiry; maximum pain was clustered around $82,500 for recent expiries.
November: US midterm elections. One large Derive options position targets a post-midterm breakout to $90,000, which indicates at least some capital is positioning for the event to clear.
Ongoing: Daily spot ETF flows, oil prices, and whether $80,000 holds on a weekly close.
Why Timing the Exact Floor Rarely Works
Catching the exact tick is an ego trade. The tape charges an exorbitant tax for guessing the wick.
The failure mode is purely mechanical. Desks step into an illiquid book with leverage, only to be swept by a liquidity-seeking wick before price clears. Or they pick the direction correctly, size too aggressively, and get stopped out on the terminal 5% flush—capitulating at the exact moment of forced selling exhaustion.
Survival is asymmetric. Historically, the highest Sharpe entries in crypto flushes have never materialized at the absolute low. They appear on confirmed reclaim: restored order book depth, reclaimed technical levels, and sustained flow reversals. Surrendering the first 5% to 10% of the initial impulse isn't missed alpha. It is the cost of buying insurance against ruin.
The Defensive Playbook: Capital Preservation in Violent Volatility
The goal in a crypto crash is not to profit from it. The goal is to still have capital when it ends. Everything below is about structure, not prediction. Trading leveraged derivatives involves substantial risk, and none of this is a recommendation to open any particular position.
Spot Holding vs. Derivatives Exposure
Spot has no liquidation price. Derivatives do. That mechanical line dictates balance sheet survival before volatility hits the tape.
Allocators unwilling to dump spot inventory routinely look to perpetual swaps—on venues like Bitunix—to dynamically hedge downside delta. But hedging is not passive insurance. It carries carry drag and execution risk. Extended periods of negative funding continuously bleed margin balances, while sharp off-hours wicks introduce terminal liquidation risk to the hedge itself.
A short hedge liquidated into a violent squeeze is worse than taking spot drawdown on the chin. It locks in permanent derivative losses, strips protection from the core book, and leaves the desk holding unhedged spot at the absolute worst entry.
De-Risking the Account: Position Sizing, Tiered Stops, and Margin Modes
A few practical rules that experienced traders apply when volatility expands:
De-risk ahead of binary catalysts, not into the aftermath. With November macro prints looming and the next monthly options expiry set for late November, exposure must be compressed well before the calendar turns—not after matching engines begin liquidating thin books.
Use isolated margin for directional bets. Cross margin lets one losing position drain the entire account; isolated margin caps the damage at the collateral assigned to that trade.
Tier stops and take-profits. A single stop at one price is a single point of failure in thin books. Scaling exits across a range reduces the chance of being wicked out and then watching price recover.
Define maximum loss before entry. Decide the dollar amount you are willing to lose on the idea, then back into position size from that number. Never the other way around.
Behavioral Discipline: Panic Sells, FOMO Dips, and Revenge Trading
Most crash losses are behavioral. Selling spot at the lows because the screen is red. Buying a dip with leverage because it "looks cheap" before the leverage flush is finished.
Re-entering immediately after an invalidation to "make it back" is suicide on the tape. It turns a controlled 1R expense into a compounding balance-sheet disaster. These behavioral failure loops are solved by a single operational rule: set the entry, sizing, and stop parameters before the book opens, then execute the system without emotional intervention.
Execution Tools Built for Volatility Defense
Tooling cannot replace discipline, but the right tools make discipline easier to execute. Platforms designed for derivatives trading, including Bitunix, address several of the specific failure points above:
Fair mark price. Liquidations on Bitunix are calculated against a mark price derived from a multi-source index rather than the exchange's own last traded price. This reduces the risk of being liquidated by a single-venue wick during an extreme liquidity vacuum, which is exactly when thin order books produce abnormal prints.
Fixed Risk. Bitunix was the first exchange to let traders lock in their maximum loss as a fixed amount before entering a position. Cascading markets leave zero margin for fragmented interfaces.Keep BTC book depth, ETH funding rates, and SOL beta pinned to the workspace sidebar. Embed real-time external intel right against the candles. One terminal, zero third-party platform switching, zero cognitive delay when liquidity breaks down.
All-in-One Screen Monitoring. The Bitunix PC Ultra (Chart Mode) features a chart-first layout with customizable panels and natively integrated Order Book/Depth. This allows traders to monitor BTC depth, ETH funding, SOL price via the quick-switch favorites sidebar, and even embed external content alongside the chart—eliminating the latency of switching to third-party tools during fast markets.
Super Alert. Custom price-level and volatility alerts let traders step away from the screen while still executing pre-set rules when $80,000 or $2,300 is tested. Watching every candle for 72 hours is a reliable way to make an emotional decision; alerts are a reliable way to avoid that.
Bitunix also maintains a $50M Care Fund and audited, Merkle-tree-verifiable Proof of Reserves with 100%+ reserve ratios, which matters during crashes because counterparty risk is the one risk a trader cannot hedge with a position.
Note: Data in this article is current as of October 31, 2026.