

Reporting Period: October 10–16, 2026
Data as of: October 16, 2026
Market Overview: Inflationary Pressures Resurface in the U.S. as Bitcoin Rebounds After Falling Below $80,000
U.S. inflation came in above market expectations again in September, adding uncertainty to the Federal Reserve’s future monetary policy. Data released by the U.S. Bureau of Labor Statistics on October 14 showed that the Consumer Price Index (CPI) rose 3.7% year over year, exceeding the market forecast of 3.6% and increasing from 3.4% in the previous reading. This marked the largest annual increase in five months. On a month-over-month basis, CPI rose 0.6%, in line with expectations but above the previous reading of 0.4%. The data suggest that progress in bringing inflation down remains uneven, prompting markets to reassess the Fed’s future interest-rate path.
Financial markets quickly repriced following the inflation report. The U.S. Dollar Index briefly rose by around 30 points, while the 10-year U.S. Treasury yield climbed. Futures tracking the three major U.S. stock indexes turned lower, and spot gold also retreated briefly. In interest-rate markets, traders raised the implied probability of a Fed rate hike in October to 50% and anticipated a cumulative three rate hikes by the end of 2027. Expectations of tighter monetary policy increased pressure on global risk assets. The crypto market was also affected: Bitcoin briefly fell below the $80,000 threshold before rebounding above $82,000, highlighting the sharp volatility that followed the inflation release.
The Bitunix Token Pulse Weekly Report tracks the performance of the top 300 tokens by market capitalization on Bitunix, alongside developments in popular U.S. stock-linked futures, providing investors with market insights and a reference for trading strategies.
Crypto Asset Performance: Broad Market Weakness, with a Few Sectors Moving Against the Trend
The crypto market came under broad pressure this week. Among the top 300 tokens by market capitalization on Bitunix, only around 40% posted gains, while the median return was -2.03%. Major crypto assets including XRP, SOL, and HYPE each fell by more than 3%. After U.S. CPI data exceeded market expectations, concerns about the Fed’s monetary policy intensified, prompting some investors to reduce their risk exposure and weighing on the broader crypto market.
Top Gainers: BAT Rallies Nearly 100% as Zero-Knowledge-Related Tokens Advance
Zero-knowledge-proof (ZKP)-related tokens stood out among this week’s top performers. ZK and STRK, the native tokens of zkSync and Starknet respectively, both rose by more than 40%. Both projects are Ethereum-based Layer 2 networks. Celestia (TIA) and NEAR also gained more than 10%, highlighting relative strength among data availability and related infrastructure tokens.
The sharp gains in ZKP-related tokens suggest increased market interest in these projects. However, a single week of price appreciation is not sufficient to establish that demand for privacy protection or on-chain security is rising across the market. Further developments in technology adoption, ecosystem growth, and capital flows will need to be monitored. Basic Attention Token (BAT), the utility token associated with the Brave browser ecosystem, performed even more strongly, gaining 99.43% over the past seven days to lead this week’s gainers.
Token | Latest Price | 7-Day Change |
BAT | $0.20 | 99.43% |
ZK | $0.02 | 42.37% |
STRK | $0.09 | 42.00% |
TIA | $0.58 | 14.57% |
NEAR | $5.28 | 13.59% |
Source: Bitunix. Prices and percentage changes recorded at 02:00 UK time (UTC+0).
Top Losers: Solana Ecosystem Remains Under Pressure, with Several Tokens Falling More Than 10%
Tokens associated with the Solana ecosystem dominated this week’s list of top losers. RAY, PUMP, and ORCA, which are linked to Solana’s DeFi ecosystem, each declined by more than 15% over the past seven days, indicating significant selling pressure. The Sandbox (SAND), last week’s top gainer, also experienced a sharp correction, falling more than 20%. The pullback suggests that profit-taking pressure has increased following its earlier rally.
Token | Latest Price | 7-Day Change |
RAY | $1.83 | -23.65% |
SAND | $0.06 | -20.69% |
PUMP | $0.00 | -18.65% |
ORCA | $1.96 | -18.28% |
LIT | $3.05 | -16.37% |
Source: Bitunix. Prices and percentage changes recorded at 02:00 UK time (UTC+0).
Featured Token Analysis: BAT — A Token Built Around Digital Advertising and the Attention Economy
Basic Attention Token (BAT) is a digital advertising ecosystem token built on blockchain technology. Its core concept is to turn user attention into measurable value and improve how value is distributed among users, advertisers, and content creators in traditional digital advertising.
BAT is closely associated with the privacy-focused Brave browser and its Brave Rewards program. Users can opt in to privacy-preserving advertisements to earn BAT or use the token to support websites and content creators. BAT was initially issued on Ethereum as an ERC-20 token and later gained support for the Solana network through cross-chain bridging. As a utility token within the ecosystem, BAT is primarily used for advertising incentives, creator support, and related digital services. Its broader aim is to establish an attention-based economic model involving users, advertisers, and content creators.
BAT Technical Analysis: Price Consolidates After a Rapid Rally
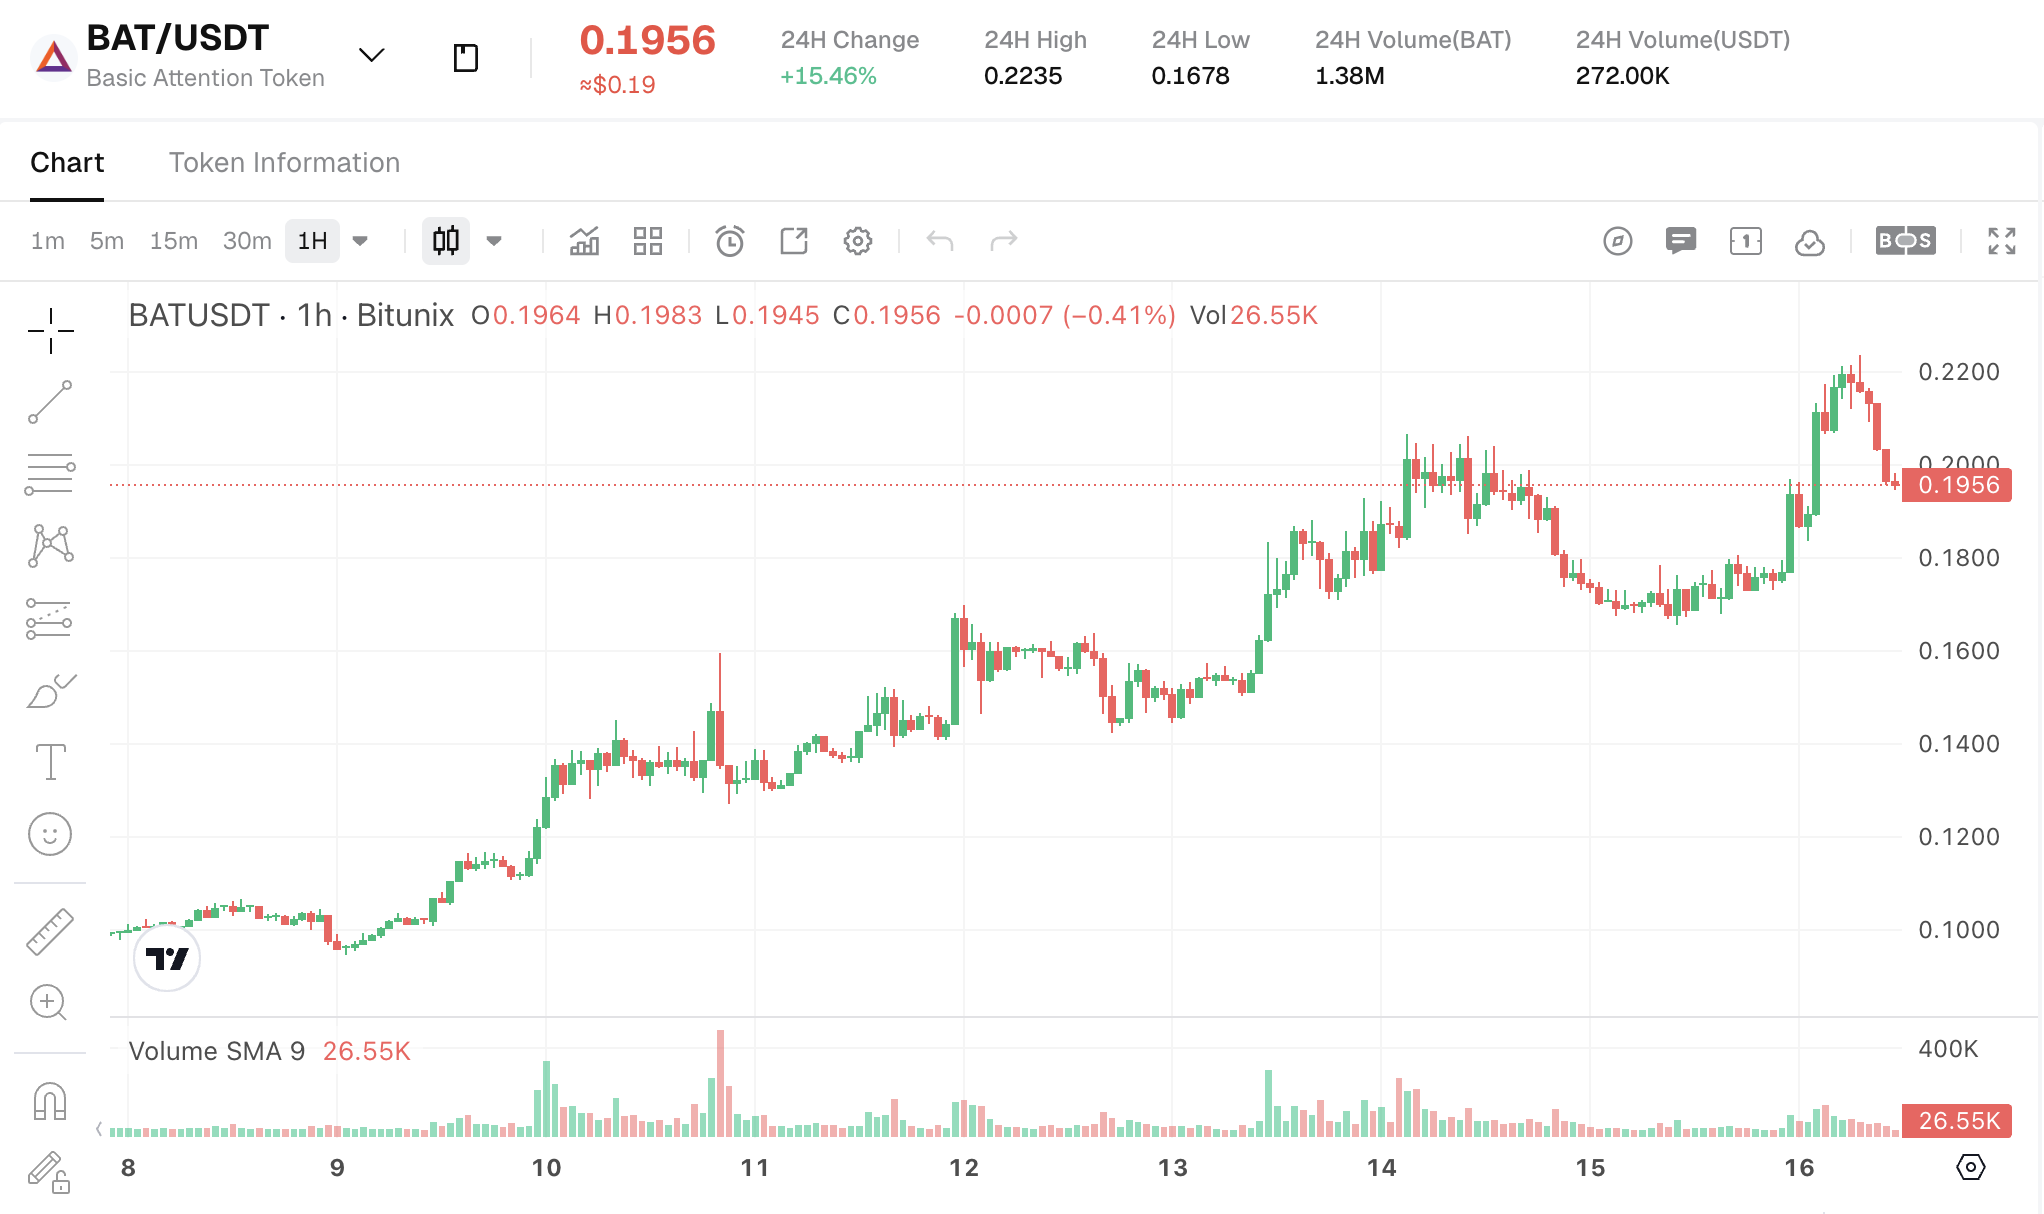
BAT has been listed on multiple exchanges since 2017. Its price reached an all-time high of approximately $1.93 in 2021, corresponding to a fully diluted valuation (FDV) of around $3 billion. The token subsequently entered a prolonged decline, falling below $0.10 by April 2026.
The current rally began in mid-August, when BAT climbed from approximately $0.06 to $0.08 in just five trading days. The token then advanced through several rallies and consolidation phases before breaking above $0.20 on October 14. Its recent price action has alternated between rallies, pullbacks, and sideways trading, with each consolidation phase followed by further gains.
BAT is now trading around $0.20 and appears to be entering another consolidation phase. Whether the token can establish sustained support around this level will be an important factor to watch in the near term.
Source: Bitunix
BAT Fundamental Analysis: Brave Browser User Base Expands as Brave Rewards Card Registrations Surpass 200,000
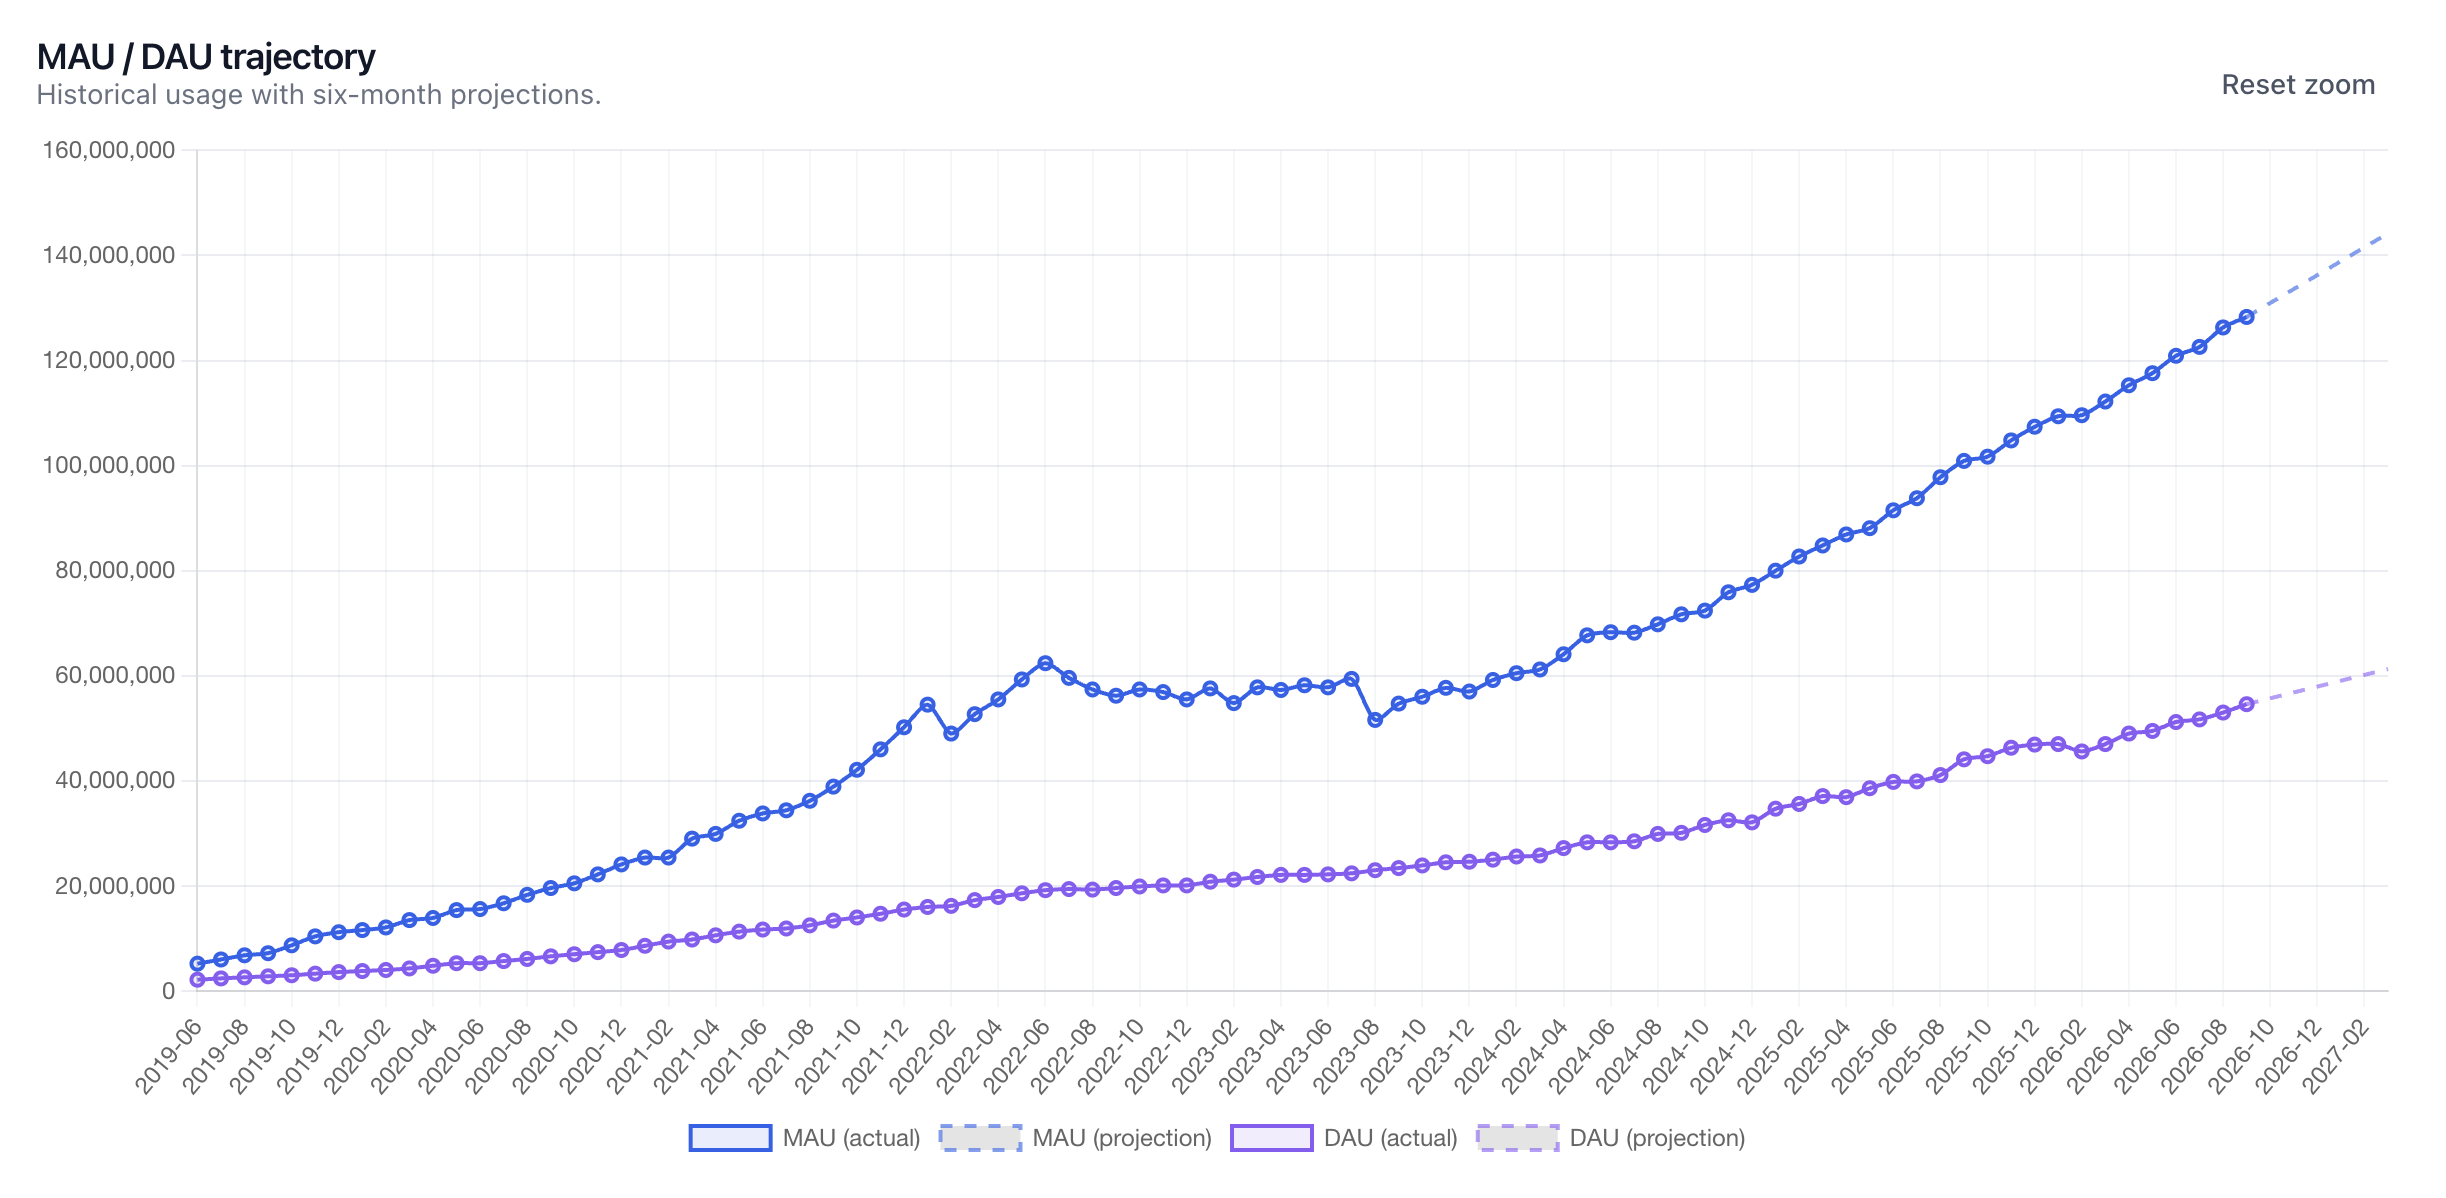
As the rewards token of the Brave browser ecosystem, BAT’s long-term value is closely linked to user growth, advertising demand, and actual token usage. Growth in Brave’s user base and the use of BAT within its rewards mechanism are therefore important indicators of its fundamental development. As of September 2026, Brave had 128 million monthly active users (MAU) and 54.6 million daily active users (DAU), indicating that the browser has established a substantial user base.
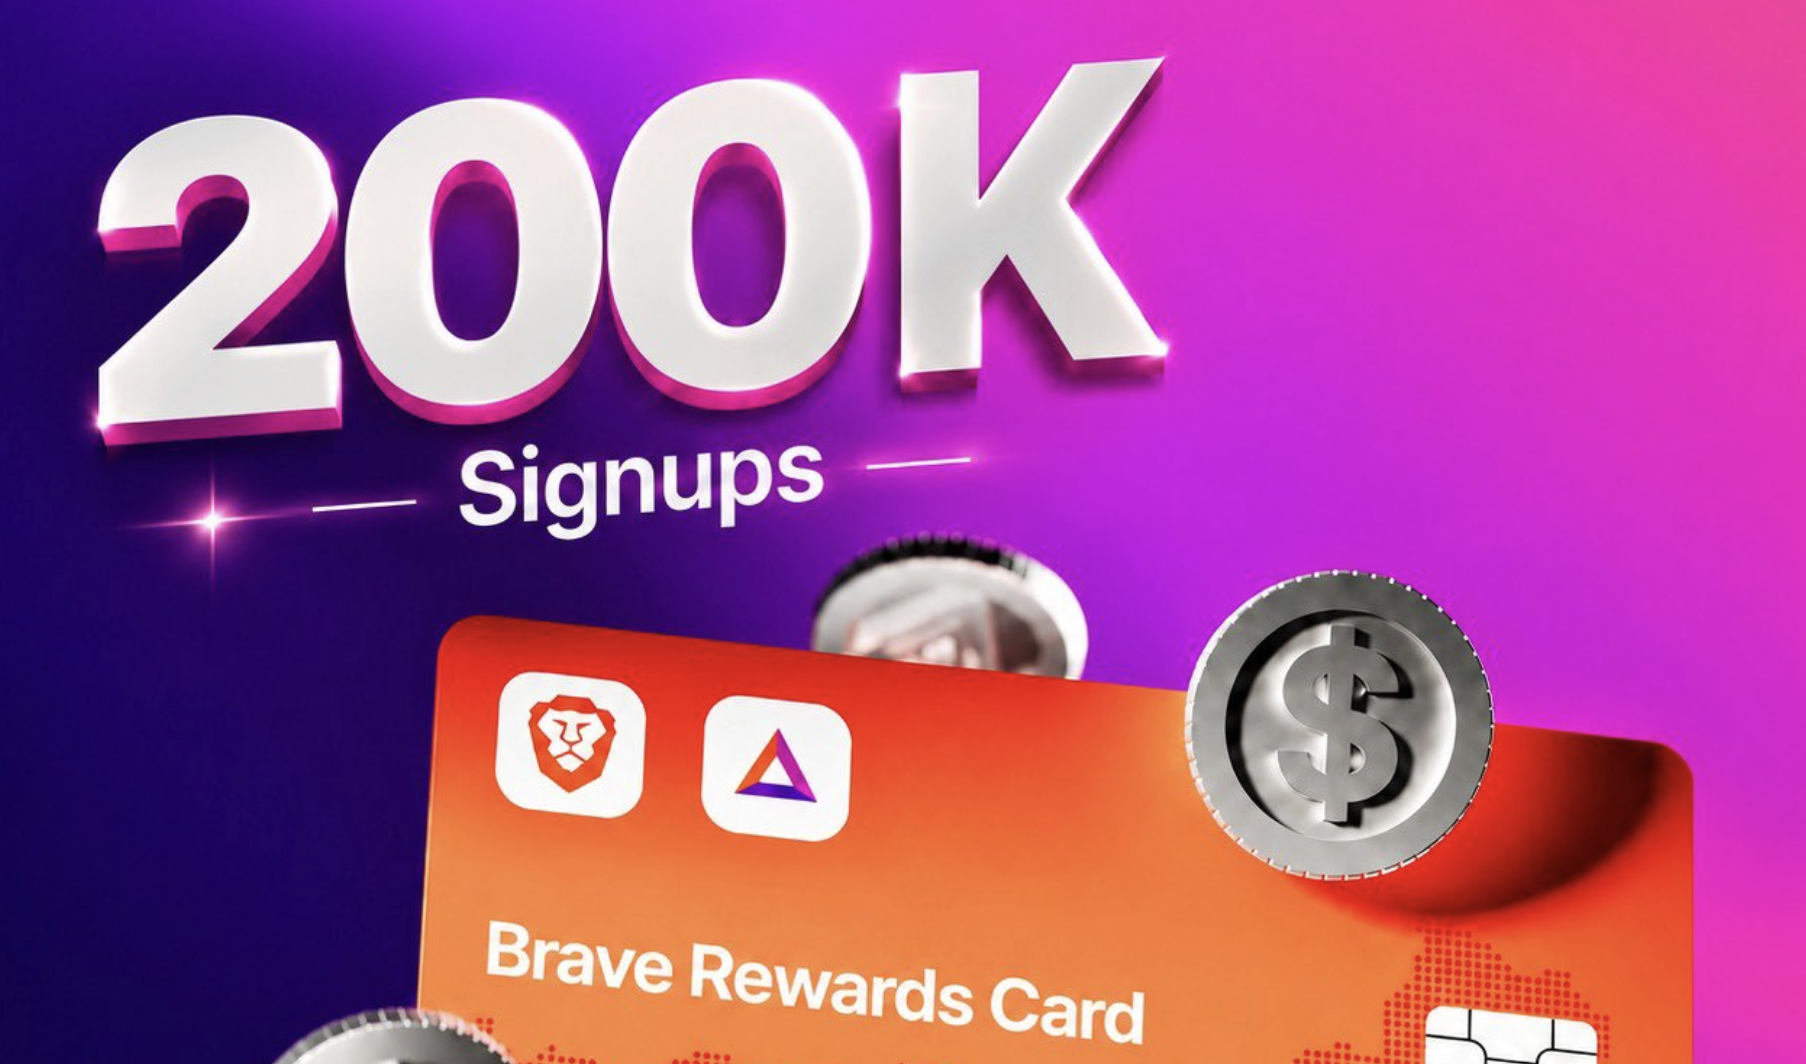
Brave has also introduced the physical Brave Rewards Card to expand BAT’s use in everyday spending. Data as of October 10, 2026, showed that registrations for the card had surpassed 200,000. This suggests that Brave is seeking to connect its browser-based rewards program more directly with real-world consumer spending.
Source: Brave Browser Stats
Source: X
BAT Derivatives Analysis: Negative Perpetual Funding Rates Persist, Potentially Amplifying Price Volatility
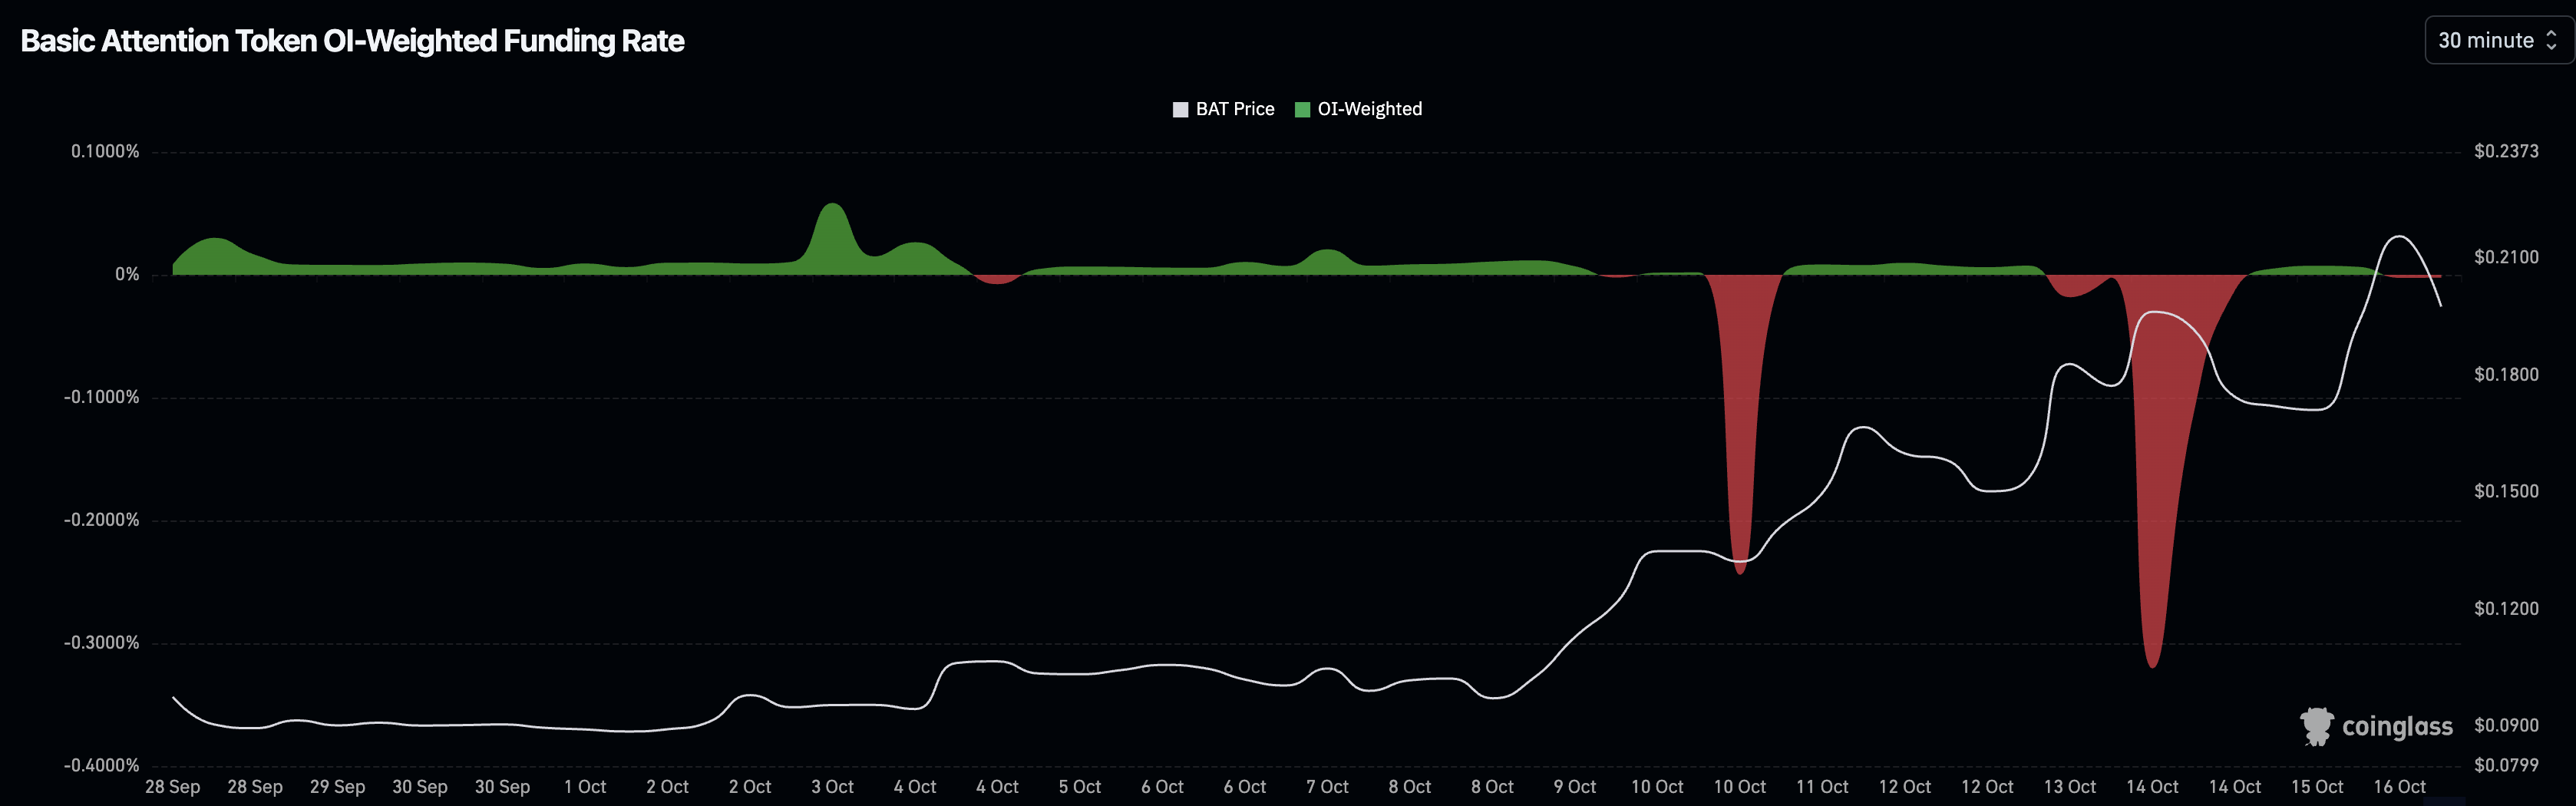
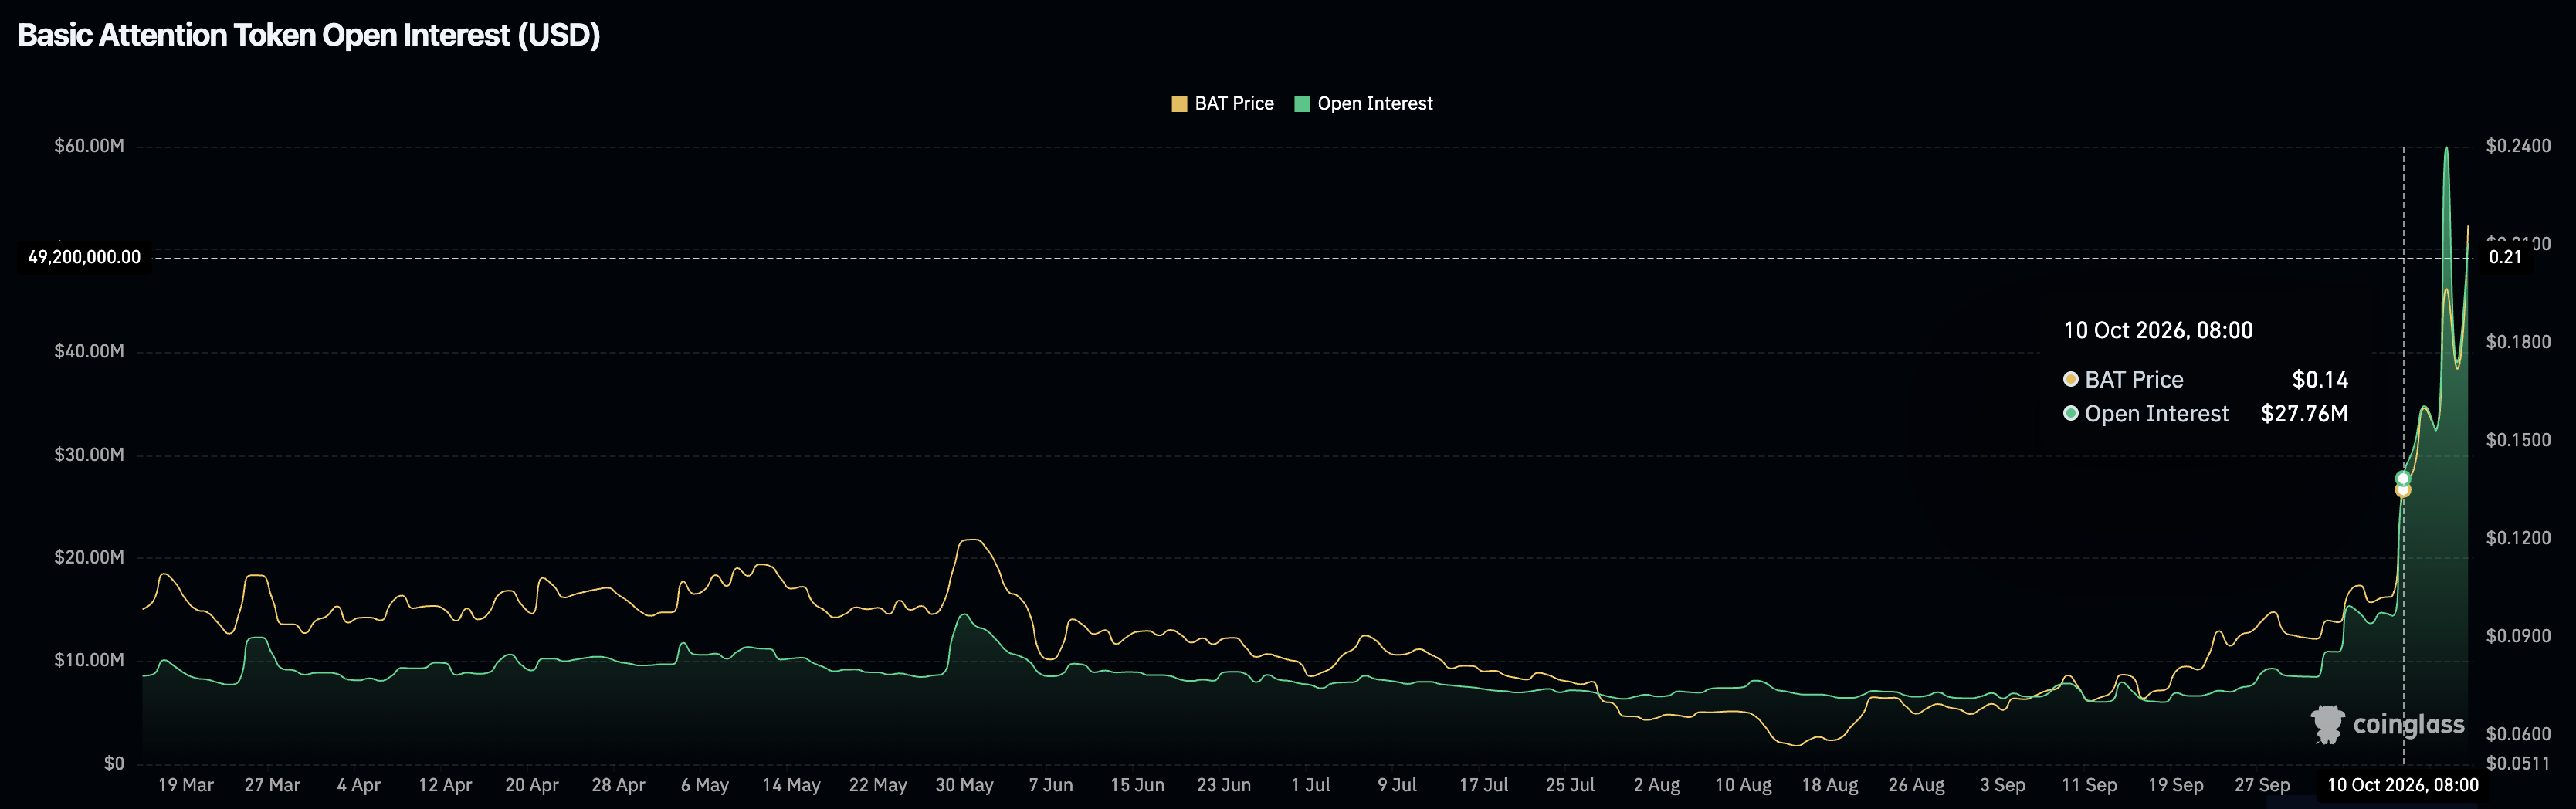
According to market analysis by Xiaobing, a contributor to TechFlow, BAT futures open interest (OI) surged by 60% in a single day on October 10, indicating a rapid expansion in leveraged positions. By October 12, BAT was still rising, but trading volume had fallen by 16%, suggesting that trading activity had weakened even as the price advanced. Meanwhile, participation in leveraged markets may have been increasing.
BAT’s Relative Strength Index (RSI) also climbed to 87.91, entering deeply overbought territory and indicating strong short-term price momentum. More notably, perpetual futures funding rates remained negative. Funding rates generally turn positive when long positions become crowded during a rapid price rally. If funding rates remain negative while prices rise, this may indicate that a portion of the market is still positioned short.
Under these conditions, further price gains could force some short sellers to close their positions if their margin becomes insufficient. Such liquidations can generate additional buying demand, creating what is known as a short squeeze and potentially amplifying price volatility.
However, negative funding rates alone do not prove that short positions are continuing to accumulate, nor do they guarantee that short covering will push prices higher. Open interest, trading volume, liquidation data, and subsequent changes in funding rates should all be assessed together.
Data Source: Coinglass
Data Source: Coinglass
BAT On-Chain Smart Money Analysis: Wallet “0xB51B” Shows More Than $200,000 in Unrealized Gains
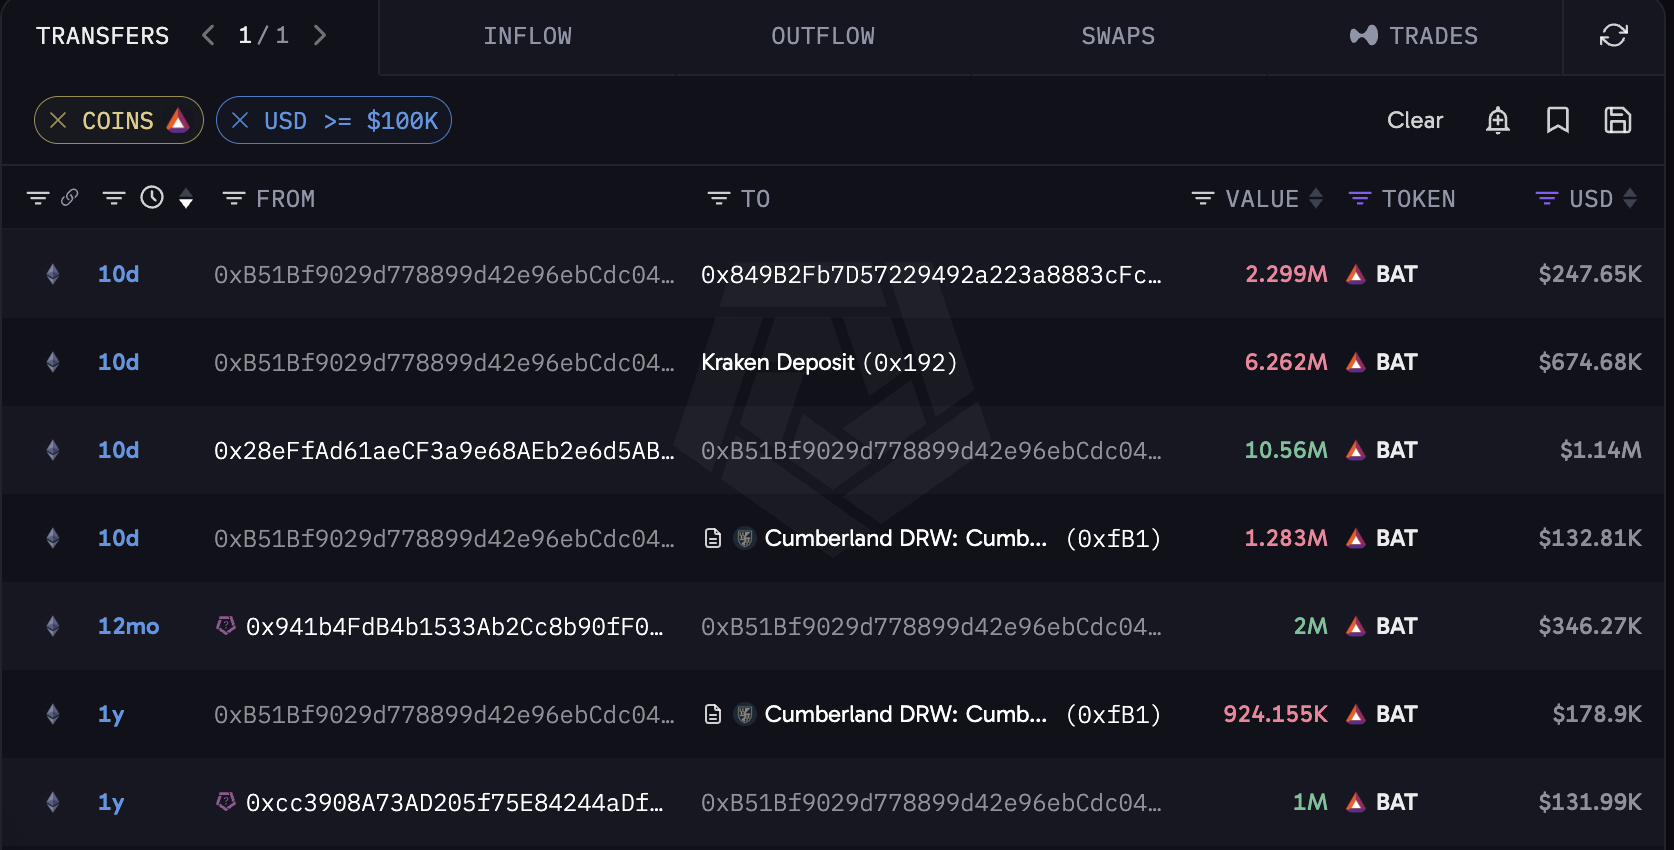
Arkham data indicate that some on-chain addresses have held substantial BAT positions during the token’s latest rally. Transaction records show that wallet “0x28eF” transferred BAT worth approximately $1.14 million to wallet “0xB51B.”
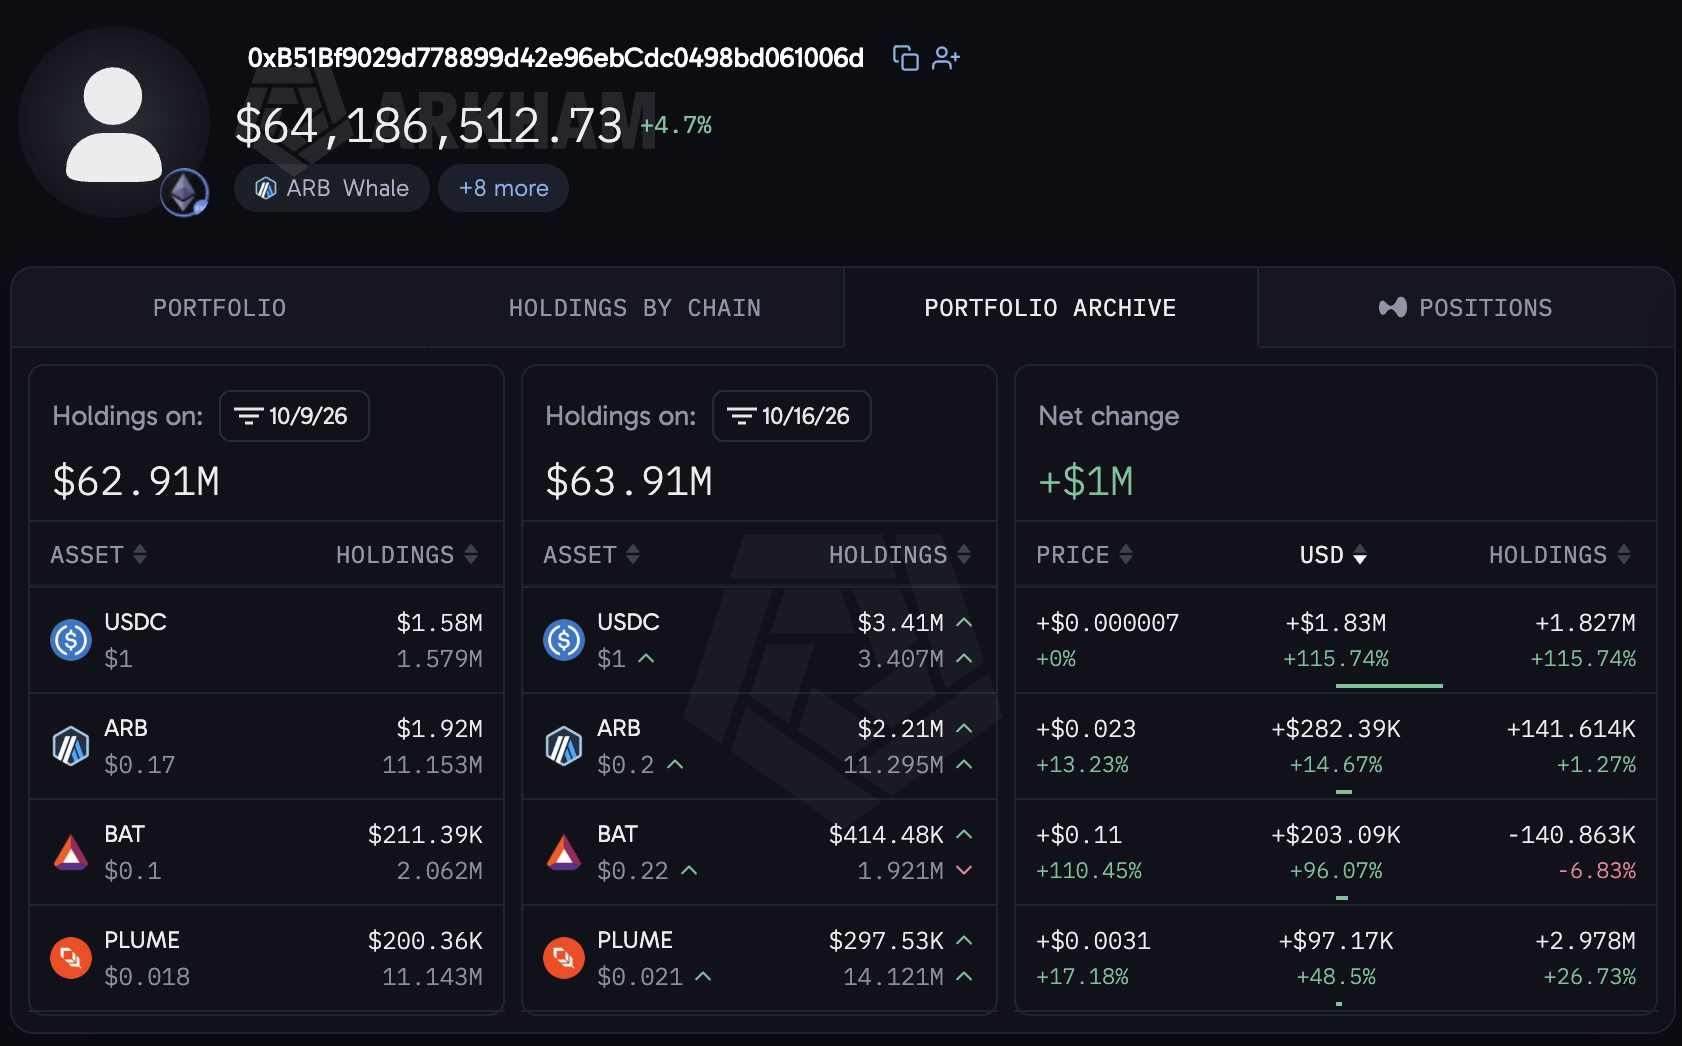
The receiving wallet currently holds around 1.92 million BAT, more than 100,000 fewer tokens than it held the previous week, suggesting that it may have reduced part of its position recently. With BAT nearly doubling in price over a week, estimates based on the assumed cost basis of its holdings suggest that wallet “0xB51B” may have more than $200,000 in unrealized gains.
However, an on-chain transfer does not necessarily represent a purchase. Transfers between wallets may reflect internal fund movements or other transaction arrangements. Transfer records alone therefore cannot establish when the wallet actually accumulated its position or the cost basis of its holdings.
Data Source: Arkham
Data Source: Arkham
Is BAT Still Worth Buying?
BAT has been listed on multiple exchanges for years and is now fully circulating. As a result, short-term price movements are more likely to depend on shifts in market supply and demand, capital flows, and leveraged trading activity.
During the current rally, perpetual futures open interest rose rapidly while funding rates remained negative, making the derivatives market’s long-short positioning worth monitoring. If prices continue to rise, short liquidations could amplify the rally. Conversely, weakening buying demand or concentrated long-position liquidations could accelerate a pullback.
Past price movements in some tokens, including RAVE, have shown how short squeezes can trigger rapid gains. These cases illustrate that derivatives positioning can sometimes become a major driver of short-term price action. However, such moves are highly uncertain, and there is no basis for assuming that BAT will necessarily follow the same pattern.
Investors assessing BAT’s outlook should prioritize three indicators: futures open interest (OI), perpetual funding rates, and trading volume during price advances. If prices rise alongside increasing OI while funding rates remain negative, this may indicate that leverage and short positioning remain elevated. If prices fall while OI drops sharply, the resulting deleveraging could add further downward pressure.
BAT has already recorded substantial short-term gains, and its RSI has entered deeply overbought territory. The risk of chasing the rally should therefore not be overlooked. Investors should assess price action alongside spot demand and derivatives data rather than assuming that negative funding rates necessarily signal further upside.
BAT Price Outlook: Summary
BAT has rallied sharply since mid-August, supported by the expanding Brave browser user base and efforts to broaden its use cases. The token broke above $0.20 on October 14 and is now consolidating at elevated levels. In derivatives markets, rapidly rising open interest and persistently negative perpetual funding rates point to diverging long-short positioning, and further gains could trigger short covering that amplifies the rally. However, BAT’s short-term gains have already been substantial, and its RSI previously reached approximately 87, indicating deeply overbought conditions. Traders should continue monitoring OI, funding rates, and trading volume while remaining alert to profit-taking and potential pullbacks triggered by the unwinding of leveraged positions.
U.S. Stock-Linked Futures: Broad Market Weakness as Several Chip Stocks Fall More Than 10%
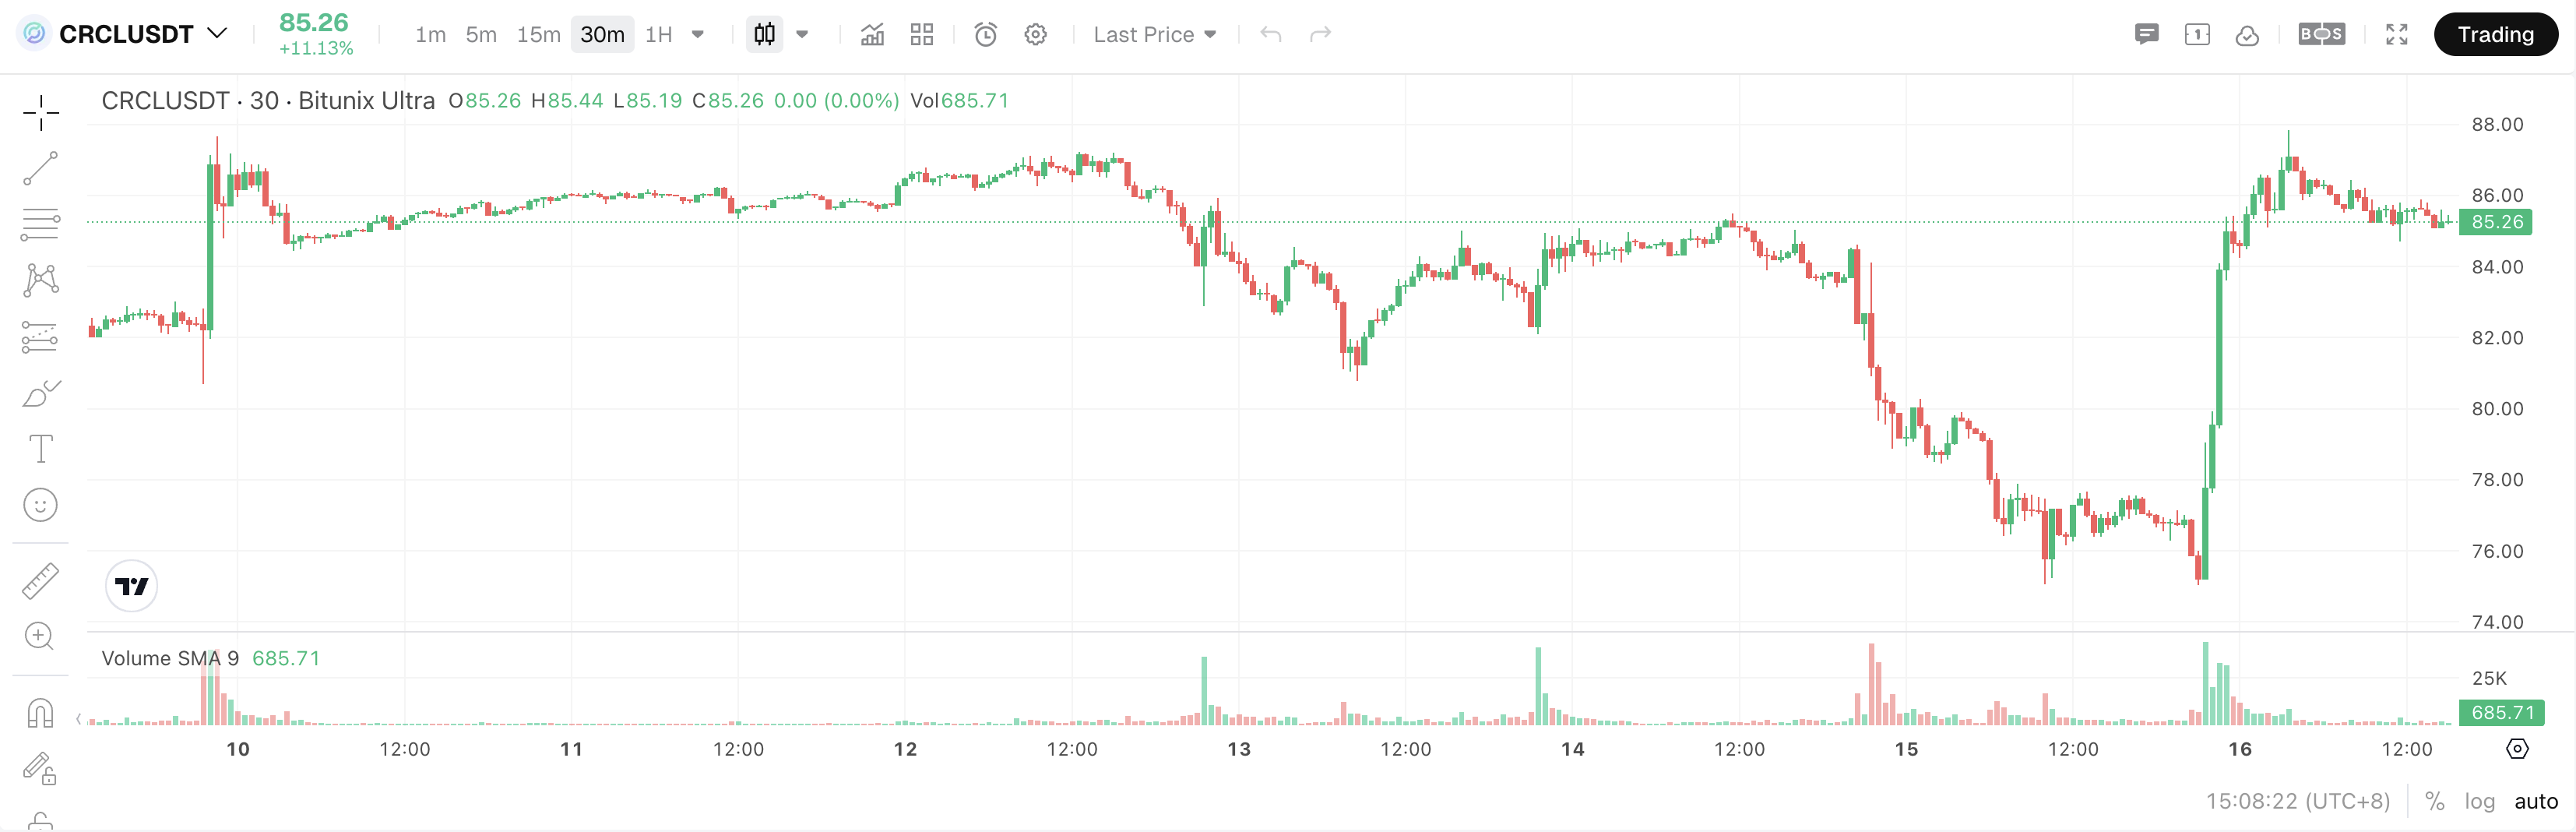
U.S. equities remained under pressure this week as stronger-than-expected CPI data increased expectations of further rate hikes. Semiconductor stocks, many of which had previously recorded substantial gains and tend to exhibit high price sensitivity, experienced broad pullbacks. SanDisk (SNDK) fell another 13% this week after declining 9% last week, taking its cumulative two-week loss to more than 20%. Other chip stocks, including MU, NVDA, and INTC, also moved lower. By contrast, crypto-related stocks showed relative strength. Circle (CRCL) gained 7.50% this week, outperforming the broader U.S. equity market.
Company | Ticker | Core Business | Stock Price | 7-Day Change |
SanDisk | SNDK | Memory | $1,394 | -13.36% |
Micron | MU | Memory | $931 | -10.04% |
NVIDIA | NVDA | GPUs | $217 | -5.65% |
Intel | INTC | CPUs | $95 | -11.21% |
Strategy | MSTR | Cryptocurrency | $151 | 0.00% |
Circle | CRCL | Cryptocurrency | $86 | 7.50% |
Tesla | TSLA | Automobiles | $362 | -3.46% |
Alphabet | GOOG | Internet | $344 | 0.00% |
SpaceX | SPCX | Aerospace | $148 | -7.50% |
Featured Stock-Linked Futures Analysis: Circle’s USDC Becomes the First Significant Stablecoin Designated Under the EU’s MiCA Framework
According to a Cointelegraph report published on October 15, the European Banking Authority (EBA) designated USDC, issued by Circle, as the first significant stablecoin under the EU’s Markets in Crypto-Assets (MiCA) framework. The stablecoin is scheduled to come under the EBA’s direct supervision starting November 12. Following the news, Circle (CRCL) posted a strong performance this week, gaining 7.50% and outperforming the broader U.S. equity market.
Source: Bitunix
Commodity Futures: Most Commodity Prices Edge Lower, While Natural Gas Gains Nearly 3%
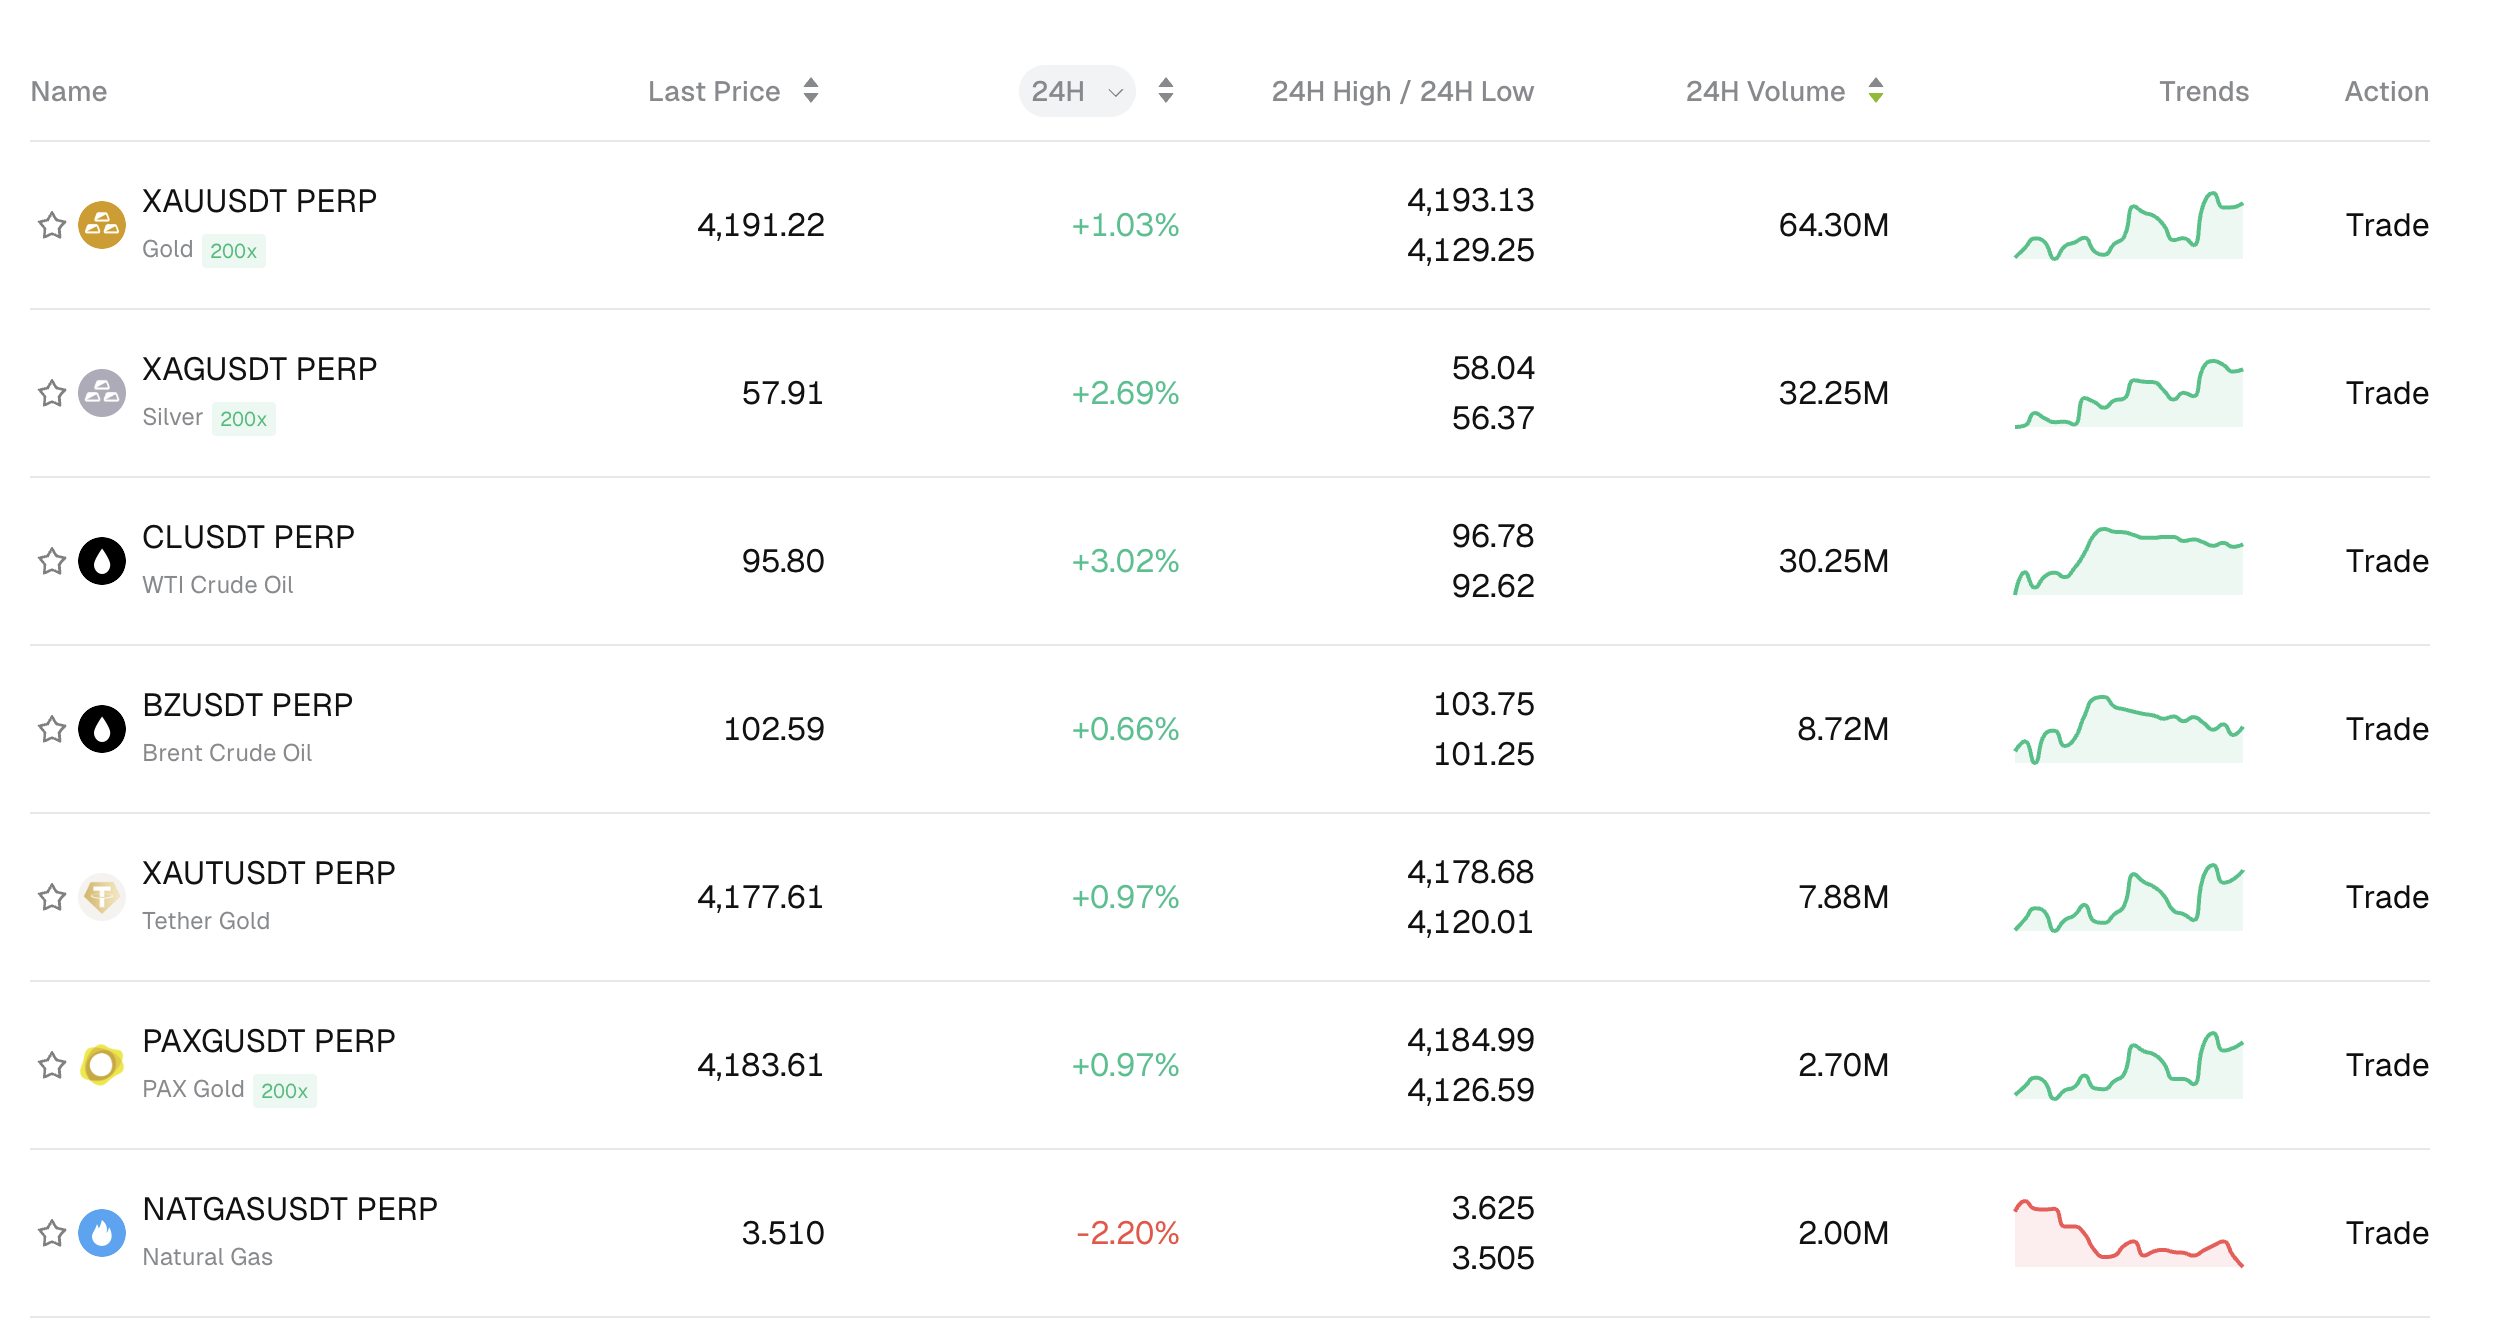
Bitunix offers commodity futures covering gold, silver, crude oil, and natural gas, giving users a broader range of cross-market trading opportunities. Commodity prices generally edged lower this week as expectations of higher interest rates strengthened. Gold briefly fell below $4,100 per ounce. Natural gas, by contrast, showed relative resilience, rising nearly 3% and ranking among the better-performing commodities of the week.
Source: Bitunix
Macro Catalysts: Key Event to Watch Next Week — U.S. EIA Crude Oil Inventories for the Week Ended October 16
Looking ahead, markets will focus on the U.S. Energy Information Administration’s (EIA) crude oil inventory report for the week ended October 16, scheduled for release on October 21. The EIA’s weekly changes in crude oil inventories are an important indicator of U.S. oil supply and demand, reflecting the combined effects of crude supply, refinery demand, and import and export activity on inventory levels.
The previous report showed that U.S. commercial crude oil inventories fell by approximately 8.557 million barrels in the week ended October 9, a substantial decline. Markets will be watching to see whether inventories continue to decrease in the upcoming report.
The difference between the actual inventory change and market expectations will be an important factor in determining short-term oil price movements. A larger-than-expected drawdown generally suggests tighter supply or stronger demand and could support oil prices. Conversely, an unexpected inventory build, or a smaller-than-expected drawdown, may indicate a looser supply-demand balance and put downward pressure on prices.
However, inventory changes are also affected by factors such as imports, exports, and refinery utilization rates. The data should therefore be assessed alongside refined-product inventories, crude oil production, and geopolitical developments.
Changes in oil prices can also affect inflation expectations through their impact on energy costs, potentially influencing U.S. Treasury yields, expectations for Fed policy, and market sentiment toward risk assets such as BTC.
Conclusion
The crypto market came under broad pressure this week, with Bitcoin briefly falling below $80,000, while BAT surged nearly 100% and zero-knowledge-related tokens such as ZK and STRK also posted strong gains, highlighting divergent capital flows across the sector. In U.S. equities, renewed inflation concerns and rising rate-hike expectations weighed on the broader market and several semiconductor stocks, while Circle (CRCL) advanced on news related to USDC’s regulatory status; commodities generally edged lower, although natural gas outperformed. Looking ahead, investors should monitor the upcoming EIA crude oil inventory report and its potential implications for oil prices, inflation expectations, and risk assets, while also tracking leverage and funding-rate dynamics in the crypto market.


