
Reporting Period: October 31 – November 6, 2026 Data as of: November 6, 2026
Market Overview: Democrats Score Major Midterm Election Victory as Tech Stocks Sell Off and Bitcoin Falls Below $76,000
The results of the 2026 U.S. midterm elections are in, with Democrats securing a major victory and regaining control of both the House of Representatives and the Senate, significantly reshaping the political landscape in Congress. Following the election, Democrats moved to advance legislation aimed at banning Super AI, raising concerns about the future of U.S. technology regulation and the broader AI industry. Against a backdrop of policy uncertainty and growing risk aversion, U.S. technology stocks came under heavy selling pressure. The Nasdaq Composite plunged 5.5% in a single trading session, while SanDisk (SNDK) suffered an even steeper decline of 22%, making it one of the session's biggest losers among major technology stocks.
Volatility in U.S. technology stocks quickly spilled over into the cryptocurrency market. Bitcoin (BTC) briefly recovered above $80,000 this week, initially raising hopes of a short-term price rebound. However, following the Democrats' midterm victory and the subsequent sell-off in U.S. tech stocks, investor risk appetite deteriorated rapidly. Bitcoin fell alongside equities, briefly dropping below $76,000. The market reaction highlights the continued correlation between crypto assets and U.S. technology stocks. Going forward, developments in U.S. AI regulation, further valuation adjustments in technology stocks, and changes in market liquidity could all influence Bitcoin and the broader cryptocurrency market in the near term.
The Bitunix Token Pulse Weekly Report tracks the performance of the top 300 cryptocurrencies by market capitalization on Bitunix, while also monitoring major U.S. stock perpetual markets to provide investors with timely market insights and trading perspectives.
Crypto Market Performance: A Mixed Picture as the Broader Market Struggles to Gain Momentum
The cryptocurrency market remained relatively subdued this week. Approximately 50% of the top 300 tokens by market capitalization on Bitunix posted gains, while the median seven-day return stood at -0.06%. Market panic triggered by the earlier Binance security incident has gradually subsided, but the market still lacks a clear catalyst for sustained upside. Bitcoin (BTC) declined 0.78% over the week, while Ethereum (ETH) gained 2.17%, outperforming the broader market. HYPE, meanwhile, fell 12.98%, giving back nearly all of its gains from the previous week.
Top Weekly Gainers: CAP Rallies More Than 30% as No Clear Market Leader Emerges
With no dominant sector driving the broader market, DeFi, Layer 2 networks, and data privacy-related projects were among the better-performing segments this week. CAP surged more than 30%, with its 24-hour gains also exceeding 10%, making it one of the market's biggest highlights. Several blockchain tokens, including STX, ARB, and POL, also gained more than 5%. DeFi projects such as UNI, LIT, and LDO likewise outperformed the broader market.
Top Gainers | Latest Price | 7-Day Change |
CAP | $0.11 | 34.54% |
PIEVERSE | $1.25 | 31.16% |
STX | $0.34 | 25.35% |
LIT | $3.39 | 24.07% |
POL | $0.09 | 11.52% |
Source: Bitunix. Prices and percentage changes were recorded at 2:00 AM UTC.
Top Weekly Losers: No Broad-Based Sell-Off as XPL Becomes the Only Token to Fall More Than 20%
Unlike the sharp correction in U.S. equities, the cryptocurrency market did not experience widespread selling pressure this week, with losses remaining relatively contained across most tokens. XPL dropped 21.65%, making it the worst-performing token over the past seven days and the only asset on the list to decline by more than 20%. Meanwhile, PONS, ORCA, and HYPE, all of which appeared among the previous week's top gainers, fell more than 10%, suggesting that some previously strong-performing assets are facing increased profit-taking pressure.
Top Losers | Latest Price | 7-Day Change |
XPL | $0.06 | -21.65% |
M | $0.82 | -18.82% |
PONS | $0.18 | -17.12% |
ORCA | $1.34 | -13.06% |
HYPE | $77.60 | -13.05% |
Source: Bitunix. Prices and percentage changes were recorded at 2:00 AM UTC.
Hot Token Analysis: CAP – A DeFi Protocol Built Around Yield-Bearing Stablecoins and On-Chain Credit Mechanisms
CAP is the native governance token of Cap, a decentralized stablecoin protocol primarily deployed on MegaETH, a high-performance blockchain. The project aims to build financial infrastructure that combines stablecoin liquidity, on-chain yield management, and risk protection mechanisms.
Cap's core products include cUSD and stcUSD. cUSD is a synthetic dollar backed by a diversified reserve of stablecoins and institutional-grade dollar assets, designed to maintain a 1:1 redemption mechanism. stcUSD is the yield-bearing version of cUSD. Users can stake cUSD to receive stcUSD and participate in the yields generated by the protocol. As the protocol's governance token, CAP is primarily used to participate in governance and related decision-making processes.
CAP Technical Analysis: Short-Term Rally Sets a New All-Time High as MACD Golden Cross Signals Strengthening Momentum
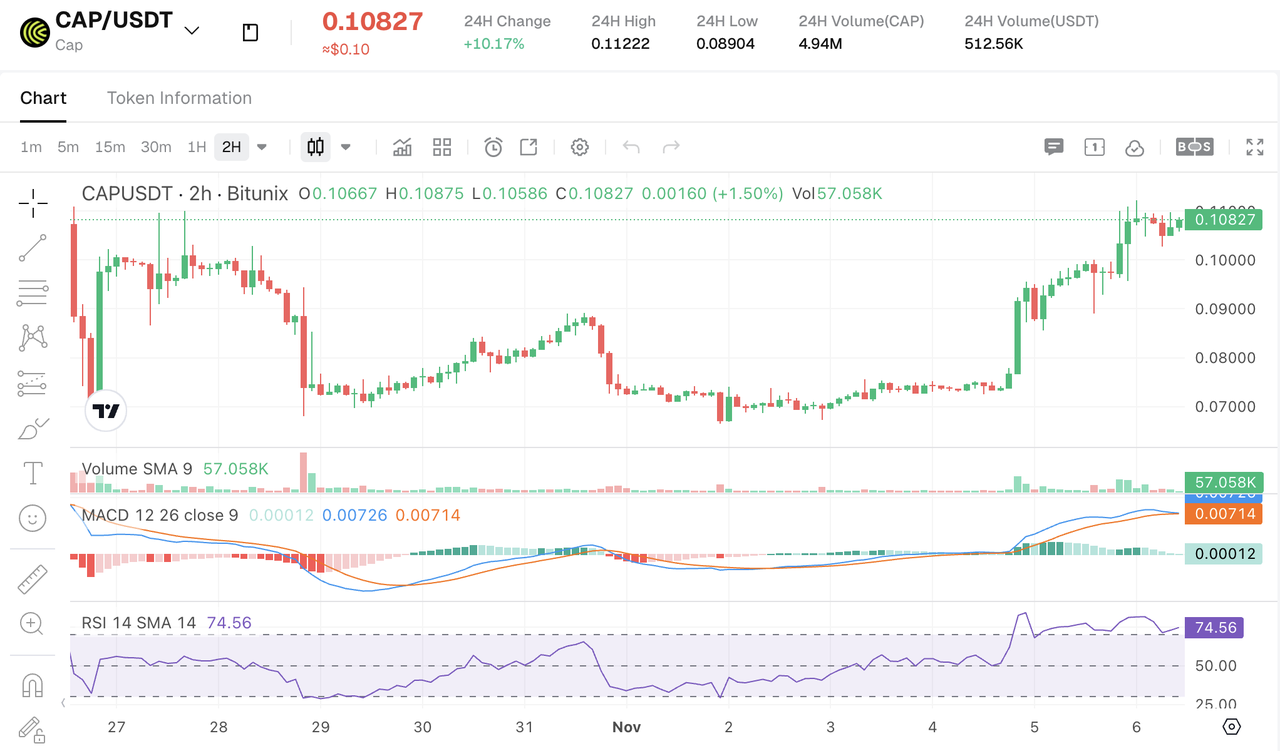
CAP completed its Token Generation Event (TGE) in June 2026 at an initial price of approximately $0.032. Since being listed on multiple exchanges, the token has generally followed a volatile upward trajectory and has now broken above $0.10.
From a technical perspective, the Moving Average Convergence Divergence (MACD) indicator can help assess changes in CAP's short-term momentum. On November 5, CAP's one-hour candlestick chart recorded a long bullish candle, triggering a sharp price increase. At the same time, the MACD indicator formed a bullish crossover, also known as a golden cross. CAP continued to trade higher over the following hours, suggesting that short-term buying momentum was strengthening.
Source: Bitunix
CAP Fundamental Analysis: TVL Continues to Decline While Protocol Fees Remain Relatively Stable
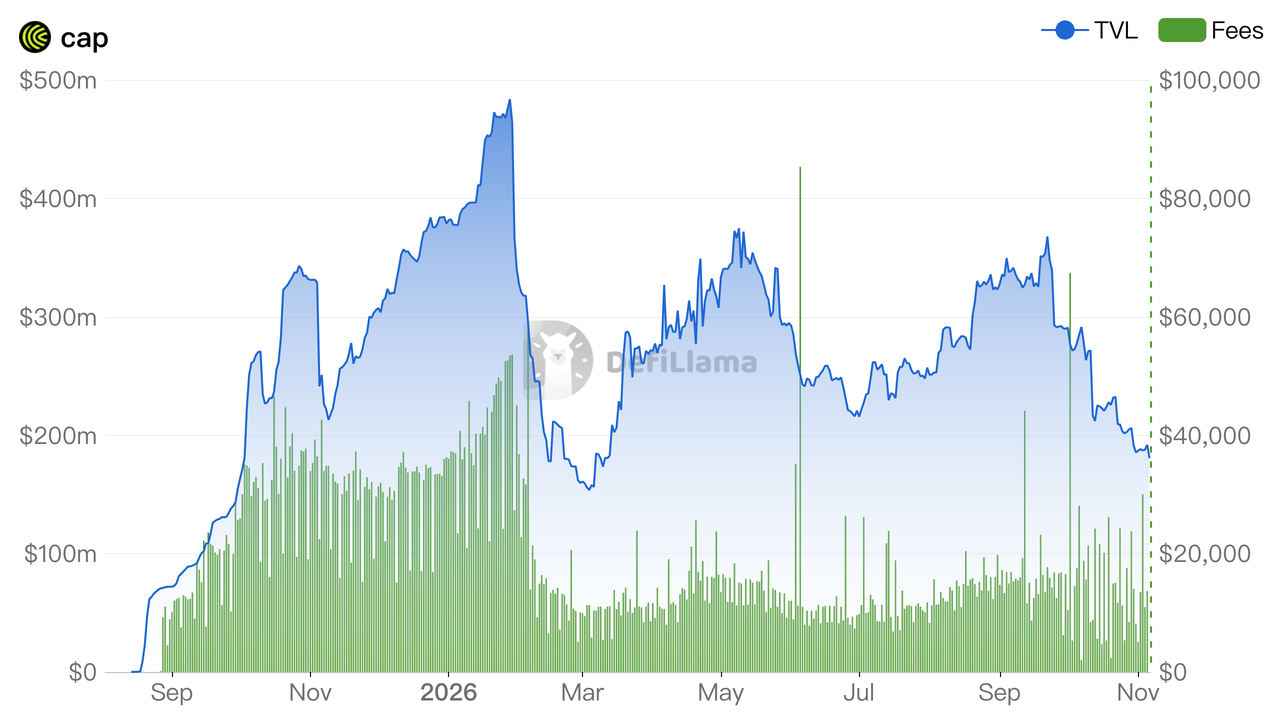
Cap's total value locked (TVL) has followed a downward trend throughout the fourth quarter of 2026. From nearly $300 million at the end of the third quarter, TVL has declined to approximately $180 million. By comparison, protocol fees have remained relatively stable during Q4, averaging around $10,000 per day.
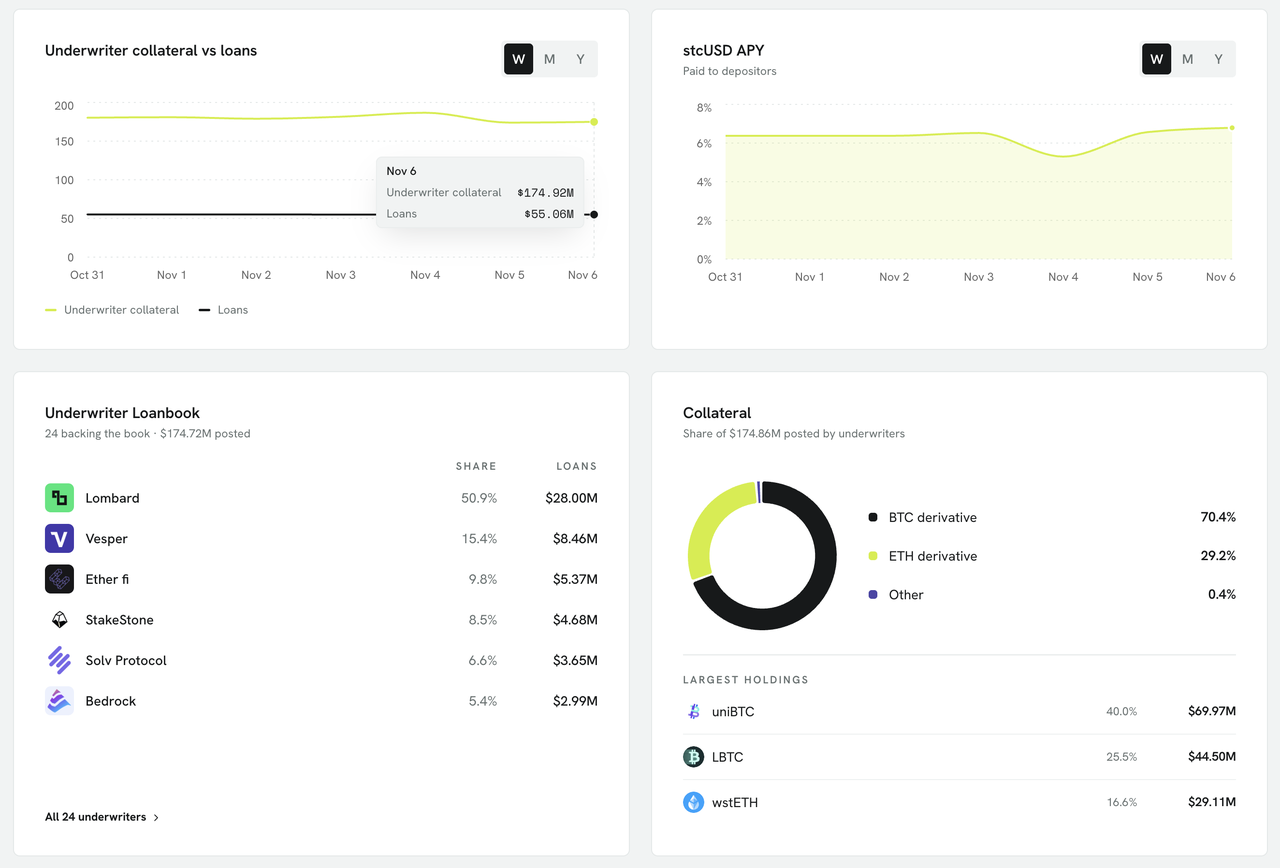
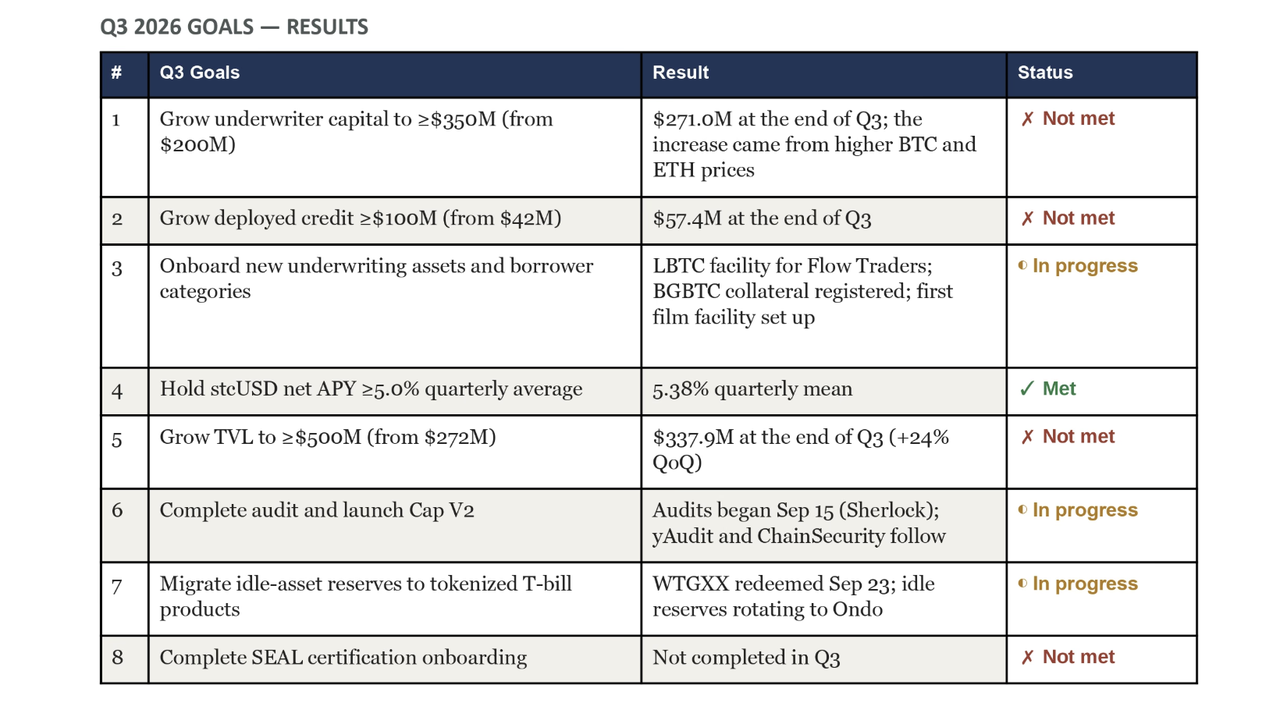
As a DeFi protocol built around stablecoins and on-chain credit mechanisms, Cap accepts collateral assets including Wrapped Bitcoin (WBTC) and Wrapped Ethereum (WETH). In the third quarter, the protocol published its performance figures, but several metrics fell short of its original targets. For the fourth quarter, one of its primary development objectives is the launch of Cap V2.
Recent on-chain data has yet to show meaningful growth in protocol activity, with TVL actually declining. This suggests that CAP's latest rally may not be directly driven by an improvement in the protocol's fundamentals. Instead, capital inflows and broader market sentiment may be playing a more significant role in supporting the token's price.
Source: DefiLlama
Source: Cap.app
Source: Cap.app
CAP On-Chain Trading: PancakeSwap Infinity CLAMM Becomes the Largest On-Chain CAP/USDT Liquidity Pool
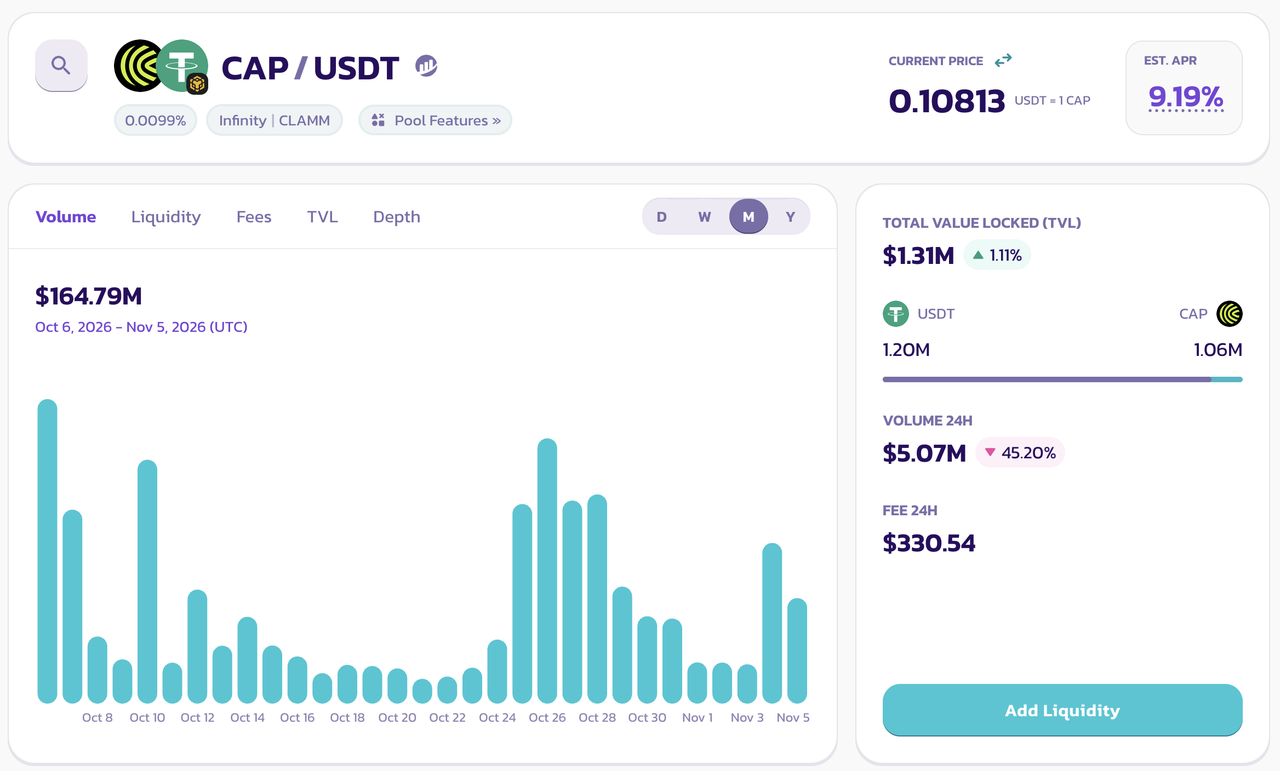
Although CAP is listed on several centralized exchanges, South Korean exchange Upbit currently accounts for the largest share of its trading volume. Its 24-hour trading volume stands at approximately $22 million, representing around 35% of total market volume. In the on-chain market, PancakeSwap Infinity CLAMM has become the largest CAP/USDT liquidity pool. The pool recorded more than $5 million in trading volume over the past 24 hours, with approximately $1.3 million in total value locked (TVL) and an estimated annual percentage yield (APY) of 9.19%.
Source: PancakeSwap
Is CAP Still Worth Buying?
CAP's recent rally has attracted increasing attention from market participants. In terms of price performance, the token has climbed to more than three times its initial TGE price of approximately $0.032. Given its relatively short trading history, the amount of overhead supply from investors holding at a loss may also be comparatively limited.
However, CAP still carries several risks. First, the latest rally has not been accompanied by clear improvements in the protocol's fundamental metrics. Capital inflows and market sentiment may therefore be the primary drivers behind the price increase. Second, significant trading activity is concentrated on centralized exchanges, meaning on-chain data cannot fully capture the real-time movements of these funds, making it more difficult to assess market conditions.
When evaluating CAP's future price direction, investors should monitor not only the protocol's TVL, fee revenue, and progress toward launching Cap V2, but also trading volume, price momentum, and technical indicators such as MACD. The risks of chasing a sharp short-term rally should also be carefully considered.
CAP Price Outlook: Key Developments to Watch
Since completing its TGE in June 2026, CAP has generally followed a volatile upward trajectory. On November 5, strong short-term buying activity pushed the token above $0.10, accompanied by a MACD golden cross that signaled improving momentum.
From a fundamental perspective, however, Cap's TVL has declined from nearly $300 million at the end of Q3 to approximately $180 million, while protocol fees have remained relatively stable. No significant improvement in the protocol's fundamentals has emerged so far. Overall, CAP's latest rally appears to be driven more by capital inflows and market sentiment than by measurable fundamental growth. Its future performance will depend on trading volume, capital movements, and the rollout of Cap V2, while investors should remain alert to the possibility of a short-term correction.
Weekly Stock Perpetual Performance: U.S. Equities Plunge as Semiconductor Stocks Bear the Brunt of the Sell-Off
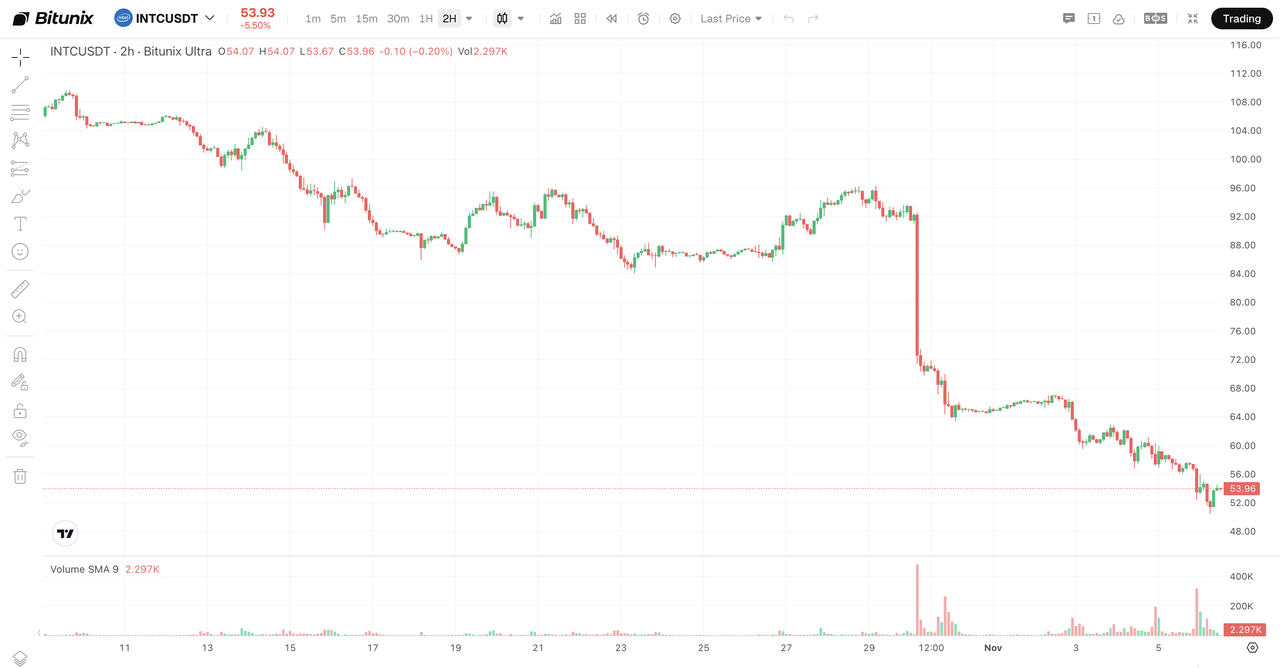
The Democrats' push to advance legislation targeting Super AI triggered a sharp market reaction, sending the Nasdaq Composite down more than 5.5% on November 5. Semiconductor stocks, which had previously benefited from multiple rounds of gains driven by rising AI-related spending, were among the hardest hit as concerns over the proposed legislation intensified. Over the past seven days, SNDK plunged 39.39%, while Intel (INTC) fell 43.47% and Micron (MU) declined 29.76%.
Company | Ticker | Core Business | Stock Price | 7-Day Change |
SanDisk | SNDK | Memory | $806 | -39.39% |
Micron | MU | Memory | $656 | -29.76% |
Nvidia | NVDA | GPUs | $181 | -15.02% |
Intel | INTC | CPUs | $52 | -43.47% |
Strategy | MSTR | Cryptocurrency | $129 | -8.51% |
Circle | CRCL | Cryptocurrency | $69 | -7.50% |
Tesla | TSLA | Automotive | $343 | -13.75% |
Alphabet | GOOG | Internet | $281 | -0.35% |
SpaceX | SPCX | Aerospace | $123 | -13.98% |
Featured Stock Analysis: Intel Plunges More Than 40% This Week as Q4 Guidance Falls Far Short of Expectations
Intel (NASDAQ: INTC) came under heavy selling pressure this week, with its share price falling from approximately $92 at the October 29 close to around $52 on November 5, representing a decline of more than 40%. The sell-off was primarily triggered by the company's fourth-quarter guidance, which came in well below Wall Street expectations.
Although Intel reported third-quarter revenue of $16.5 billion, up 21% year over year, and adjusted earnings per share (EPS) of $0.52, both exceeding market expectations, its Q4 outlook disappointed investors. The company forecast revenue of just $15 billion to $16 billion, below analysts' estimates of approximately $17.1 billion. Adjusted EPS guidance was also set at just $0.25, significantly below the market consensus of $0.44.
The weaker outlook reflects several challenges, including slowing demand in the PC market, rising memory prices, and constraints in chip supply. Management also expects weakness in the PC market to persist at least through the first half of 2027, raising concerns about Intel's near-term revenue growth and profitability.
Source: Bitunix
Commodity Perpetual Analysis: Crude Oil Slides Sharply While Precious Metals Post Modest Gains
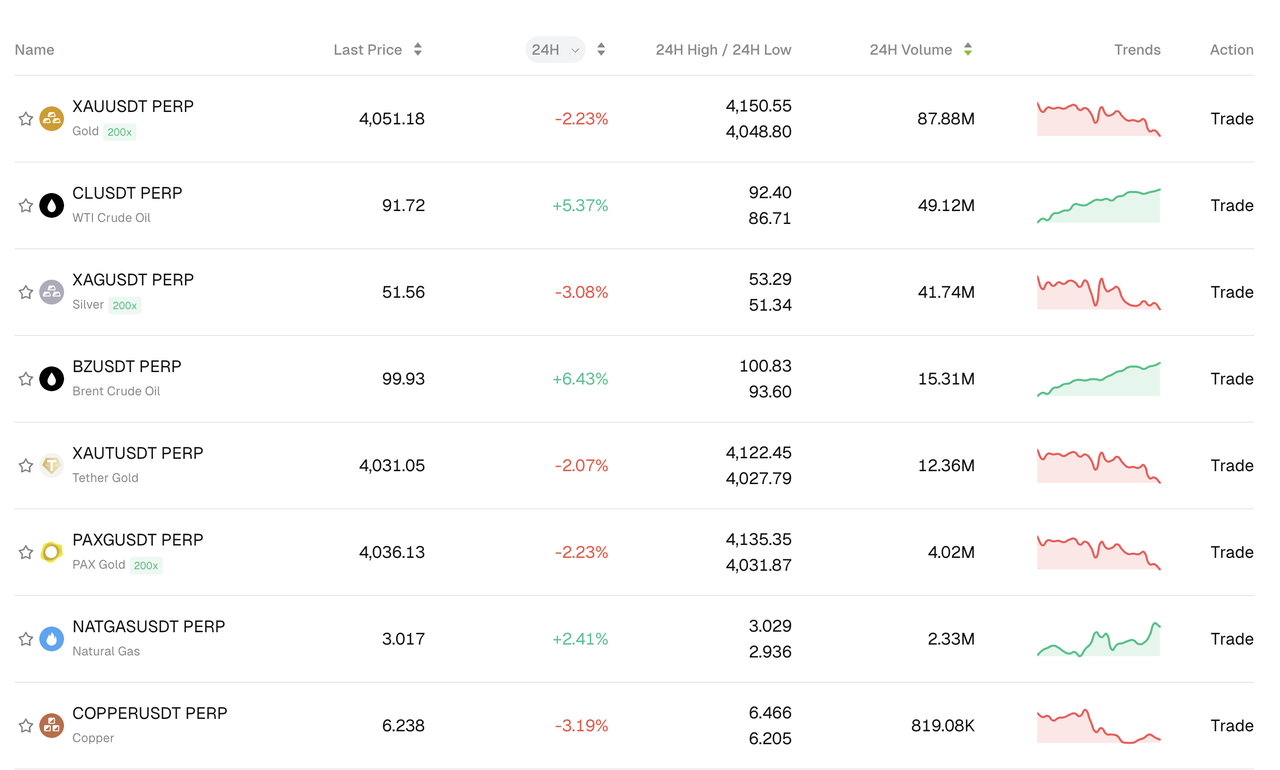
Bitunix offers perpetual contracts for a range of commodities, including gold, silver, crude oil, and natural gas, giving users access to a broader selection of cross-market trading opportunities. West Texas Intermediate (WTI) crude oil experienced a sharp sell-off this week, briefly falling below the $90 level to reach its lowest point in four weeks. In contrast, precious metals posted modest gains, with gold, platinum, and silver each rising by approximately 1% over the week.
Macro Catalysts: What to Watch Next Week – U.S. October CPI Inflation Report
Looking ahead, markets will focus on the U.S. Bureau of Labor Statistics (BLS), which is scheduled to release the October Consumer Price Index (CPI) report on November 10. CPI is a key measure of U.S. inflation, tracking monthly changes in the prices of goods and services purchased by consumers. It is also one of the Federal Reserve's important reference points when formulating monetary policy.
Current market forecasts put the October monthly CPI increase at approximately 0.30%, down from the previous reading of 0.60%. The upcoming release will help investors assess whether inflation in the United States is showing signs of renewed moderation and evaluate the potential implications for future Federal Reserve rate decisions and financial market liquidity.
The gap between the actual CPI reading and market expectations will be an important factor shaping short-term market sentiment. If monthly CPI comes in above expectations, it could indicate that inflationary pressures remain elevated, reducing expectations for Federal Reserve rate cuts. This could strengthen the U.S. dollar and push Treasury yields higher, putting additional valuation pressure on equities and risk assets such as Bitcoin.
Conversely, a lower-than-expected CPI reading could reinforce expectations of easing inflation and potential future rate cuts, improving the outlook for market liquidity and providing support for U.S. equities and crypto assets.
However, a single month's CPI reading can be heavily influenced by fluctuations in energy and food prices. Investors should therefore assess the headline figure alongside core CPI, the Personal Consumption Expenditures (PCE) Price Index, and labor market data to develop a more comprehensive view of the inflation outlook and the Federal Reserve's potential policy direction.
Conclusion
This week, the outcome of the U.S. midterm elections and the Democrats' push for legislation targeting Super AI raised concerns about technology regulation and the future of AI development.
The Nasdaq Composite plunged more than 5.5% in a single session, while semiconductor stocks such as Intel, SanDisk, and Micron experienced particularly heavy selling pressure. The cryptocurrency market remained relatively stable by comparison, with the median seven-day return among the top 300 tokens by market capitalization on Bitunix standing at -0.06%. CAP was the week's standout performer, gaining 34.54%. However, the protocol's TVL continues to decline, and there has yet to be clear evidence of an improvement in its fundamentals.
Looking ahead, markets will focus on the U.S. October CPI report next week. Any significant deviation between the actual reading and market expectations could further influence Federal Reserve rate-cut expectations, valuations across the U.S. technology sector, and the short-term direction of risk assets such as Bitcoin.