
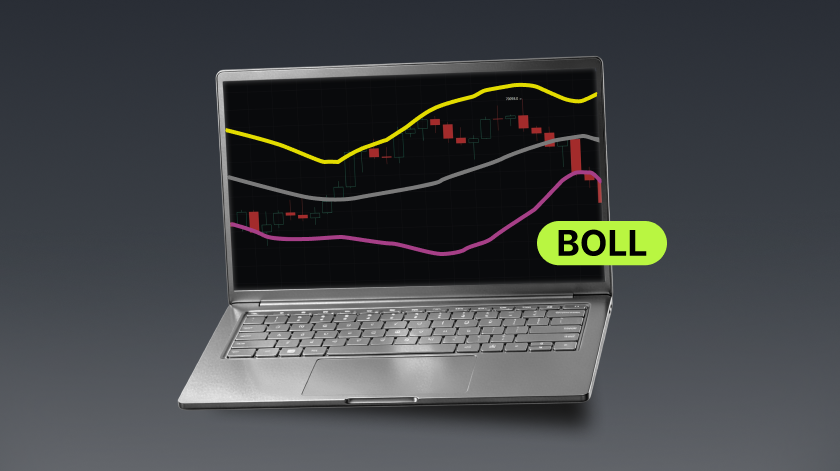
Bollinger Bands (BOLL) Explained: How It Works and Why It Matters
What Are Bollinger Bands (BOLL)?
Without getting into complicated formulas, Bollinger Bands can be understood as a dynamic price channel that automatically adjusts based on market conditions.
Unlike a traditional moving average, which remains as a single fixed line, Bollinger Bands consist of three lines that form a flexible trading channel: the upper band, middle band, and lower band.
When market volatility increases, the channel expands automatically. When price movements become calmer and volatility decreases, the channel contracts and narrows.
BOLL Illustration:
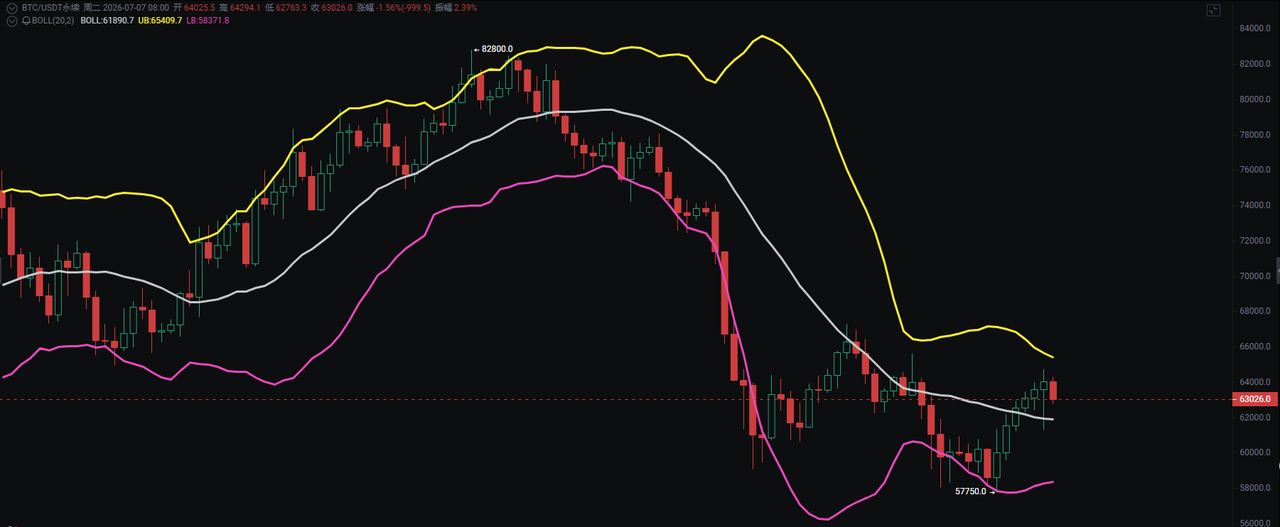
The most practical advantage of Bollinger Bands is their ability to help traders distinguish between ranging and trending markets.
When the bands tighten, it usually indicates a consolidation phase, suggesting that traders should avoid blindly chasing trades. When the bands expand significantly, it may signal the beginning of a strong directional move and potential trend-following opportunities.
Due to this flexibility, Bollinger Bands are widely used across various trading scenarios, including quantitative trading systems (EA), short-term trading, and swing trading strategies.
Key Benefits of Bollinger Bands
Quickly Identify Ranging and Trending Markets
One of the biggest reasons traders use Bollinger Bands is to quickly determine whether the market is moving sideways or entering a strong trend.
Many traders lose money by applying trend-following strategies during consolidation periods or attempting to catch bottoms during strong downtrends. By observing the width of the Bollinger Bands, traders can better understand the current market condition and adjust their strategies accordingly.
Quickly Assess Whether Prices Are Overextended
Bollinger Bands can also help traders identify whether prices have moved too far in either direction.
When the price reaches the upper band, it may indicate that the market has risen significantly in the short term and could face a potential pullback. When the price drops toward the lower band, it may suggest that the market is oversold and could experience a potential rebound.
Anticipate Potential Market Turning Points
A sharp contraction of the Bollinger Bands often indicates low volatility and a period of market indecision between buyers and sellers. This may suggest that a significant price move could be approaching.
When the bands suddenly expand, it often signals that a directional trend has officially begun, providing potential trading opportunities.
Combine with Other Indicators and Alerts to Filter False Signals
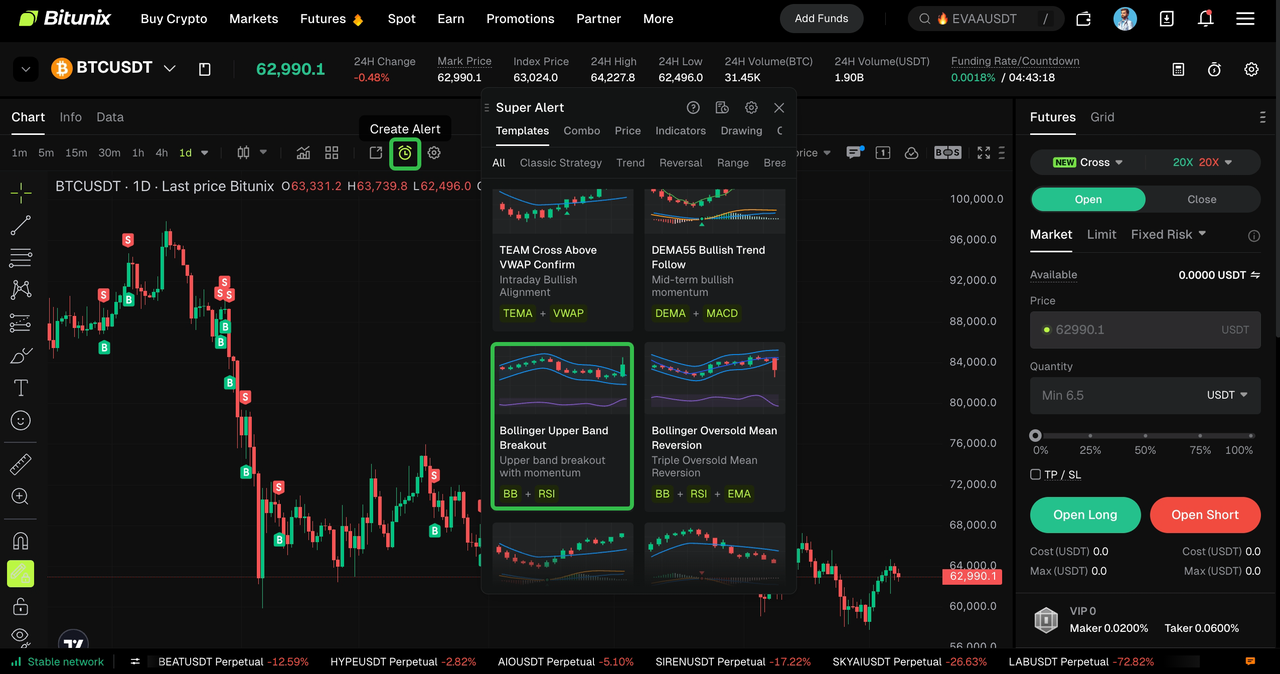
On the Bitunix chart trading interface, traders can access various built-in tools to enhance their strategies. Indicator Alert and Template Alert allow users to quickly create Bollinger Band-based trading setups without constantly monitoring the market.
When price movements trigger Bollinger Band signals, Bitunix can automatically send notifications to help traders respond more efficiently. In addition, Bitunix provides a wide range of professional technical indicators, making Bollinger Bands an essential tool for both beginners and experienced traders.
Bollinger Bands Structure and Key Pattern Applications
The Three Main Bollinger Bands Explained
- Middle Band (BOLL-MID) — The Market Trend Reference Line
The middle band serves as an important reference point for determining market direction.
When the price consistently stays above the middle band, it generally indicates a bullish market bias.
When the price remains below the middle band for an extended period, it suggests a bearish market bias.
When the price repeatedly crosses above and below the middle band, it usually indicates a lack of clear direction and a consolidation phase.
The middle band is also widely used as a key reference for managing open positions and setting dynamic stop-loss or take-profit levels.
- Upper Band (BOLL-UP) — The Short-Term Resistance Level
The upper band can help traders evaluate potential overbought conditions and short-term resistance areas.
In a ranging market, when the price reaches the upper band, it often faces selling pressure and may pull back, creating potential short-selling opportunities.
In a strong bullish trend, the price may continue moving along the upper band, which indicates strong market momentum. Traders should avoid blindly opening short positions against the trend.
- Lower Band (BOLL-DN) — The Short-Term Support Level
The lower band helps traders identify potential support zones and oversold conditions.
In a ranging market, when the price drops toward the lower band, it may rebound, providing potential opportunities for long positions.
During a strong bearish trend, the price may continue declining along the lower band, indicating weak market momentum. Traders should avoid blindly attempting to catch the bottom.
Three Key Bollinger Band Patterns and How to Use Them
1.Band Expansion — Trend Breakout Pattern
When the upper and lower bands rapidly move outward, the Bollinger Band width increases significantly.
Market Interpretation:
This often indicates rising market volatility and concentrated buying or selling pressure, potentially marking the beginning of a strong upward or downward move.
Trading Approach:
Follow the overall market trend and avoid counter-trend trading. During this phase, traders should temporarily avoid range-trading strategies such as selling near resistance and buying near support.
2.Band Contraction — Volatility Squeeze Pattern
When the upper and lower bands move closer together, the Bollinger Band width narrows significantly.
Market Interpretation:
This suggests that buyers and sellers are in a temporary balance, and the market may be preparing for a significant breakout.
Trading Approach:
Avoid opening new positions prematurely. Wait for the price to break decisively above the upper band or below the lower band before following the new trend. This helps reduce the risk of repeated losses during a consolidation period.
3.Parallel Bands — Range-Bound Market Pattern
When the upper and lower bands move horizontally in parallel without significant expansion or contraction, the market is typically in a sideways trading phase.
Market Interpretation:
This indicates ongoing consolidation without a clear long-term upward or downward trend.
Trading Approach:
Traders can use the upper and lower bands as trading boundaries — considering long positions near the lower band and short positions near the upper band. Avoid chasing breakout moves when the market remains range-bound.
Advanced BOLL Confluence Strategy: Combining Multiple Indicators for Better Confirmation
Relying solely on Bollinger Bands can easily lead to false signals, including bull traps and bear traps. To improve trading accuracy, traders should combine multiple technical indicators and look for confluence before making trading decisions.
- With the EMA moving average (EMA20/EMA30): respectively judge the short-term and medium-term overall trend, and determine the direction of the big cycle rise and fall;
- Combining Bollinger Orbit + Trend Line : Through the opening and closing state of the Bollinger Channel, with the trend line, judge the trend start or trend reversal;
- Superimpose key support and resistance levels : in order to identify the true and false breakthroughs of the market, filter out invalid market conditions, and screen high-quality trading positions with profit and loss ratios;
- Reference characteristic K-line pattern: with the help of M head , W bottom , morning star, evening star , engulfing pattern, and other classic reversal K-line, lock in accurate entry points.
Practical Trading Examples
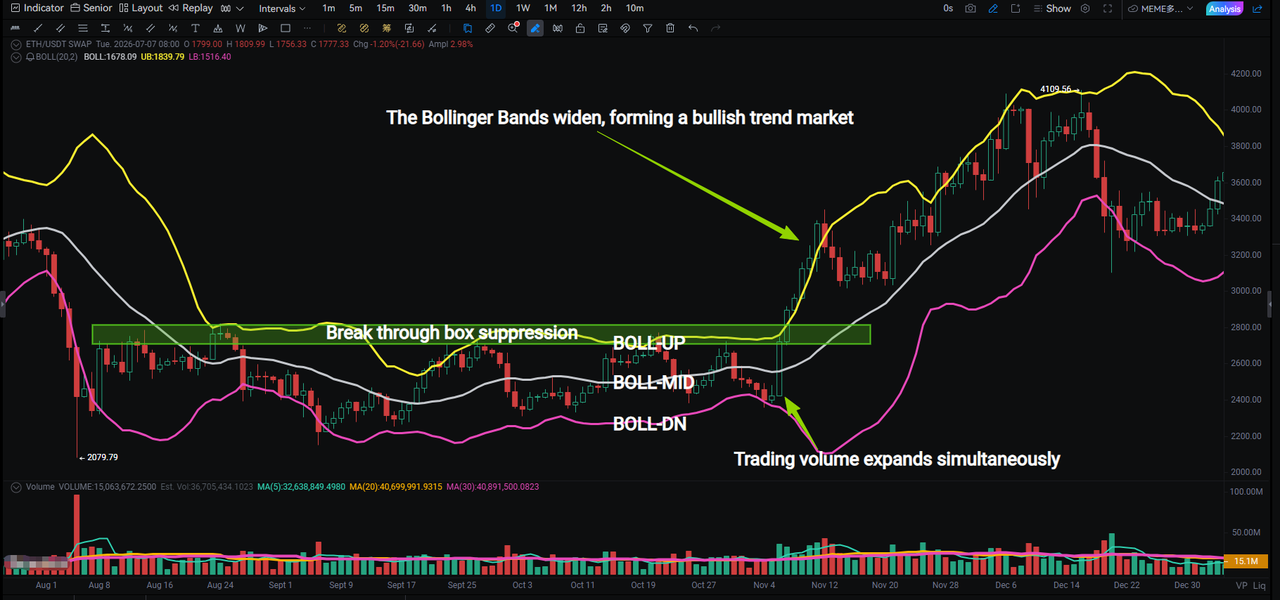
Case 1: ETH/USDT Perpetual Contract (Daily Timeframe — Bullish Bollinger Band Expansion)
Yellow Line: BOLL-UP
White Line: BOLL-MID
Pink Line: BOLL-DN
Step 1: Confirm the Overall Market Structure
The price remains in a long-term sideways consolidation range, with buyers and sellers in balance and no clear trend direction.
At the same time, the Bollinger Bands continue to narrow, with the upper and lower bands moving closer together. This indicates declining market volatility and suggests that the market is building momentum for a potential directional move. The medium- to long-term consolidation structure is waiting for a breakout to determine the next market direction.
Step 2: Capture Key Signals and Confirm the Breakout
The price breaks above the upper boundary of the long-term consolidation range with a significant increase in trading volume, accompanied by a strong bullish candlestick.
Meanwhile, the Bollinger Bands rapidly expand from a narrow range. The upper band turns upward, while the middle band begins to rise simultaneously, confirming the start of a bullish breakout.
Step 3: Identify the Entry Opportunity
Trend-following long entry: On the breakout day, if the candlestick closes firmly above the upper Bollinger Band and trading volume continues to increase, traders can consider entering a long position with a smaller position size to follow the emerging trend.
Step 4: Set Take-Profit and Stop-Loss Levels
Stop-loss:
Place the stop-loss approximately 5% below the lower boundary of the consolidation range. If the price falls back into the previous range, it indicates that the breakout may have failed, and traders should exit promptly to reduce the risk of a false breakout.
Take-profit:
The first take-profit target can be based on the continued expansion of the upper Bollinger Band. Traders may consider taking partial profits near key swing highs.
The second take-profit signal occurs when the Bollinger Bands begin to contract and the price closes below the middle Bollinger Band, indicating weakening bullish momentum. At this point, traders can consider closing the remaining position.
Step 5: Leverage Management Principles
For conservative trading, keep leverage at 10x or below. For aggressive short-term strategies, avoid exceeding 20x leverage.
Limit each position size to no more than 10% of total account capital. Avoid holding oversized losing positions in the hope of recovery.
During a strong bullish trend with continuous Bollinger Band expansion, traders can consider adding positions gradually on pullbacks toward the middle band, while maintaining strict risk control with a stop-loss placed approximately 5% below the middle band.
Case 2: BTC/USDT Perpetual Contract (Daily Timeframe — Bearish Bollinger Band Squeeze Breakout)
Yellow Line: BOLL-UP
White Line: BOLL-MID
Pink Line: BOLL-DN
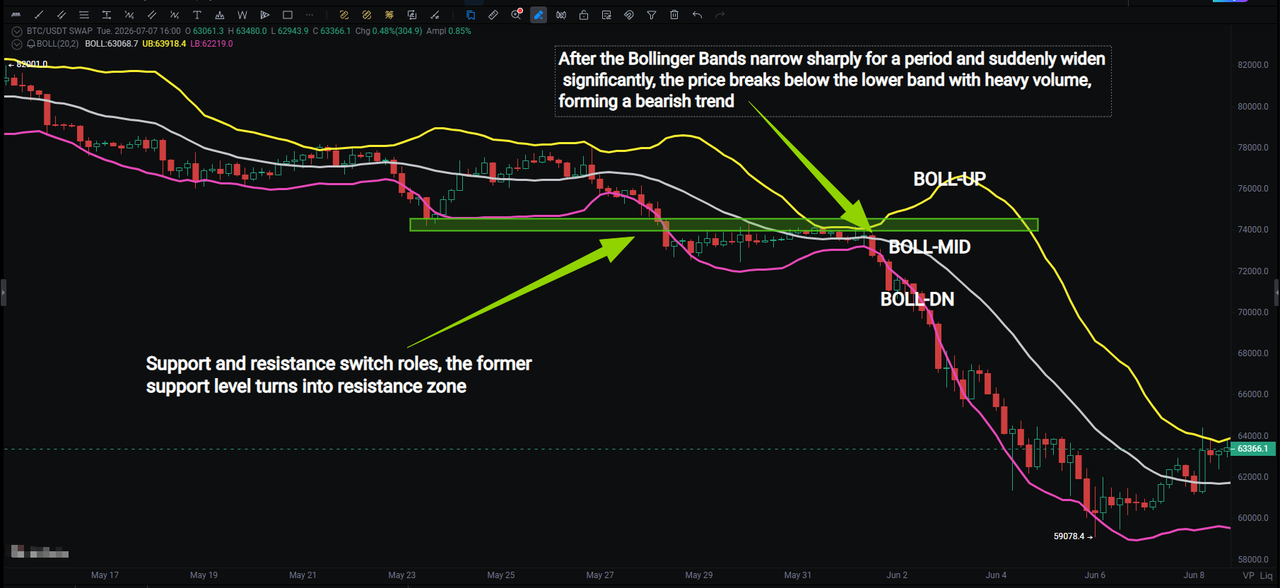
Step 1: Confirm the Overall Market Structure
The price previously moved sideways within the green consolidation range, while the Bollinger Bands remained tightly compressed for an extended period.
The narrowing distance between the upper and lower bands indicates declining market volatility, with buyers and sellers temporarily in balance and the market approaching a potential breakout phase.
The previous consolidation range acted as an important support zone. With no clear long-term directional trend in place, the market was waiting for a decisive breakout to determine the next move.
Step 2: Capture Key Signals and Confirm the Breakdown
After an extended period of contraction, the Bollinger Bands suddenly expanded downward. The upper band turned lower, while the middle band also began moving downward, signaling the opening of bearish momentum.
The price broke below the consolidation support zone with increased trading volume. The previous support area completed a support-to-resistance flip, becoming a new resistance zone.
The breakout candlestick also closed below the lower Bollinger Band, confirming the bearish breakdown and the beginning of a downward trend.
Step 3: Identify the Entry Opportunity
Trend-following short entry: On the breakdown day, if the price breaks below the consolidation range and the lower Bollinger Band with strong volume, accompanied by a large bearish candlestick, traders can consider entering a short position to follow the downward trend.
Step 4: Set Take-Profit and Stop-Loss Levels
Stop-loss: Place the stop-loss approximately 5% above the upper boundary of the previous resistance zone. If the price moves back above the consolidation range, it suggests that the bearish breakdown has failed, and traders should exit quickly to avoid losses from a false breakdown.
Take-profit: The first take-profit target can be set around the new swing lows formed as the lower Bollinger Band continues extending downward. Traders may consider taking partial profits near these lows.
The second take-profit signal occurs when the Bollinger Bands begin to contract and the price closes back above the middle Bollinger Band. At this point, traders can consider closing the remaining position.
Step 5: Leverage Management Principles
For conservative trading, keep leverage at 10x or below. For aggressive short-term strategies, avoid exceeding 20x leverage.
Limit each position size to no more than 10% of total account capital and avoid holding oversized losing positions.
During a sustained bearish trend with Bollinger Bands expanding downward, traders can consider adding short positions gradually on rebounds toward the middle band, while maintaining strict risk control with a stop-loss placed approximately 5% above the middle band.
Bollinger Bands (BOLL): Common Mistakes and Trading Tips
1.Filter Short-Term False Breakouts
Sudden price wicks and news-driven volatility can create false Bollinger Band expansion signals and fake breakouts. Traders should wait for candlestick closes to confirm that a breakout is valid instead of entering trades based on short-term intraday price movements.
On the platform, traders can add candlestick close confirmation conditions to alerts to improve signal reliability.
2.Avoid Relying on a Single Indicator
Bollinger Bands should not be used as the only tool for making trading decisions.
Traders should combine BOLL with trend indicators, price levels, and candlestick patterns to achieve multi-factor confirmation. The platform supports customized indicator combinations and templates, allowing traders to build strategies based on their own trading preferences.
3.Adjust Long and Short Strategies According to Market Trends
Follow the overall market direction:
Focus on long positions during bullish trends.
Focus on short positions during bearish trends.
Avoid trading against major market trends or holding losing positions while continuously adding to positions in an attempt to reduce the average entry price.
4.Avoid Trend-Following Strategies During Range-Bound Markets
When Bollinger Bands remain compressed for an extended period and prices continue moving sideways, avoid applying breakout strategies blindly. Do not chase price movements during consolidation periods, as this may lead to frequent stop-loss triggers.
5.Prioritize Medium- and Long-Term Timeframes
Whenever possible, use daily charts and longer timeframes for market analysis and trading decisions. This helps reduce noise from short-term price fluctuations and improves the stability and reliability of trading signals.
Disclaimer
This article is not intended to provide:
(i) investment advice or investment recommendations;
(ii) an offer or solicitation to buy, sell, or hold digital assets; or
(iii) financial, accounting, legal, or tax advice.
Digital assets you hold, including stablecoins and NFTs, involve significant risks and may experience substantial price volatility. You should carefully consider whether trading or holding digital assets is suitable for you based on your financial circumstances.
For advice specific to your situation, please consult your legal, tax, or investment professionals. You are solely responsible for understanding and complying with all applicable local laws and regulations.
About Bitunix
Bitunix is a global cryptocurrency derivatives exchange trusted by over 3 million users across more than 100 countries. At Bitunix, we are committed to providing a transparent, compliant, and secure trading environment for every user. Our platform features a fast registration process and a user-friendly verification system supported by mandatory KYC to ensure safety and compliance. With global standards of protection through Proof of Reserves (POR) and the Bitunix Care Fund, we prioritize user trust and fund security. The K-Line Ultra chart system delivers a seamless trading experience for both beginners and advanced traders, while leverage of up to 200x and deep liquidity make Bitunix one of the most dynamic platforms in the market.
Bitunix Global Accounts
X | Telegram Announcements | Telegram Global | CoinMarketCap | Instagram | Facebook | LinkedIn | Reddit | Medium