Chat with us, powered by LiveChat

Complete Guide to Bitunix Futures Terminology (Web)

Update Time:2026/09/2211 mKerwin Yi76K
Complete Guide to Bitunix Futures Terminology (Web)

Quick Information Summary

Item

Details

Platform

Bitunix — Futures Trading (Web)

Article Focus

Web futures page terminology across 5 UI zones

Contract Type

Perpetual futures (e.g. BTCUSDT) — no fixed expiry

Key Prices

Last trade · Mark price (PnL/liquidation) · Index price (fair value / funding basis)

Margin Modes

Cross (full position) · Isolated (per position)

Asset Modes

Single-Asset (USDT margin; Cross + Isolated) · Multi-Asset (cross collateral; Cross only)

Leverage (example)

Up to 200× on BTC/USDT & ETH/USDT perpetuals (pair limits apply; UI may show 100×, 200×, etc.)

Funding Rate

Typically every 8 hours (UTC+8: 00:00, 08:00, 16:00); some low-liquidity pairs may settle hourly

Funding Direction

Positive: longs pay shorts · Negative: shorts pay longs

Trading Fees (example UI)

Maker 0.0200% · Taker 0.0600% — live rates vary; Bitunix VIP may offer up to ~87% fee discounts

Fee Charging

Applied on order execution; funding at countdown settlement

Chart Stack

TradingView-style K-line, drawing tools, alerts, quick order panel

Advanced Exits (web positions)

Batch TP/SL · Trailing TP/SL · Position TP/SL · Market close · One-click reverse

Related

App terminology guide · Margin · Leverage · TP/SL · 4 TP/SL methods · Academy

Product Definition— Why Learn Futures Terms?

The Bitunix futures web layout packs market data, charting, execution, and risk metrics on one screen. Understanding labels helps you:

  • Read sentiment — funding, long/short ratio, 24h range and volume

  • Avoid surprise liquidation — mark price, margin ratio, maintenance margin, est. liquidation price

  • Control costs — maker vs taker, VIP tiers, funding interval

  • Execute precisely — limit/market/planned orders, units, batch and trailing exits

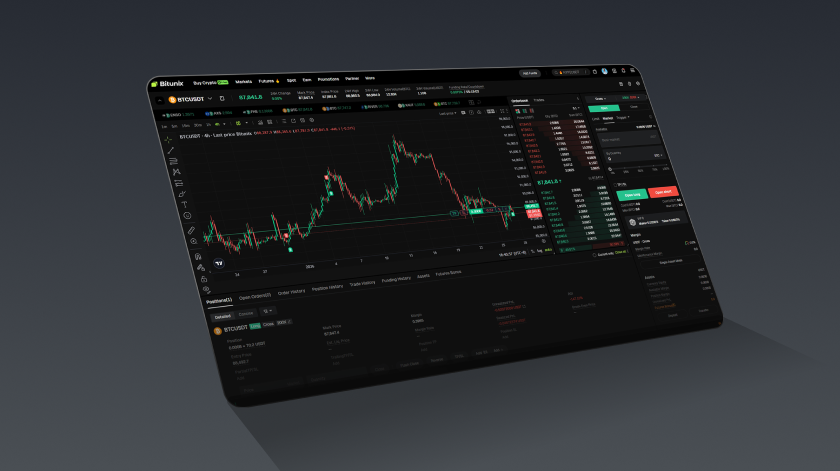
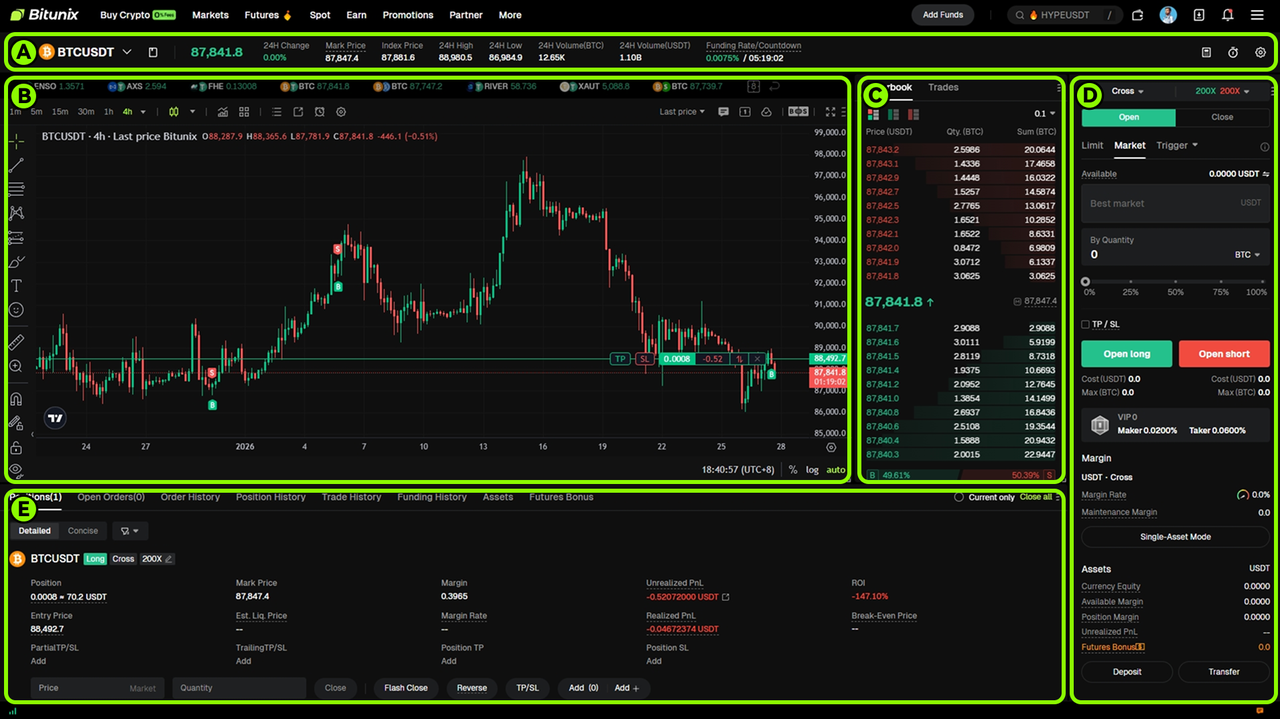
Web Layout — Five Areas (Top → Bottom, Left → Right)

  1. Top bar above chart — pair, 24h stats, mark & index, funding countdown

  2. K-line (candlestick) panel — analysis, drawing tools, TradingView alerts

  3. Order book — depth, latest print, long/short mix

  4. Order panel — margin, leverage, order type, size, TP/SL, fee rates

  5. Positions / orders table (below chart) — live PnL, advanced close tools

Bitunix Futures Page Overview (Web)

We explain the key fields on the Bitunix Futures page from left to right across five main areas.
1、 Top Bar Above the Candlestick Chart

Panel display items (from left to right)

Meaning and function

BTCUSDT (perpetual contract)


The current view shows the Bitcoin (BTC) to Tether (USDT) trading pair for a perpetual contract, which has no expiry date. As long as your position is not liquidated, it can be held continuously.

24H rise and fall 0.10%


The percentage change in the contract price over the past 24 hours, indicating the price is up 0.10% compared with 24 hours ago.

87818.4 (marked price)


The mark price used to assess position risk and determine the reference price for liquidation. It is derived from a weighted pricing mechanism and helps reduce abnormal liquidations caused by price manipulation or short term spikes in a single market price.

87855.7 (Index Price)


A fair reference price calculated from a weighted average of BTC/USDT prices across multiple major exchanges. It is used as the basis for estimating reasonable prices and calculating the funding rate.

24H highest/lowest 88,980.5/86,984.9


The highest and lowest prices reached by the contract over the past 24 hours.

24H Volume (BTC) 12.69K


The total traded volume of the contract over the past 24 hours, shown in BTC. 12.69K means approximately 12,690 BTC.

24H Volume (USDT) 1.10B


The total trading turnover of the contract over the past 24 hours, shown in USDT. 1.10B means approximately 1.1 billion USDT.

Funding rate/Countdown 0.0074%/00:04:49


Funding rate: A mechanism that helps keep perpetual contract prices aligned with the spot index price and reflects market sentiment. Positive rate: longs pay shorts.

Negative rate: shorts pay longs. Funding is generally settled every 8 hours.

Note: For some low liquidity or highly volatile, newly listed coins, the platform may use more frequent funding intervals (for example, hourly), which can increase trading costs.

Settlement time (UTC+8): 08:00, 16:00, 00:00.

Funding rate: 0.0074% is the funding rate to be settled in the next cycle.

Countdown: 4 hours and 49 minutes remaining until the next funding settlement. If you hold a long position in the BTCUSDT perpetual contract with a notional value of 10,000 USDT, the funding payment at settlement would be 0.74 USDT (10,000 × 0.0074%). With a positive funding rate, this amount is paid by the long position holder to the short position holder.

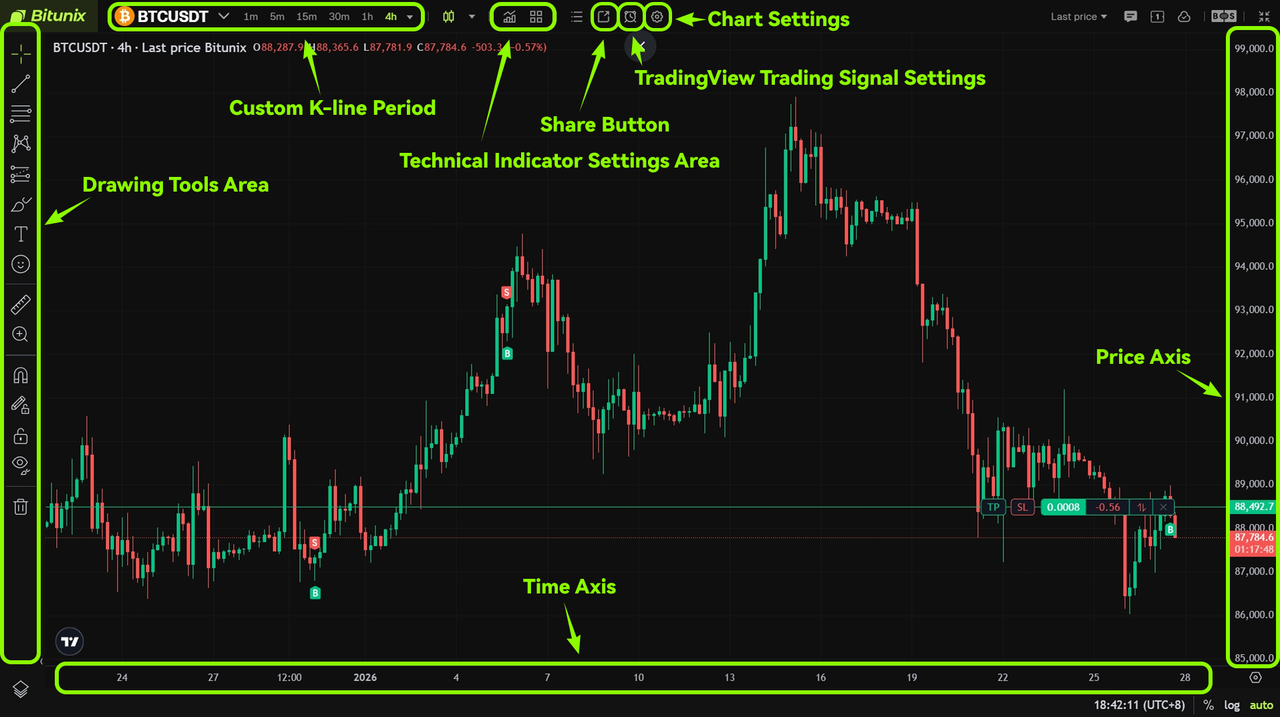
2、Candlestick Chart (K-line) Panel

Panel display items (from left to right)

Meaning and function

Line drawing tool area (left)


Provides a range of technical analysis drawing tools to mark key price levels and chart patterns.
Example:

Support/Resistance Line: marks support and resistance levels where price repeatedly reacts, helping you identify key highs and lows.

Fibonacci Split Line: a common tool for identifying potential pullback or rebound levels and helping locate entry or exit points.

Trend line: connects multiple swing highs or swing lows to judge whether a trend is continuing. If it breaks, it may signal a trend reversal.

Channel line: defines a price channel and helps assess potential overbought or oversold areas within that range.

Custom K-line period (top left)


Switch K-lines with different time periods to adapt to different trading styles.

5 points/15 points/30 points: suitable for short-term trading and capturing short-term price fluctuations.

1 hour/4 hours: suitable for swing trading and tracking mid-term trends.

Daily/weekly chart: suitable for trend analysis and understanding longer-term market direction.

Technical indicator setting area (top middle)

Add, modify, or delete technical indicators such as MA (Moving Average), MACD, RSI, and more. You can also customize indicator parameters to help evaluate trend strength, momentum, and overbought or oversold conditions.

Share button (top right)

Generate a link or image of the current K-line chart with one click for easy sharing with other traders.

TradingView Trading Signal Settings (top right)


Set up trading reminders based on indicators or price conditions. When the market meets your preset conditions, the system will send push notifications.

TradingView alerts can deliver real-time notifications when your custom conditions are triggered, helping you respond quickly to potential opportunities and entry signals.
Click to learn: How to access TradingView’s signal alerts

Chart settings (top right)


Customize the chart’s colors, style, and background, as well as the display of the price axis and timeline, to create a personalized analysis interface.

K-line bar (main area of the chart)


Each candlestick shows the open, high, low, and close prices for the selected period. Green typically indicates a price increase (close above open), while red indicates a price decrease (close below open).

To make trading more efficient and improve your experience, we recommend:

Click to learn: Quick Order Panel Guide

Price axis (right)


Displays the price scale for the current market, making it easier to read the absolute price level on the chart.

Timeline (bottom)


Displays the time scale for the K-line chart, used to locate historical market trends and analyze how prices change over time.

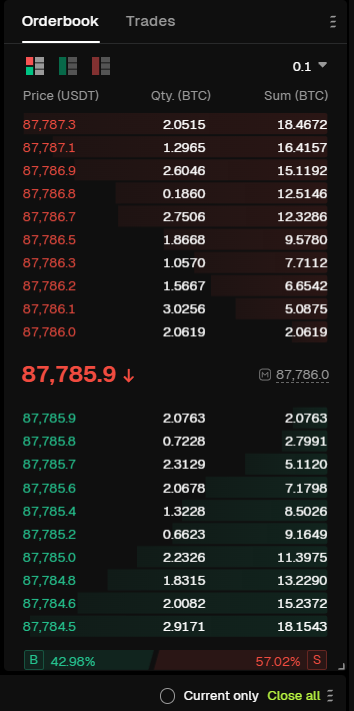
3、Order Book Panel

Panel display items (from top to bottom)

Meaning and analysis

Top area (handicap / real time trading)


Order book overview: displays current buy and sell order data in the market. Real-time trades: shows the most recent executed trades as they occur.

Sell order area (red, upper section)


Displays pending sell orders in the market, with prices arranged from high to low. This area reflects short term selling pressure and near term resistance levels.

Latest transaction price (center)


87,785.9 ↓ : indicates the most recent execution price of the contract. The downward arrow shows that the latest trade price is lower than the previous transaction price.

Buy order area (green, lower section)


Displays pending buy orders in the market, with prices arranged from low to high. This area reflects short term buying support and demand strength.

Long and short ratio (bottom)


B 42.98% / S 57.02%
represents the proportion of long and short orders in the current order book.

B: proportion of buy orders (long positions).

S: proportion of sell orders (short positions). This ratio provides a quick view of short term market sentiment. In this example, short positions slightly outweigh long positions, indicating a bearish short term bias.

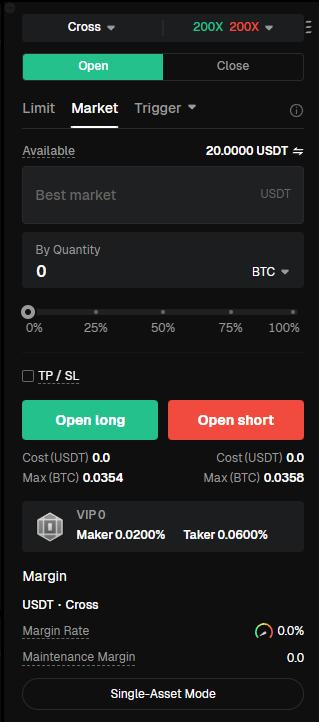
4、Order Panel and Position Settings

Panel display items (from top to bottom)

Meaning and function

Cross / Isolated


Current margin mode: Cross Margin (Full Position Mode). In this mode, all positions for the same asset share the available margin in your account. If losses reach the liquidation threshold, all margin and positions under that asset may be liquidated.

Click the triangle icon on the right of “Full Position” to expand the menu and switch margin modes.

Isolated Margin: Each position uses independent margin. If a position’s margin ratio falls below the Maintenance Margin, only that position will be liquidated and it will not affect other positions or funds in your account. You can manually add margin or reduce margin for an isolated position.

100× (Leverage multiplier)


Displays the currently selected leverage, which is set to 100×. This means the position size can be up to 100 times the initial margin.

Click the triangle icon to expand the leverage menu and select other leverage levels, such as 200×, 50×, 20×, or 10×. Higher leverage increases both potential returns and risk, so choose according to your risk tolerance.

Open position / Close position


Open position: Open a new futures position.

Close position: Close an existing position, sell the held contract, and realize profit or loss.

Limit price / Market price / Tracking order


Order placement methods:

Limit Order: Set a specific price. The order executes at that price or better but is not guaranteed to fill.

Market Order: Executes immediately at the best available market price, ensuring fast execution but with possible price slippage.

Tracking Order: A strategy order where the system automatically submits an order when price pulls back to a predefined range.

Planned Order: Set the trigger price, order price, and quantity in advance. When the trigger price is reached, the system places the order automatically. Margin and positions are not frozen before the trigger activates, making it suitable for early strategy planning.

Available


Displays the available USDT balance in your account that can be used to open or manage positions (20 USDT in this example).

Optimal market price


In Market Order mode, the system automatically executes trades at the best available buy or sell price in the market.

Quantity (contract unit setting)


Specifies the contract quantity to trade. You can manually enter the amount or use quick selection buttons (0%, 25%, 50%, 75%, 100%) based on available funds.

Click the triangle icon next to BTC to switch unit types:

BTC (By Quantity): Enter the number of BTC contracts directly.

USDT (By Cost): Enter the amount of USDT you want to invest; the system calculates the corresponding BTC quantity based on leverage.

USDT (By Value): Enter the total position value in USDT; the system calculates the required margin.

Take Profit / Stop Loss


Optional risk management tools to pre set exit conditions.

Take Profit: Automatically closes the position when the target profit price is reached.

Stop Loss: Automatically closes the position when price reaches the acceptable loss level to limit downside risk.

Bitunix Guaranteed Stop Loss Coupon: Provides zero slippage risk protection and may deduct fees directly, helping prevent failure to close positions during extreme market conditions. Example: For an ETH position worth 100,000 USDT, enabling Guaranteed Stop Loss requires a fee of 35 USDT (100,000 × 0.035%).

Click to learn: How to Use Guaranteed Stop Loss Coupon on the Bitunix App

Buy Long / Sell Short


Buy Long: Open a position when you expect the price to rise and profit from upward movement.

Sell Short: Open a position when you expect the price to fall and profit from downward movement.

Cost / Can be opened


Cost: Estimated USDT required to open the position (0 when no position is open).

Can be opened: The maximum position size that can be opened based on available margin and selected leverage.

Maker 0.0200% / Taker 0.0600% (Fee rate)


Maker: Adds liquidity by placing limit orders; fee rate is 0.0200%.

Taker: Removes liquidity by executing against existing orders; fee rate is 0.0600%.

Join Bitunix VIP to unlock up to 87% fee discounts. Trade more and save more.

Click to learn: Join Bitunix VIP

Margin


Margin Ratio: Ratio of account margin to position value (16.03% in this example). A higher ratio indicates lower liquidation risk.

Maintenance Margin: Minimum margin ratio required to keep the position open (0.7784% here). If the margin ratio falls below this level, forced liquidation occurs.

Single Asset Mode / Multi Asset Mode (Asset Mode)


Single Asset Mode:


Uses USDT only as margin for this contract. The contract is USDT margined and settled.

Cross asset futures trading is not supported. The risk of each asset in the futures account is segregated and does not affect other assets.

Profits and losses can offset

between positions that use the same margin asset. Both Cross Margin and Isolated Margin modes are supported.

Multi Asset Mode:


Allows cross asset margining. Assets in the futures account can serve as margin.

Profits and losses can offset across positions that use different margin assets.

Only Cross Margin mode is supported.

5、The order area below the K-line chart

Panel display items (from left to right)

Meaning and function

BTCUSDT

The currently displayed trading pair is the BTC/USDT perpetual futures contract.

Long position (Many)

Indicates that a long position is currently held, meaning the trader expects the price to rise and has opened a long position.

Full position

The position is using Cross Margin (Full Position Mode). All positions for this asset share the available margin in the account.

200×


The leverage used for this position is 200×, meaning the position size is up to 200 times the initial margin. Higher leverage increases both potential returns and liquidation risk.

Bitunix has officially upgraded its perpetual contracts, allowing leverage of up to
200× on BTC/USDT and ETH/USDT perpetual contracts.

Open interest

The number of contracts currently held and their corresponding notional value. For example, 0.0017 BTC ≈ 151.4 USDT, indicating a position size of approximately 0.0017 BTC with a total value of about 151.4 USDT.

Average opening price

The average entry price of the position, for example 89,191.6 USDT. This price is used to calculate profit or loss.

Mark price

A reference price used to calculate unrealized profit and loss and liquidation risk. It helps prevent abnormal liquidations caused by sudden price spikes. For example, 89,079.7 USDT.

Estimated liquidation price

The estimated price at which the position would be forcibly liquidated by the system, for example 77,733.1 USDT. This is a key risk indicator.

Margin

The amount of margin currently allocated to this position, for example 0.8492 USDT.

Margin ratio

The ratio of margin to position value, for example 2.31%. A higher margin ratio generally indicates lower liquidation risk.

Unrealized profit and loss

The floating profit or loss of the position that has not yet been closed. For example, −0.20298 USDT (shown in red) indicates an unrealized loss. This value becomes realized only after the position is closed.

Realized profit and loss

The actual profit or loss already generated from closed portions of the position, for example −0.00997543 USDT, which is directly credited or deducted from the account balance.

Yield

The unrealized return on margin, for example −26.77%, reflecting the magnitude of the current loss relative to the margin used.

Break-even price

The price at which the total profit and loss of the position becomes zero, for example 89,298.6 USDT. This price is used as a reference for evaluating break even levels.

Batch Take Profit / Stop Loss

Allows setting multiple take profit and stop loss levels to partially close positions, lock in profits, or control risk in stages.

Trailing Take Profit / Stop Loss

Enables dynamic stop loss or take profit that automatically adjusts as the price moves in a favorable direction, helping lock in additional profits.

Position Take Profit / Stop Loss

Set a take profit or stop loss price for the current position. The system will automatically close the position when the trigger price is reached.

Market close

Quickly closes the entire position at the best available market price, enabling a fast exit.

One-click reverse

Instantly closes the current position and opens a reverse position of the same size, for example switching from long to short. Suitable for rapid trend reversal strategies.

Add position

Increase the position size based on the existing position, which can amplify potential profits or reduce average entry cost.

Frequently Asked Questions

Q1: What is the difference between mark price and index price on web?

Index price is a multi-exchange spot reference used for fairness and funding. Mark price is used for unrealized PnL and liquidation to limit abuse of thin last prints.

Q2: Where do I see maker and taker fees on web?

In the order panel (example display: Maker 0.0200%, Taker 0.0600%). Confirm live tiers in your account and Bitunix VIP program.

Q3: What is break-even price vs entry price?

Entry is your average open. Break-even includes costs such as fees — the price where net position PnL is approximately zero.

Q4: Cross vs Isolated on web — where is it?

Order panel: Cross / Isolated toggle. Positions table may show Full position for Cross mode.

Q5: What is margin ratio vs maintenance margin?

Margin ratio is current collateral vs position requirement. Maintenance margin is the minimum ratio to avoid liquidation — falling below triggers risk.

Q6: Batch vs Trailing vs Position TP/SL?

Position: one full exit. Batch: staged %. Trailing: follows trend with callback. See four methods guide.

Q7: Is one-click reverse safe for beginners?

It is a high-speed directional flip — useful for experienced traders, risky for beginners due to slippage, fees, and whipsaws.

Q8: How does web differ from the app glossary?

Web adds index price in the top bar, maker/taker on the order panel, break-even, batch/trailing actions in the lower positions table, and fuller TradingView tooling. App guide: terminology (app).

Q9: Where to learn next?

Disclaimer

Trading digital assets involves risk and may result in the loss of capital. Always do your own research. Terms, conditions, and regional restrictions may apply.

About Bitunix

Bitunix is a global cryptocurrency derivatives exchange trusted by over 5 million users across more than 150 countries. The platform is committed to providing a transparent, compliant, and secure trading environment for every user. Bitunix offers a fast registration process and a user-friendly verification system supported by mandatory KYC to ensure safety and compliance. With global standards of protection through Proof of Reserves (POR) and the Bitunix Care Fund, Bitunix prioritizes user trust and fund security. The K-Line Ultra chart system delivers a seamless trading experience for both beginners and advanced traders, while leverage of up to 200x and deep liquidity make Bitunix one of the most dynamic platforms in the market.