Static charts tell you what worked in hindsight; live execution tests whether you have the discipline to trade an unfinished bar. Replay trading bridges that gap. By rewinding market data to a past date, masking the right side of the chart, and feeding price forward candle by candle with simulated funds, it resolves the fatal blind spot of static practice: how your system actually performs when you cannot see the next candle.
The primary hurdle has always been platform accessibility. On legacy charting suites, intraday replay sits behind recurring paid subscriptions, while general-purpose tools rarely accommodate the unique mechanics of perpetual futures—such as funding rates and real margin requirements.
To build confidence before putting skin in the game, traders need to understand how historical simulators operate under the hood, how the current paywall landscape functions, and how to structure practice sessions that yield trustworthy performance metrics.
What Is Replay Trading? The Mechanics of Bar-by-Bar Market Simulation
Every professional replay trading simulator relies on three synchronized components: a high-fidelity historical data feed, a client-side playhead that enforces a strict visibility boundary, and an execution engine that records entries, exits, and PnL against active bar parameters. If any single component lacks precision, the resulting statistics offer little real-world value.
Defining the Technology: How Historical Data Feeds Reconstruct Past Price Action
Replay trading is a practice method that plays historical price data forward one candle at a time while you place simulated orders with virtual funds.
Unlike live demo trading (which requires waiting for markets to unfold in real time) or static backtesting (which evaluates completed chart patterns), a modern trading replay simulator delivers temporal compression. Months of price action can be reviewed in a single focused session without leaking future data.
The fidelity of your practice depends entirely on data granularity:
Tick-Level Replay: Reconstructs every bid, ask, and executed print sequentially. Price moves within each candle exactly as it did live, capturing order flow nuances, micro-wicks, and intraday sweeps. Because storing and serving tick data requires immense server overhead, charting platforms historically lock this tier behind premium paywalls.
Second-Level Replay: Synthesizes candles from sequential one-second intervals. This provides more than enough precision for intraday scalpers and day traders to test multi-timeframe confirmation.
Candle-Level Replay: Prints each candle as an already-completed unit at the selected chart timeframe (e.g., 15m or 1h). The path of price inside the candle is obscured—meaning a 15-minute pin bar prints all at once rather than revealing whether the high or low formed first.
Testing Methodology | Market Data Source | Time Flow | Future Visible? | Best Suited For |
Replay Trading | Historical | Compressed, user-paced | No | Rehearsing discretionary setups across hundreds of market conditions |
Paper (Demo) Trading | Live stream | Real time | No | Mastering execution flow, platform hotkeys, and real-time order routing |
Static Chart Review | Historical | Zero (static image) | Yes | Annotating structural market patterns and high-level strategy ideation |
Automated Backtesting | Historical | Instantaneous / Code-based | N/A (Fixed rules) | Quantifying large-sample statistical edge for algorithmic systems |
Bar Replay vs. Static Chart Review: Eliminating Hindsight Bias from Strategy Development
Hindsight bias—the psychological tendency to perceive past events as having been predictable—makes static chart review dangerously misleading for active traders.
When scrolling through a completed chart, a confirmed breakout makes the preceding consolidation look like "obvious" accumulation. Your eyes naturally glide over the three identical consolidation ranges that broke down into stop-outs. Building rules around finished candles leads to catastrophic curve-fitting: systems that look flawless in screenshots but bleed capital the moment the right edge of the chart goes blank.
A dedicated trading chart replay simulator restores genuine risk by strictly removing hindsight. You are forced to execute based strictly on the liquidity, volume, and structure visible at that exact timestamp, with your virtual fill committed before the next candle appears.
While bar replay cannot prevent you from cherry-picking famous historical dates (like major liquidation wicks) or restarting a blown session, establishing a rigorous operating protocol neutralizes those human loopholes.
Why Intraday Speed Control and Candle-by-Candle Unfolding Matter in High-Volatility Derivatives
Perpetual futures markets never sleep, and their volatility concentrates into aggressive, non-linear bursts. A crypto asset can compress in a tight range for 72 hours and then violently wipe billions in open interest within a single 15-minute window. Effective simulation requires granular control over how time unfolds:
Dynamic Speed Control: Accelerate through prolonged consolidation ranges and decelerate the moment price enters key liquidity pools or point-of-interest (POI) zones. An edge that triggers twice weekly produces roughly 100 setups per calendar year; a fast-forward simulator allows you to log those 100 reps in an afternoon.
Candle-by-Candle Stepping: Step forward bar by bar to test whether stop-loss placements can withstand pre-breakout noise. At 20x leverage, a market move of roughly 5% against your entry triggers full liquidation. Advancing one candle at a time shows whether your invalidation level held, or if intraday noise would have wiped your margin before the trade reached target.

Static chart review shows the outcome before the decision. Replay trading hides every candle to the right of the playhead.
The Paywall Dilemma: Why Legacy Trading Chart Replay Tools Fall Short for Crypto Traders
Most historical replay engines were built inside legacy charting suites designed for equities and spot forex—markets that sleep on weekends, settle in cash, and trade without funding rates.
While these platforms excel at static technical analysis, crypto derivatives traders quickly hit a wall: the granular intraday feeds and contract-specific execution mechanics required for high-frequency testing are almost always locked behind expensive subscription tiers, if available at all.
The Freemium Trap: Restrictions on Multi-Timeframe Synchronization and Second-Level Feeds
The surge in demand for a trading replay free alternative typically begins at the same friction point: a trader loads a 1-minute or 5-minute crypto chart, clicks the replay icon to practice a setup, and is greeted by a paywall banner.
TradingView's Bar Replay represents the industry benchmark, yet its accessibility remains heavily restricted by tier. As of late 2026, the platform segments historical bar depth and playback fidelity across distinct subscription levels:
Replay Capability | Basic (Free) | Essential | Plus | Premium | Ultimate |
Daily & Higher Timeframes | Full history | Full history | Full history | Full history | Full history |
1-Minute Replay Depth | Unavailable | ~6 months | ~1 year | All available data | All available data |
Seconds-Based Replay | No | No | No | Yes | Yes |
Tick-Based Replay | No | No | No | No | Yes (recent sessions only) |
For active crypto derivatives traders, this tiered paywall creates three severe operational bottlenecks:
Intraday Data Depletion: Historical depth scales inversely with chart resolution. While swing traders can access years of daily candles on basic tiers, a 1-minute chart on an entry-level plan only retains several months of price action—insufficient for backtesting how an intraday setup behaves across bull, bear, and consolidation regimes.
The High Cost of Scalping Precision: Base plans run approximately $13 to $15 per month, but sub-minute granularity—essential for observing liquidity sweeps and order flow reactions around key levels—demands a Premium plan (roughly $60 per month). Committing $155 to $720+ annually just to review historical candles represents an unnecessary capital drag on a trader's development account.
Multi-Timeframe (MTF) Blindness: Free plans limit users to a single chart per browser tab. Effective crypto strategies require top-down confluence—monitoring higher-timeframe order blocks on a 4-hour chart while executing structural entries on a 1-minute or 5-minute chart. On legacy free tiers, cross-chart replay synchronization is unavailable, forcing traders to constantly flip timeframes and manually reconstruct context.
While a daily-candle swing trader can survive on basic free charts, a crypto perpetual futures trader cannot properly backtest without intraday execution. While dedicated third-party backtesting platforms have stepped in, they typically introduce their own separate monthly subscription fees and proprietary data silos.
The "Execution Gap": Why Traditional Charting Platforms Lack Integrated Order Execution Environments
Most legacy charting tools have embedded simulated order buttons into their replay modules. However, placing a virtual order on a decoupled canvas is far from navigating a live clearing engine. The real problem is structural: the simulated ledger lives entirely isolated from the exchange mechanics that govern trade survival.
In spot trading or unleveraged equity investing, this disconnect is negligible. In perpetual futures, it is fatal. Multi-asset charting platforms have little incentive to replicate the complex structural friction of crypto derivatives:
Maker and Taker Asymmetry: A limit order executed at 0.02% (maker) behaves fundamentally differently from a market panic-close at 0.05% (taker). Compounded over hundreds of trades, unchecked fee assumptions turn an apparently profitable equity curve negative.
Funding Rate Carry Costs: Holding leveraged positions through 8-hour funding settlements can bleed an account faster than minor adverse price action. Standard charting replays rarely deduct these continuous debits or credits.
Dual-Price Liquidation Logic: Real crypto exchanges trigger liquidations off the Mark Price (an index-weighted fair price) to prevent scam wicks, while fills occur on the Last Traded Price. Generic replays rely on a single price feed, consistently miscalculating when a leveraged margin call would actually trigger.
Isolated vs. Cross Margin Dynamics: Contract-level rules—including tier-based maintenance margin ratios (MMR) and hedge mode offsets—are systematically ignored by generalist charting suites.
An exchange-native replay trading feature eliminates this execution gap by processing virtual fills directly through the exchange's native matching and margin engine. Your simulated trade is subject to the exact liquidation thresholds, fee structures, and contract rules governing live accounts.
Cognitive Biases in Manual Backtesting: Overcoming Confirmation Bias and Unrealistic Fill Rates
When manual replay sessions fail to correlate with live performance, the flaw usually lies in execution discipline rather than the underlying indicator. Traders routinely fall into five systemic cognitive traps:
Confirmation-Driven Cherry-Picking: Taking the pristine, textbook setups while intuitively ignoring choppy, ambiguous bars with the excuse that "I wouldn't have traded that day." Live markets never allow discretionary hindsight omissions.
The "Touch-as-Fill" Fallacy: Assuming a limit order filled simply because a historical wick kissed the price level. In a live order book, limit orders require queue priority and adequate matching volume at that exact price tick. If volume exhausts before your order clears the queue, you get left behind.
Frictional Blindness: Calculating gross PnL while disregarding slippage on aggressive breakout entries, maker/taker fee overhead, and overnight funding costs.
Mid-Session Rule Drift: Altering entry triggers or widening invalidation points immediately following a simulated loss, then retroactively evaluating earlier trades against the newly adjusted rules.
Regime Sampling Bias: Running tests exclusively during raging directional trends while bypassing multi-week compression regimes where trend-following models bleed margin via false breakouts.
Each of these behavioral leaks artificially inflates backtested performance in the exact same direction. While a rigorous personal protocol is required to eliminate human error, a robust trading replay simulator with non-negotiable trade logging, automated fee deductions, and authentic fill mechanics closes the structural half of the equation.
Anatomy of an Advanced Replay Trading Simulator: 4 Core Architectural Pillars
A free replay trading simulator is only as valuable as the integrity of its underlying matching engine. If an engine leaks future data or fails to enforce contract margin rules, the resulting win rate is an illusion.
Four architectural pillars separate a rigorous institutional-grade testing engine from a basic charting canvas with a play button:
Engine Latency & Granularity: Synchronizing Multi-Timeframe (MTF) Data Feeds Without Glitches
Professional discretionary trading demands top-down execution: reading trend structure on a 4-hour or daily chart, and timing precise entries on a 1-minute or 5-minute chart. During a replay session, switching timeframes must maintain absolute temporal synchronization without dropping active virtual positions.
The subtle risk here is lookahead leakage. If the playhead sits at 10:15 AM within an ongoing 4-hour bar (10:00 AM – 2:00 PM), a poorly engineered tool will render that 4-hour candle with its completed high, low, and close. That premature print leaks the next three hours and 45 minutes of lower-timeframe price discovery.
A high-fidelity engine constructs higher-timeframe bars synthetically: the 4-hour candle must be dynamically generated only from the 5-minute bars that have actually elapsed up to the active playhead. Traders can easily audit any simulator for this flaw: pause mid-bar on a lower timeframe, toggle to a higher timeframe, and verify whether the candle displays a completed close or a developing, unclosed state.
Order Book Emulation: Simulating Real Slippage, Liquidity Pockets, and Maker/Taker Fee Impacts
Because storing tick-by-tick Level 2/Level 3 historical depth across multiple years is computationally massive, many generic replay tools default to simplistic fill assumptions: market orders fill at the current candle's close, and limit orders fill the instant a subsequent wick touches the order price.
This creates two critical performance distortions:
The Queue Priority Blind Spot: A limit order sitting at a key liquidity level in live trading requires sufficient counterparty volume to clear everyone ahead of you in the order book. Naive simulators grant an immediate fill the moment price touches the level, drastically overestimating limit fill rates.
Breakout Slippage: Market orders deployed during rapid volatility spikes or liquidity vacuums realistically execute several ticks beyond the visual price.
Furthermore, ignoring trading fees quietly destroys margin over time.
Consider an illustrative taker fee of 0.06% per side: a round-trip on a $10,000 USDT position costs 12 USDT. If your planned trade risk (1R) is $100 USDT, commissions instantly consume 12% of your entire risk allocation before the market moves a single tick. Reliable simulation engines automatically deduct real-time maker/taker schedules from virtual equity balances.
Dynamic Virtual Account Layer: Real-Time PnL Tracking, Margin Utilization, and Liquidation Calculation
A dedicated crypto derivatives simulator requires a clearing engine running beneath the chart. At a minimum, the engine must model:
Real-Time Unrealized PnL & Equity: Recalculated dynamically as every bar forms, reflecting precise drawdowns rather than post-candle summaries.
Maintenance Margin & Dynamic Leverage: Tracking margin utilization against the contract’s tiered Maintenance Margin Ratio (MMR) rules, rather than applying a naive fixed-stop formula.
Mark Price Liquidation Engines: Simulating liquidation triggers based on index-weighted Mark Price rather than volatile Last Price wicks, matching real exchange liquidation risk.
Continuous 8-Hour Funding Rate Accrual: Applying funding fee debits or credits across 00:00, 08:00, and 16:00 UTC timestamps. While a 0.01% funding rate appears negligible during a scalping session, holding a $10,000 position across a 10-day swing accumulates meaningful carry costs that dictate net system expectancy.
Event Tagging & Session Marking: Testing Strategies Against Specific Macro Volatility Events
A strategy validated exclusively across smooth, low-volatility weekends hasn't been stress-tested. Meaningful practice demands targeting structural market shifts: FOMC rate decisions, CPI prints, macro liquidity cascades, and the high-volume transition zones between the Asian, London, and New York sessions.
Advanced simulators allow traders to tag specific historical timestamps or jump straight into high-impact volatility regimes. Systematically cycling through market phases—ranging from low-volatility multi-week consolidations to violent deleveraging cascades—ensures your risk parameters remain resilient across all market environments.

In a candle-level replay engine, each new candle triggers order matching, a liquidation check and an account update in a fixed sequence.
Feature Teardown: How Bitunix PC Ultra Handles Replay Trading With Virtual Funds
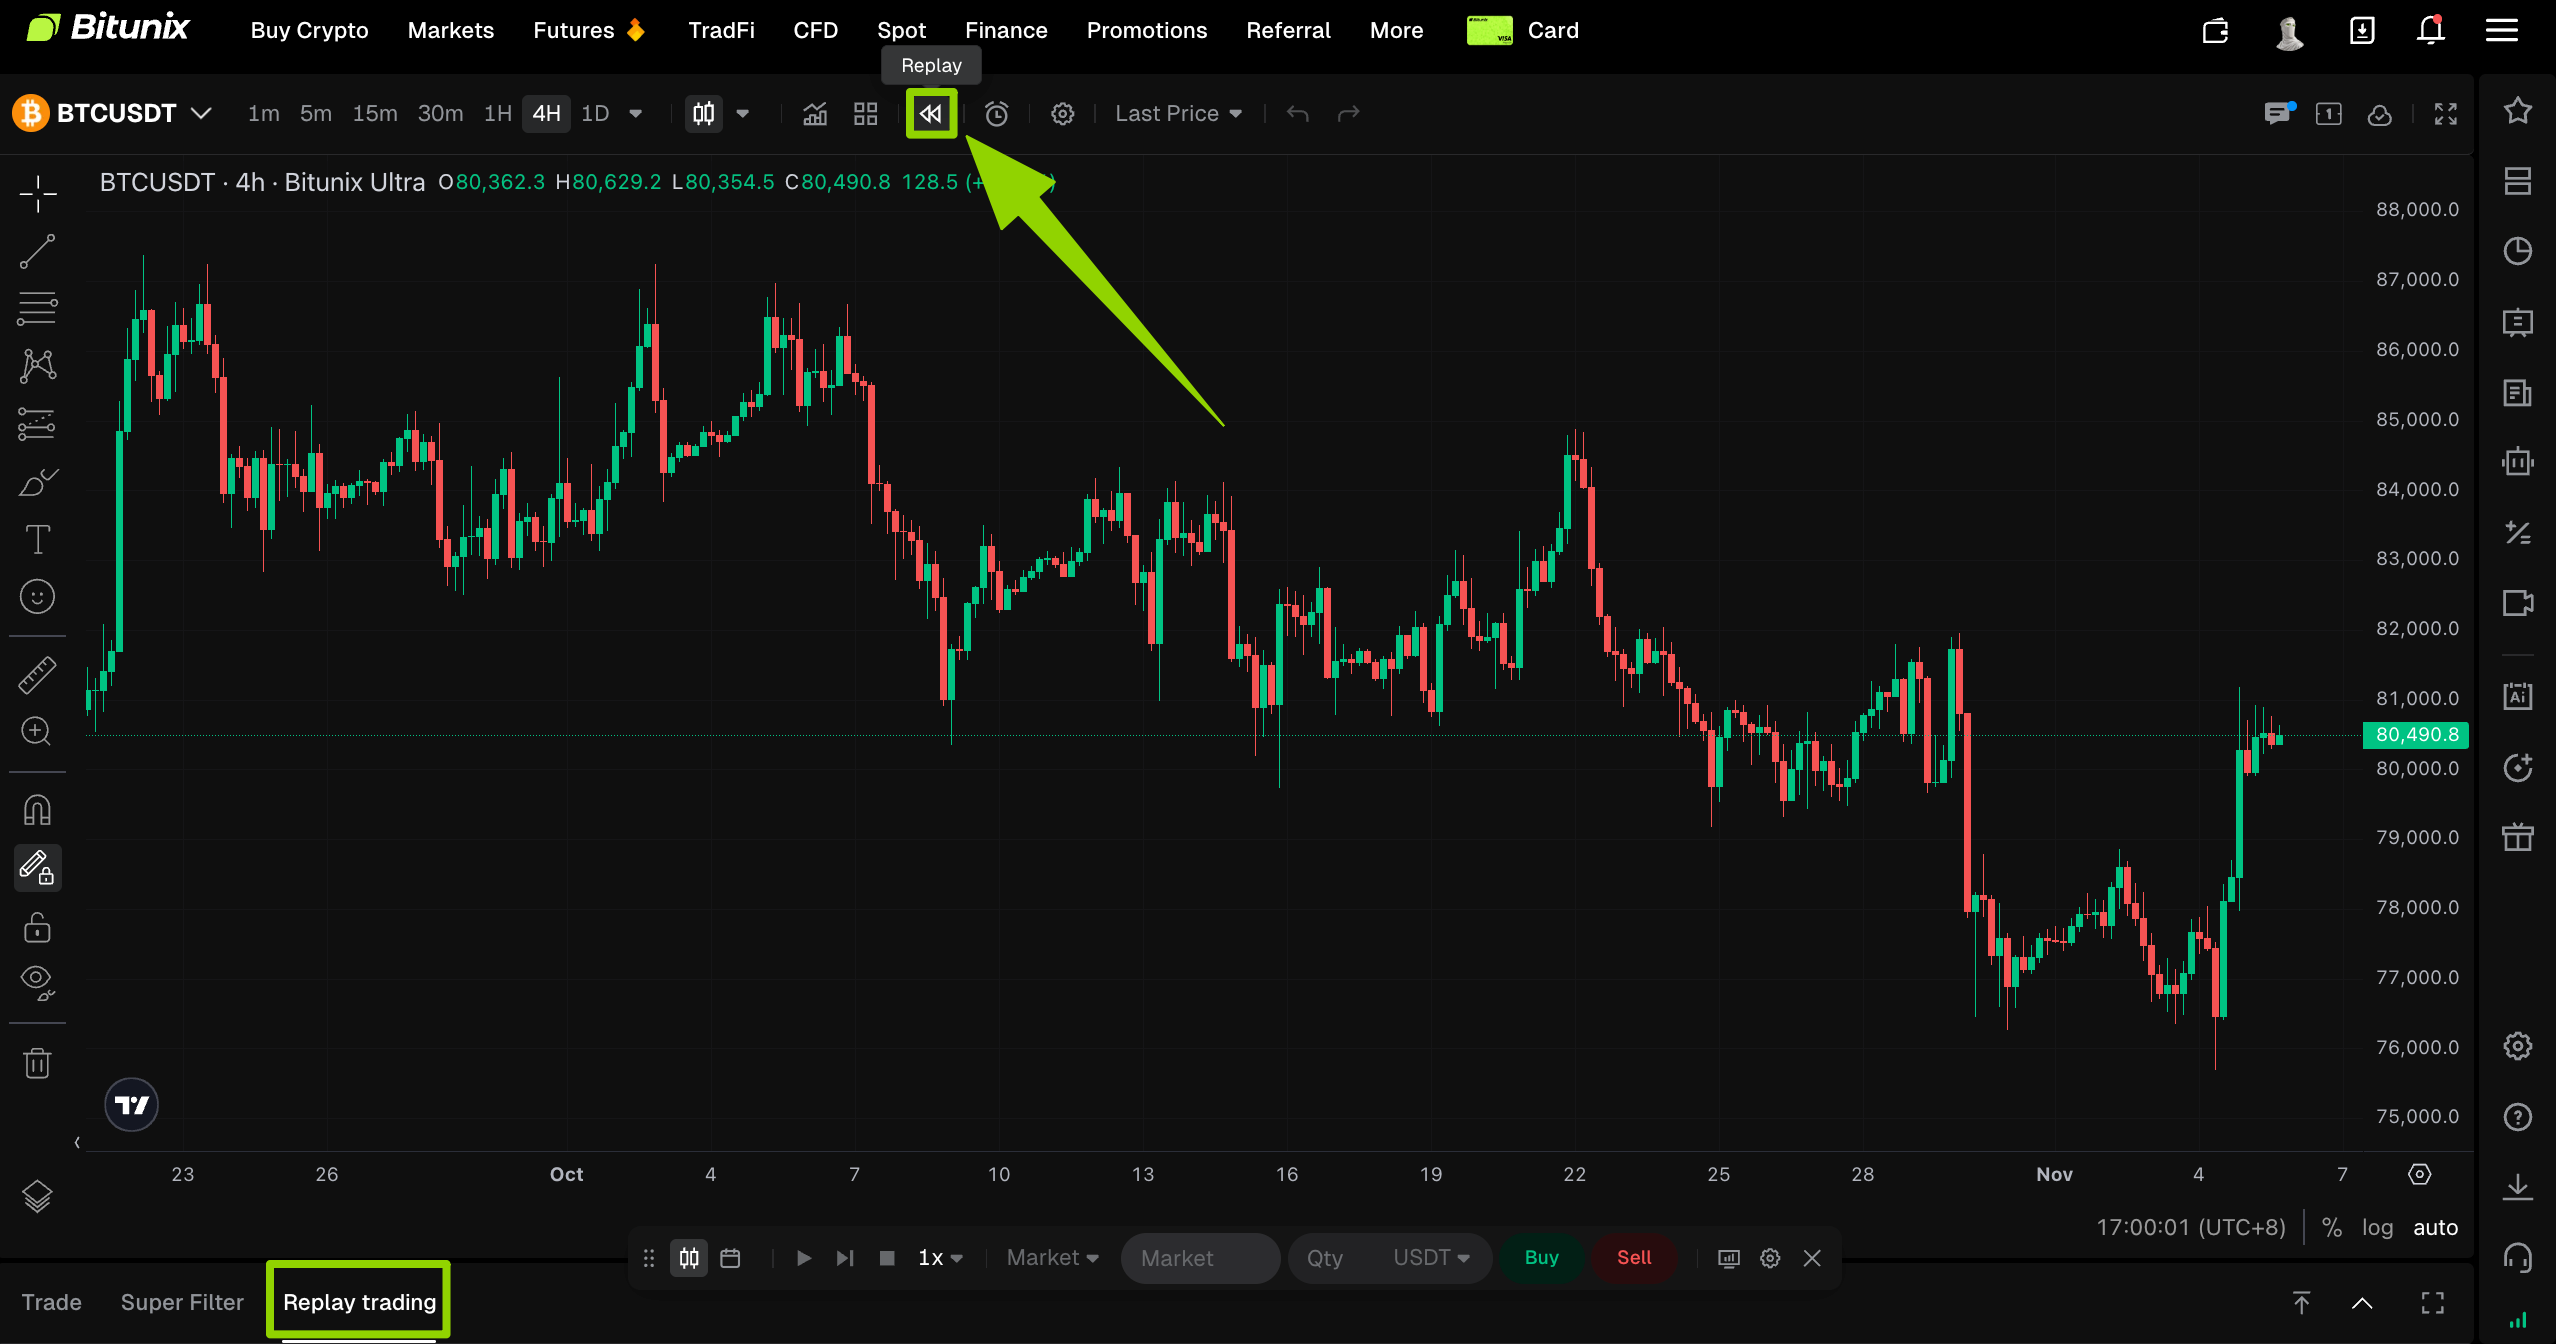
Bitunix PC Ultra integrates native Replay Trading into its derivatives layout, combining bar replay with production matching mechanics.
Rather than embedding a generic charting widget, Bitunix integrated historical replay trading directly into its native derivatives desktop layout, PC Ultra. By anchoring simulated execution to its production matching architecture, it addresses the traditional divide between chart backtesting and real exchange mechanics.
PC Ultra Replay architecture at a glance:
Parameter | Bitunix PC Ultra Replay Trading |
Availability | Ultra futures page in a web browser. Not available in the mobile app or on spot. |
Simulated orders | USDT-margined futures: market and limit orders, hedge mode, cross margin |
Replay only | USDC-margined and coin-margined futures: chart replay for reference, no simulated orders |
Virtual balance | 10,000 USDT by default, adjustable from 1,000 to 100,000 USDT |
Playback | Play, pause, step forward one candle; speeds of 1x, 3x, 5x and 10x |
Data granularity | Completed candles at the chart timeframe; movement inside a candle is not simulated |
History range | Earliest available candle by clicking the chart; the time selector covers roughly the past two years |
Fill logic | Market orders fill at the candle close; limit orders fill when a later candle's high or low reaches the price |
Session limits | 10 position-opening batches and 10 limit orders per session |
Review | "My Replays" keeps a performance summary and up to 30 recent sessions in read-only mode |
Free Replay Trading Across USDT-Margined Perpetual Pairs: Access, Speed, and Limits
Bitunix attaches zero subscription paywalls to its replay trading feature.
The only prerequisite is an authenticated account. Crucially, intraday intervals (1m, 5m, 15m) are entirely ungated by paid subscription tiers—eliminating the recurring $155 to $720+ annual software tax imposed by legacy charting providers for comparable intraday bar replay depth.
Playback throughput is optimized for rapid pattern recognition. Because a 1x playback advances approximately one candle every 0.8 seconds, a complete 24-hour cycle of 5-minute data (288 candles) plays out in under four minutes. Increasing the feed to 5x or 10x allows discretionary scalpers to log hundreds of trade setups across multiple macro regimes in a single afternoon.
The Granularity Trade-Off:
PC Ultra executes on completed candle data. Because price movement inside an unfinished bar is not simulated tick-by-tick, the engine cannot establish whether a candle's high or low occurred first. Consequently:
Ideal for: Structural strategies, breakout confirmation on candle close, swing setups, and multi-timeframe liquidity sweeps.
Not designed for: Ultra-high-frequency tick scalping, footprint chart order flow, or DOM (Depth of Market) ladder dynamics.
Additionally, the 10-batch position cap per session acts as a built-in risk governance mechanism. Rather than treating replay like a frictionless video game, it forces traders to treat each 10-trade batch as a disciplined statistical test.
Multi-Timeframe Replay on PC Ultra: Moving From HTF Trend to LTF Trigger in One Session
A key technical strength of PC Ultra is its state persistence across timeframe shifts. Switching from a 4-hour chart down to a 5-minute chart does not reset the playhead timestamp, nor does it wipe open virtual positions, pending limit orders, or realized PnL.
This architecture enables an authentic top-down discretionary workflow within a single session:
Macro Structure Mapping: Establish market bias, key liquidity pools, and order blocks on the 4-Hour or Daily timeframe.
Contextual Fast-Forwarding: Accelerate playback at 5x or 10x until historical price approaches your identified Point of Interest (POI).
Micro Execution Stepping: Drop the resolution down to the 5-Minute or 1-Minute chart and advance candle-by-candle to isolate the structural shift, liquidity sweep, or entry confirmation.
Order Commitment & Execution: Deploy the simulated market or limit order with predetermined margin, then manage the active trade across your chosen operational timeframe.
To streamline scenario selection, PC Ultra incorporates Super Filter—a real-time screener scanning contracts by technical indicators, candlestick formations, funding rate polarity, and 24-hour momentum. Traders can identify active pairs exhibiting specific technical conditions (e.g., extreme funding or range compression) on the live market, then immediately launch a replay session on historical data to examine how identical structural conditions resolved in the past.
(Note: Switching contracts discards an active, unsettled replay session; traders must settle and close the active session first to ensure performance logs are permanently saved to "My Reviews".)
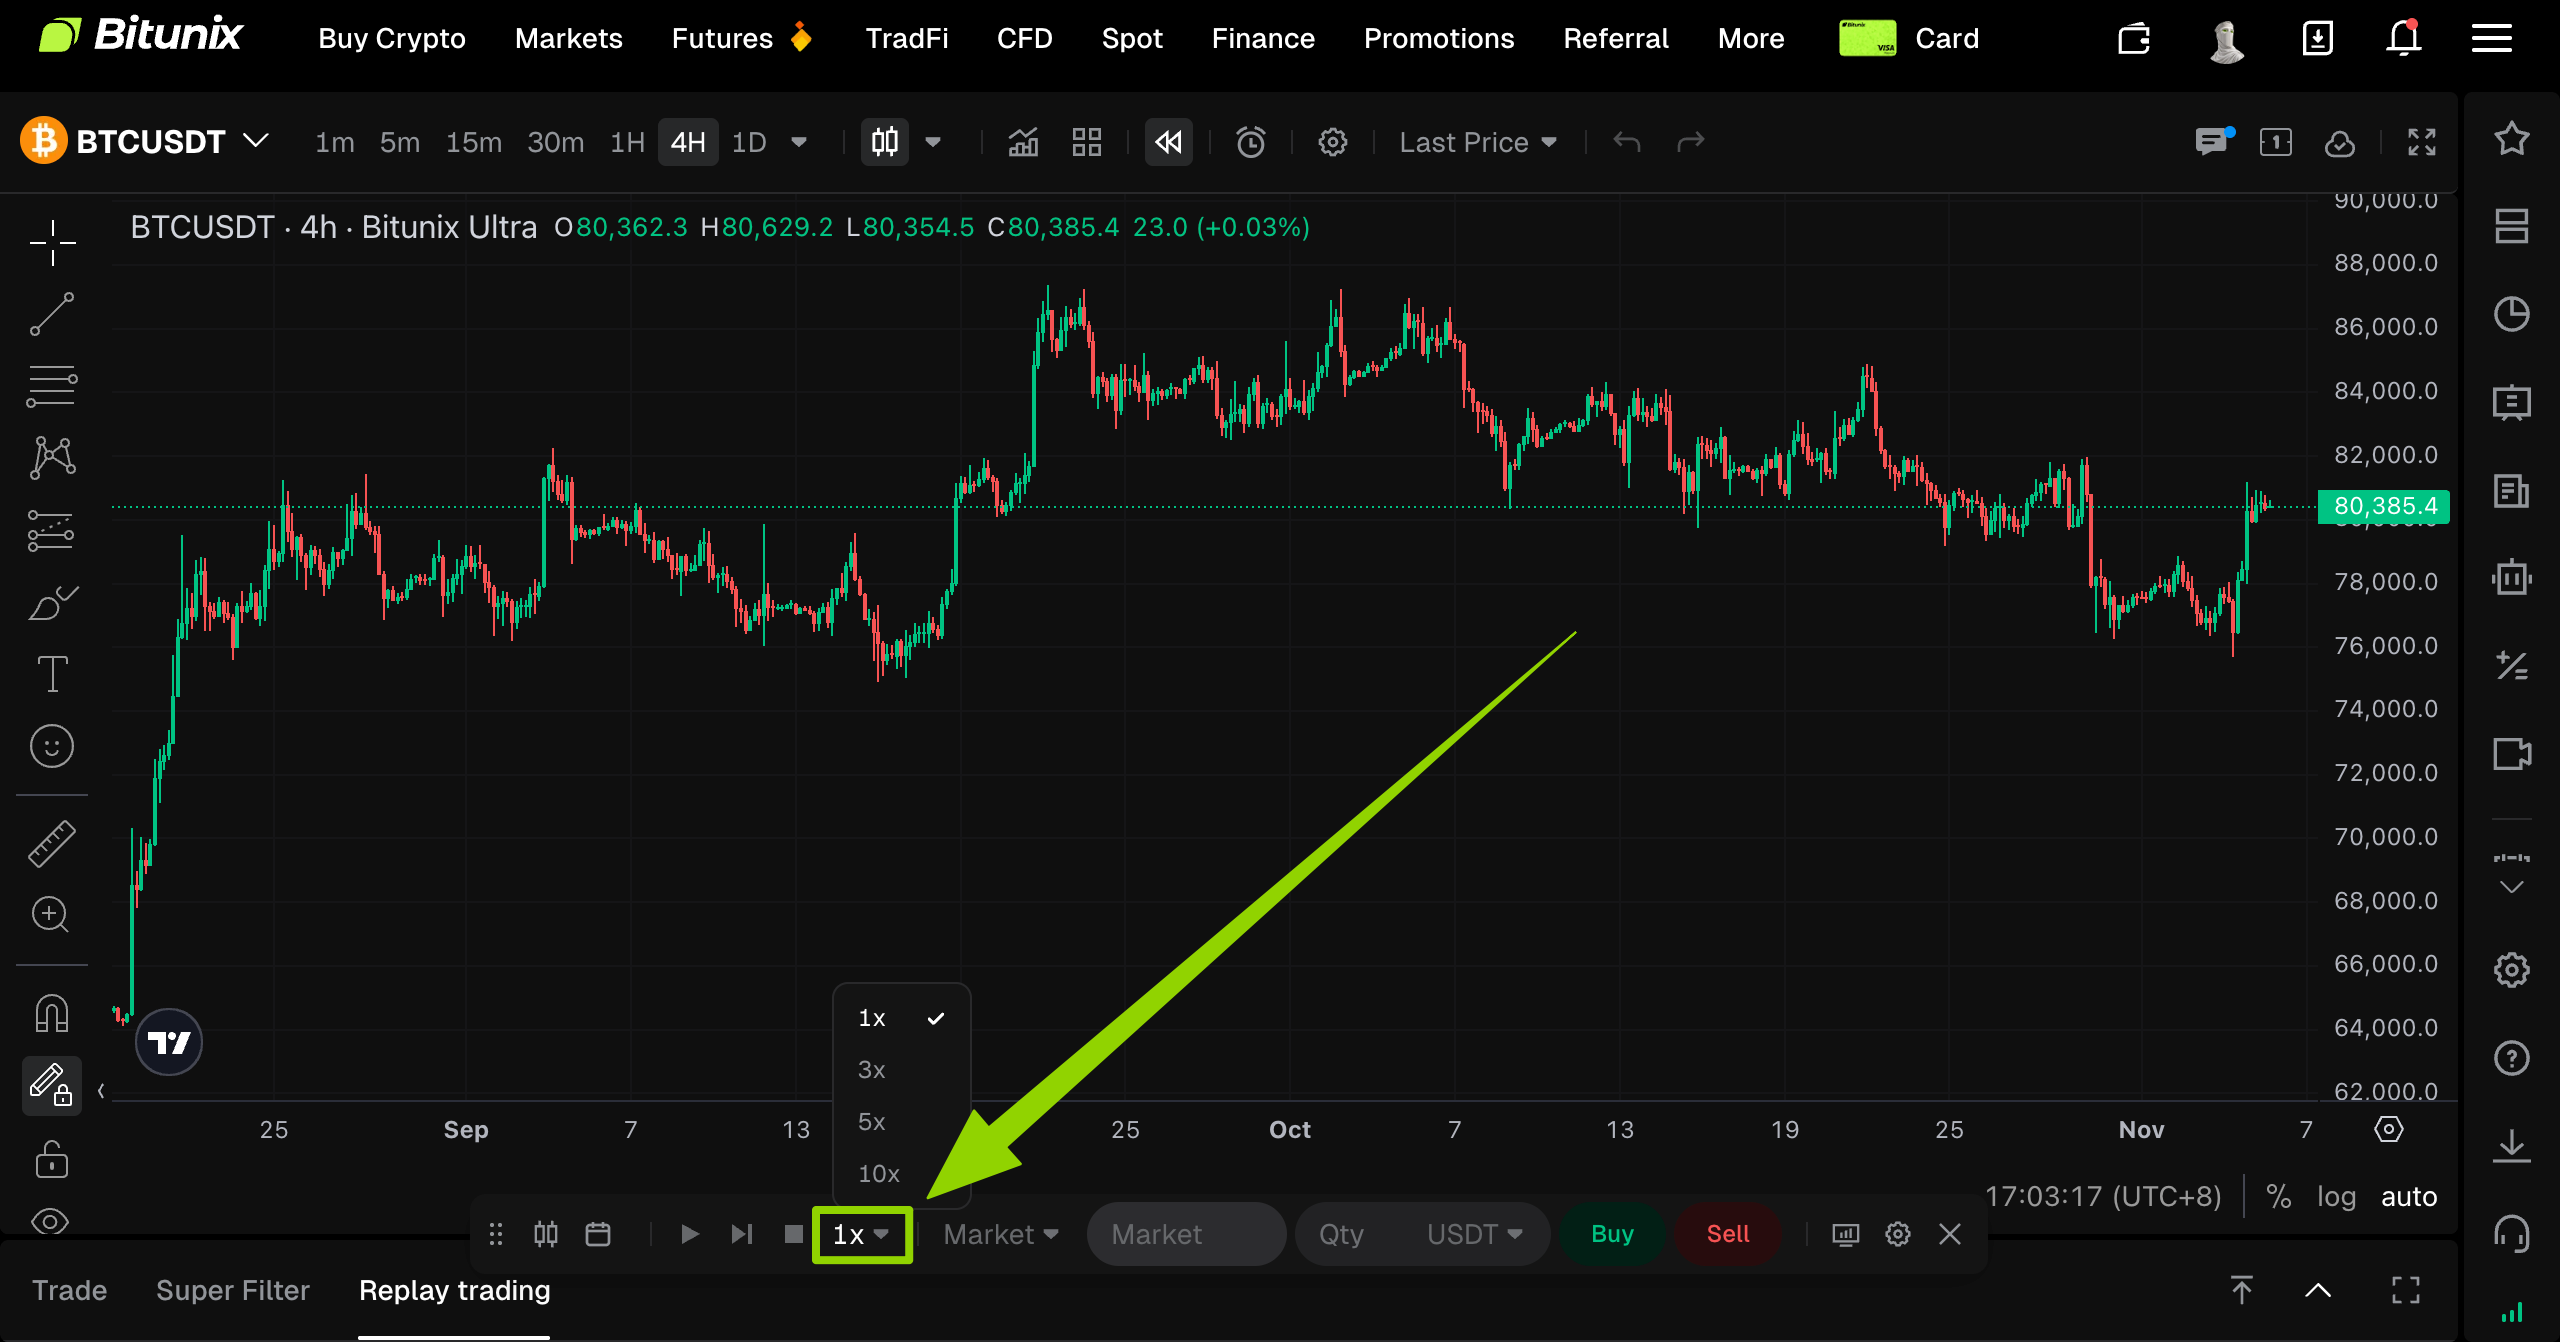
Replay Trading on Bitunix PC Ultra: playback controls sit above the chart, and the bottom panel tracks simulated positions, equity and margin ratio.
Virtual Capital Execution: Practicing Position Sizing and Fixed-Loss Discipline With Virtual Funds
Replay trading loses its training value the moment virtual capital is treated like arcade money. The ability to calibrate the simulated starting balance between 1,000 and 100,000 USDT serves one critical function: aligning your test environment with the exact capital scale you intend to deploy live.
To build meaningful statistical confidence, every simulated trade should represent a standardized risk unit (1R). In a standard setup using the 10,000 USDT baseline:
Account Risk Allocation (1R): Allocating 1% of total equity caps your planned loss at 100 USDT.
Trade Context (Hypothetical): Buying at 100,000 USDT, with structural invalidation (stop) placed at 99,000 USDT—representing a 1,000 USDT price delta, or a 1% move against entry.
Position Sizing: Dividing your 100 USDT risk budget by the 1,000 USDT distance to your stop yields an execution size of 0.1 BTC, which translates to a notional contract value of 10,000 USDT.
Capital Efficiency: At 10x leverage, this position requires an initial margin commitment of roughly 1,000 USDT.
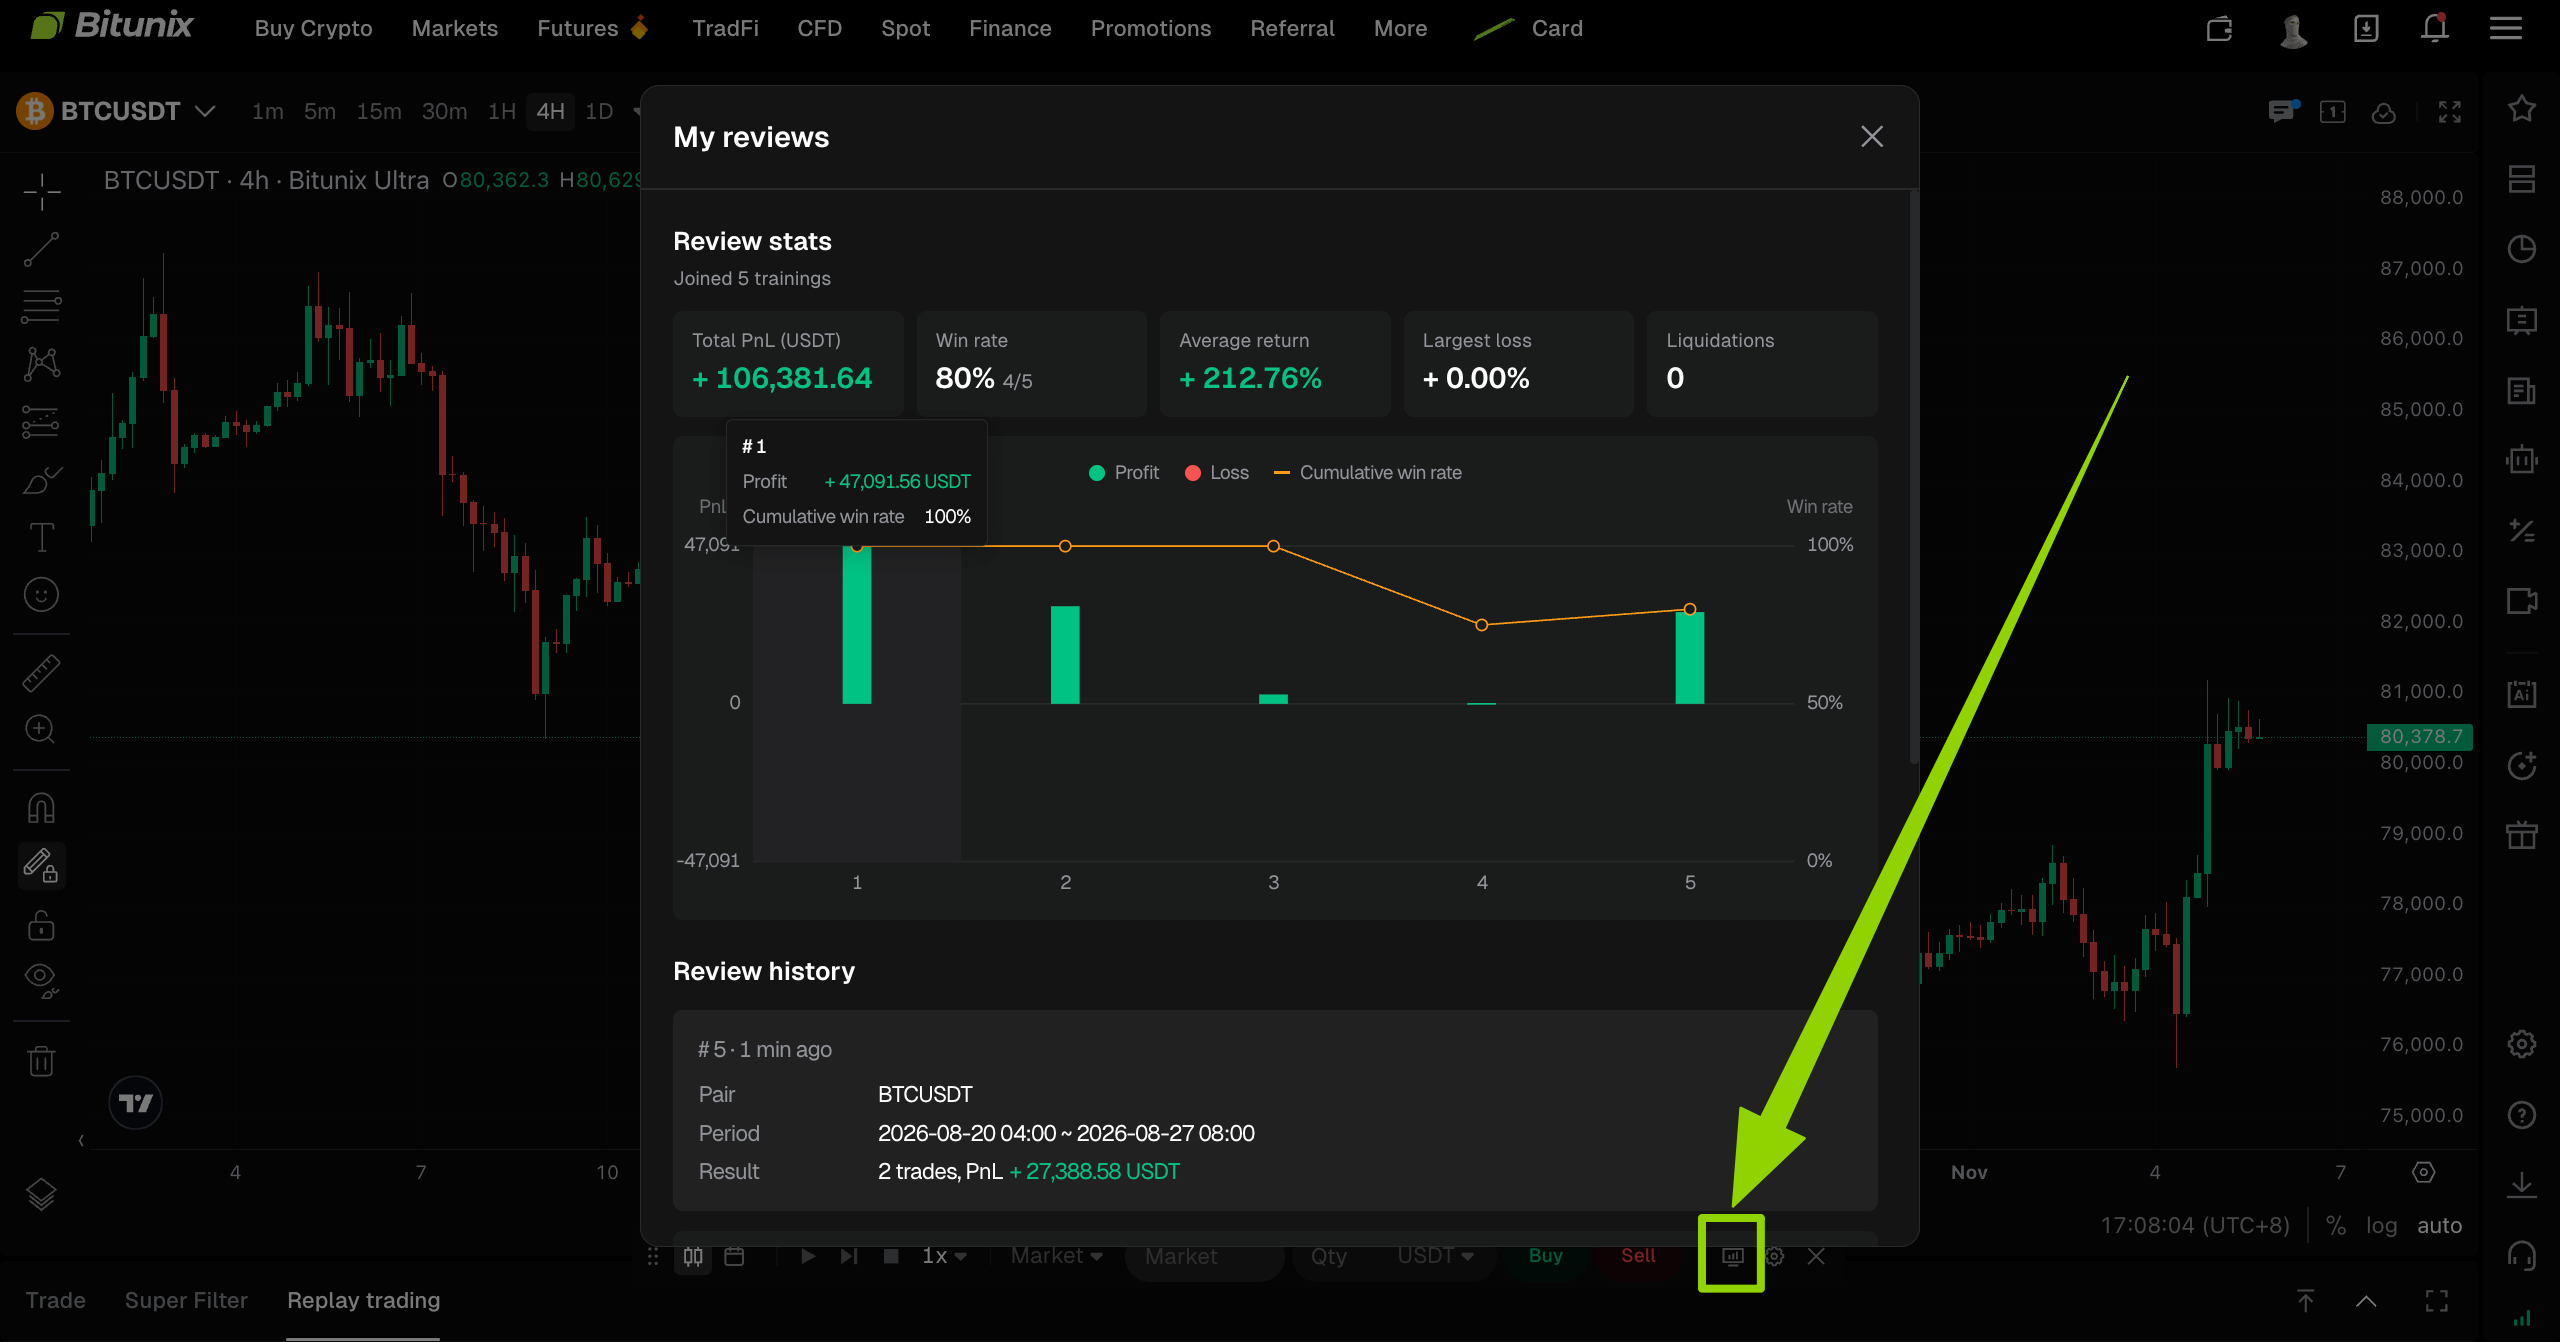
Bitunix PC Ultra Replay Trading terminates sessions on liquidation, logging failed backtests directly into the My Reviews ledger.
As each candle resolves, the matching engine tracks floating drawdowns and checks margin utilization against liquidation thresholds. If an aggressive counter-trend position triggers liquidation, the session terminates immediately and registers as a failed run in the My Reviews audit ledger.
Navigating Order Limitations: The Manual Stop-Loss Rule
A crucial operational distinction in PC Ultra Replay is its order scope: it natively processes Market and Limit orders, but omits automated Stop-Loss, Take-Profit, or conditional trigger orders.
Rather than a drawback, this constraint serves as an intensive behavioral filter. In live trading, premature stop movement or canceling stops in panic is the primary driver of catastrophic drawdowns. In replay, you must enforce a strict manual invalidation rule:
The Manual Stop Protocol: Note your structural invalidation level on the chart prior to entering. If an unfolding bar prints a close beyond your invalidation price, execute an immediate manual market close. Do not negotiate, widen the level, or wait for a mean-reverting bounce.
The Bridge to Live Capital: Transitioning to "Fixed Risk" Chart Trading
Discipline forged across dozens of replay sessions carries directly into live market execution.
Within Bitunix's live Chart Trading interface, the Fixed Risk tool operationalizes the exact math practiced in the simulator. By entering your pre-tested dollar risk threshold (such as 100 USDT) and desired Risk-to-Reward ratio, the system automatically computes contract quantities and places the corresponding TP/SL brackets directly on the chart canvas.
Having repeatedly executed that specific 100 USDT loss boundary under bar-by-bar uncertainty, transitioning to real capital becomes a matter of repeating muscle memory rather than grappling with entry anxiety.
The Anti-Hindsight Protocol: 3 Rules for Realistic Simulation and Risk Calibration
A high-performance replay trading simulator eliminates future data, but it cannot prevent human self-deception. If you restart a blown session, cherry-pick clean trends, or expand profit targets mid-trade, the resulting performance data is meaningless.
To generate statistics worthy of risking real capital, enforce these three non-negotiable operational rules:
Rule 1: Strict Pre-Set Execution with Dynamic Risk-to-Reward (R:R) Ceilings
The moment the entry trigger candle prints, your trade plan is permanently locked. Before advancing playback by even a single bar, commit five variables to your physical or digital journal: trade direction, precise entry price, invalidation level, target exit, and pre-calculated position size.
To keep targets grounded in structural reality rather than fantasy, apply two structural constraints:
The Volatility-Anchored Target Ceiling: Cap your profit target at the next structural higher-timeframe order block or a realistic multiple of current daily volatility. If your strategy averages a 2R payoff in live conditions, pencil in a 2R exit during simulation—even if you suspect a macro trend might run for 8R.
The Minimum R:R Threshold: Disqualify any setup where the distance to genuine structural resistance yields less than your system's mandatory risk-to-reward requirement.
The No-Reset Rule: A blown trade or a liquidated session counts permanently. Hitting the reset button after an unexpected loss invalidates the entire testing sample and degrades your session back into static chart review.
Rule 2: Volatility Stress-Testing Against Historical Black-Swan Cascades
A trading system is only as reliable as its behavior during liquidity crises. Instead of testing exclusively across quiet consolidation ranges, stress-test your rules against the most severe systemic shocks in crypto history:
March 12, 2020 (The COVID Liquidity Shock): Bitcoin lost roughly half its value in 24 hours, draining order books across every major exchange.
May 19, 2021 (The Deleveraging Flash Crash): An aggressive 30% intraday plunge driven by cascading long liquidations.
March 11, 2023 (The SVB Banking Crisis): USDC depegged to roughly 87 cents, triggering extreme collateral dislocations.
August 5, 2024 (The Global Macro Deleveraging): An aggressive multi-asset unwind pushed Bitcoin briefly below the 50,000 level.
October 10, 2025 (The Historic 10/10 Cascade): The largest single-day deleveraging event in crypto history, unwinding over 19 billion dollars in leveraged open interest within 24 hours.()
Auditing Simulated Execution During Extreme Runs:
Because platforms like Bitunix PC Ultra run on completed candle snapshots rather than intra-bar order flow, a flash-crash wick may pierce your stop price and recover within the same bar without triggering an automatic exit.
When simulating through historical flash crashes, switch to the 1-minute chart, manually verify whether a candle's extreme low or high breached your stop, and record a conservative, slippage-adjusted fill price rather than assuming an ideal exit.
Rule 3: Evaluating Performance Through Expectancy, Drawdown, and Sharpe Ratios
Win rate is often the first metric retail traders cite, and the least meaningful in isolation.
Consider two contrasting systems:
System A wins 65% of the time, but its winners average half a risk unit (0.5R) while its losers lose a full risk unit (1R). Over 100 trades, 65 wins yield 32.5R of profit, while 35 losses cost 35R. Despite the impressive win rate, the net outcome is negative 2.5R—a steadily bleeding account.
System B wins only 40% of the time, but cuts losers at 1R and lets winners run to 2R. Over 100 trades, 40 wins generate 80R, while 60 losses cost 60R. The net result is positive 20R, averaging a positive edge of 0.2R on every trade taken.
To assess whether your trading replay results represent an actual mathematical edge, track these four structural metrics:
Core Performance Metric | Conceptual Logic | What It Actually Evaluates |
Trade Expectancy | Win percentage times average win amount, minus loss percentage times average loss amount | The net dollar or R-unit edge generated per trade over a large sample |
Profit Factor | Total gross trading profits divided by total gross trading losses | Capital efficiency: values above 1.5 confirm that winners adequately outpace losers |
Maximum Drawdown | Peak-to-trough decline in account balance during your worst losing streak | The psychological and capital pain threshold required to survive the system |
Sharpe Ratio | Net strategy returns relative to return volatility | The consistency of your equity curve; distinguishes true edge from erratic variance |
Built-in summary dashboards rarely capture this full analytical depth. While Bitunix PC Ultra's My Reviews ledger conveniently tracks win rate, largest single-trade loss, and liquidation incidents across your last 30 sessions, you should log each execution into an independent spreadsheet journal.
An audit sample of fewer than 30 trades lacks statistical reliability; target at least 100 documented trades across multiple market regimes before transitioning to real capital.
Replay Trading in Practice: What to Take Away
Replay trading delivers what passive chart reading cannot: hundreds of high-stakes execution repetitions without waiting years for live markets to cycle through identical patterns. Its true utility lies in cultivating emotional neutrality.
When you have watched your setup fail across ten consecutive losing trades during a historical liquidity crunch—and observed how strict risk parameters protected your account from liquidation—live market drawdown ceases to trigger panic.
Software costs no longer represent a barrier to entry. While legacy charting platforms reserve intraday replay for expensive recurring subscriptions, exchange-native architectures like Bitunix PC Ultra offer trading replay free across USDT-margined perpetual pairs without subscription gates.
No simulator can fake the cold sweat of a live margin call. What it can do is buy you survival. Treat every bar like live fire: write down your risk, pay your simulated fees, and take your stops without flinching. Do it a hundred times over historical chaos, and by the time you deploy real capital, the market won't surprise you—it will just be another bar on the screen.