

1. Quick Overview
| Dimension | Traditional Approach (Market List / Watchlist + Page Switching) | Super Filter |
| Asset Selection | Open trading pairs from the list one by one to check their candlestick charts. | Combine multiple filter criteria to identify matching assets in a single search. |
| Relationship with Main Chart | Often requires leaving the current page or switching between pages multiple times. | Filter results are displayed on the same screen, and clicking a result instantly updates the main chart. |
| Criteria Reuse | Relies heavily on memory or external spreadsheets. | Frequently used filter combinations can be saved and applied with one click next time. |
| Ongoing Monitoring | Watchlists are maintained separately. | After filtering, assets can be added to Favorites. Favorites are linked to the PC Ultra Favorites List and are separate from the Watchlist. |
| Display Modes | Primarily list-based. | Switch between List, Candlestick Chart, and Heatmap views. |
| Trading Fees | — | No separate fees are charged for using Super Filter. Trading fees continue to follow the existing fee rules. |
| Result Validity | — | Results represent a market snapshot captured when the filter is run. Run the filter again when market conditions change. |
| Order Placement | — | Clicking a result only switches the chart; it does not automatically place an order. |
| Access | — | Open Super Filter from the bottom of supported chart-based trading pages, such as PC Ultra. |
| Official Access | Bitunix Official Website | — |
2. Product Definition
Super Filter is a market-wide asset screening tool embedded in Bitunix's chart-based trading pages. Users can combine criteria such as strategy templates, contract attributes, technical indicators, candlestick patterns, funding rates, listing age, and market performance (price changes, rankings, and more) to quickly identify trading pairs that match their current strategy across the entire derivatives market.
Filter results are displayed directly within the panel, and clicking a trading pair instantly switches the main candlestick chart, eliminating the need to repeatedly switch between the market list, Watchlist, and chart. Frequently used criteria can be saved for reuse, while selected assets can be added to the Favorites List for ongoing monitoring, creating an integrated "Discover → Confirm → Monitor" workflow.
Feature Summary
| Feature | Description |
|---|---|
| Multi-Dimensional Screening | Screen trading pairs using multiple criteria, including contract types, technical indicators, candlestick patterns, funding rates, and market performance. |
| Multi-Condition Combinations | Combine multiple conditions within the same group to narrow down the screening results. |
| Chart Sync | Click a screening result to switch the main chart without leaving the current trading page. |
| Saved Criteria | Save frequently used filter criteria for quick reuse. |
| Favorites Integration | Add screened trading pairs to Favorites for quick switching and monitoring. |
Common Use Cases
| Use Case | Description |
| Technical Indicator Screening | Screen for trading pairs based on signals such as golden crosses, then open the main chart to confirm the price trend. |
| Candlestick Pattern Screening | Match multiple trading pairs using candlestick pattern criteria, reducing the need to check charts one by one. |
| Funding Rate and Contract Screening | Filter by contract type, positive or negative funding rates, listing age, and other criteria to match a trading plan. |
| Volatility Screening | Identify short-term active trading pairs based on price range, consecutive gains or losses, trading rankings, and other criteria. |
| Strategy Reuse | Save a combination of criteria and run the filter directly the next time you open Super Filter. |
3. Step-by-Step Guide
3.1 Access Super Filter
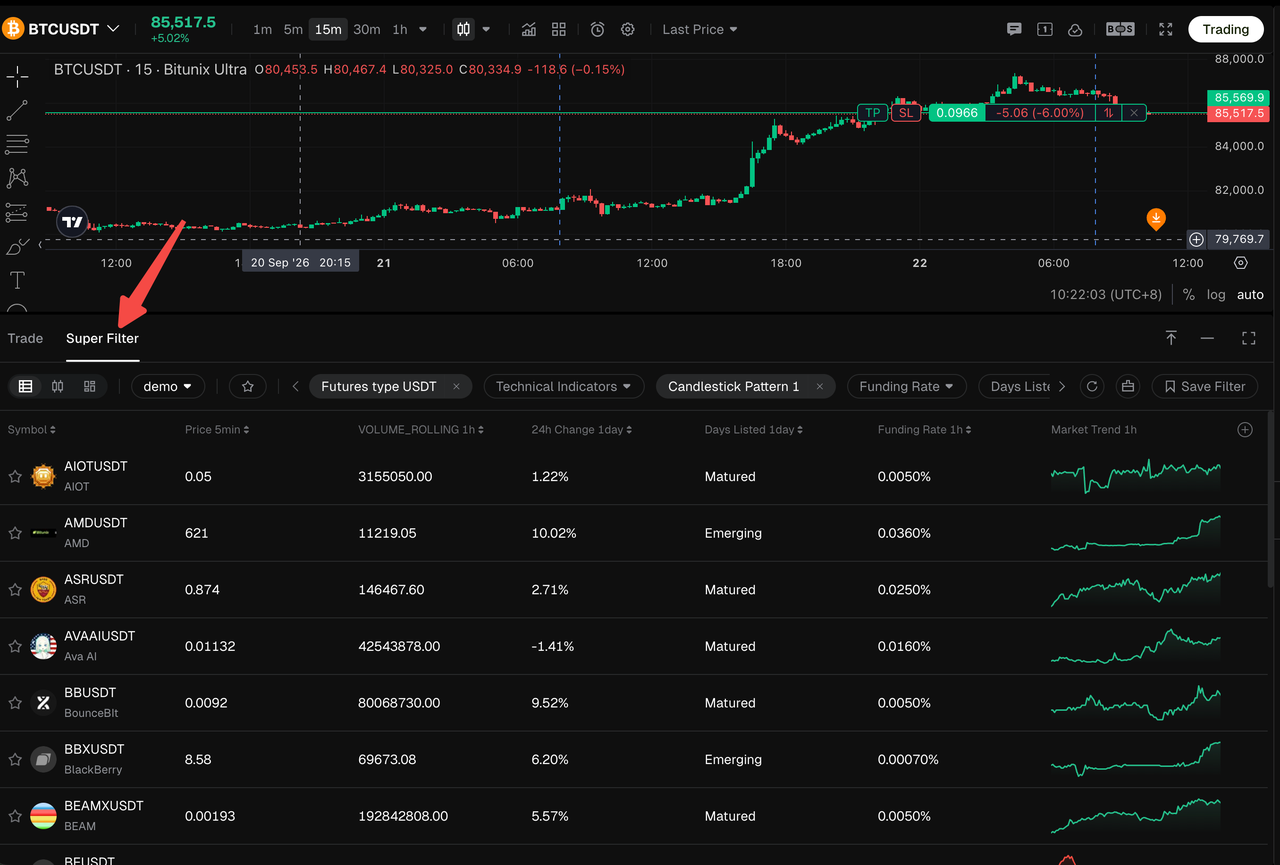
- Open a chart-based trading page that supports Super Filter, such as a supported derivatives trading page with the PC Ultra Chart Layout. The actual entry point is subject to the version currently available.
- Open Super Filter at the bottom of the page to access the criteria configuration panel.
3.2 Set Filter Criteria
Step 1: Select Filter Dimensions
English UI labels and available options may vary by Web version. The terms below follow the terminology used in this guide.
| Filter Dimension | Option | Description |
|---|---|---|
| Futures type | USDT | USDT Futures |
| USD | USD Futures | |
| USDC | USDC Futures | |
| Technical Indicators | EMA(5) | Exponential Moving Average, Period 5 |
| EMA(9) | Exponential Moving Average, Period 9 | |
| EMA(20) | Exponential Moving Average, Period 20 | |
| EMA(50) | Exponential Moving Average, Period 50 | |
| EMA(100) | Exponential Moving Average, Period 100 | |
| EMA(200) | Exponential Moving Average, Period 200 | |
| MA(5) | Simple moving average, period 5 | |
| MA(9) | Simple moving average, period 9 | |
| MA(20) | Simple moving average, period 20 | |
| MA(50) | Simple moving average, period 50 | |
| MA(100) | Simple moving average, period 100 | |
| MA(200) | Simple moving average, period 200 | |
| TRIX | Triple exponential smooth oscillation index | |
| RSI | Relative strength index | |
| ADX | Mean Directional Movement Index | |
| MACD | Moving Average Convergence Divergence | |
| DMI | Directional Movement Indicators | |
| Candlestick Pattern | Hammer | Long lower shadow at lows; bullish reversal. |
| Inverted Hammer | Long upper shadow after decline; bullish reversal. | |
| Shooting Star | Long upper shadow in uptrend; bearish reversal. | |
| Hanging Man | Long lower shadow in uptrend; bearish warning. | |
| Marubozu | Full body, no shadows; strong momentum. | |
| Closing Marubozu | Shadowless close; directional strength. | |
| Doji | Flat body; indecision, potential reversal. | |
| Dragonfly Doji | Long lower shadow, flat body; bullish at lows. | |
| Gravestone Doji | Long upper shadow, flat body; bearish at highs. | |
| Spinning Top | Long shadows, narrow body; indecision. | |
| Engulfing Pattern | Engulfs prior body; reversal signal. | |
| Piercing Pattern | Closes above prior body midpoint; bullish reversal. | |
| Dark Cloud Cover | Closes below prior body midpoint; bearish reversal. | |
| Harami | Inside prior body; momentum fading. | |
| Harami Cross | Doji inside prior body; reversal signal. | |
| Morning Star | Bearish, star, bullish; bottom reversal. | |
| Evening Star | Bullish, star, bearish; top reversal. | |
| Three White Soldiers | Three rising bullish candles; strong uptrend. | |
| Three Black Crows | Three falling bearish candles; strong downtrend. | |
| Funding Rate | Positive | Longs pay funding |
| Negative | Shorts pay funding | |
| Days Listed | New | < 7 days, high volatility |
| Recent | Listed 7–30 days, active trading | |
| Emerging | Listed 30–80 days, volatility converging | |
| Matured | Listed > 180 days, relatively stable | |
| 24h Change | 24h Change >= 20% | Sharp rise |
| 10% <= 24h Change < 20% | Notable rise | |
| 0% <= 24h Change < 10% | Slight rise | |
| -10% < 24h Change < 0% | Slight fall | |
| -20% < 24h Change <= -10% | Notable fall | |
| 24h Change <= -20% | Sharp fall | |
| 24h Change Rank | Top 10% Gainers | Leading gainers today |
| Top 10%~30% Gainers | Among top gainers | |
| Top 10% Losers | Leading losers today | |
| Top 10%~30% Losers | Among top losers | |
| 24h Turnover Rank | Top 10% | Most active, best liquidity |
| Top 30% | Very active, good liquidity | |
| Top 50% | Moderate trading amount | |
| Top 80% | Basic liquidity |
Step 2: Set the specific parameters and add multiple conditions to the same group. Use the drop-down menus to select the appropriate comparison or filter option for each dimension.
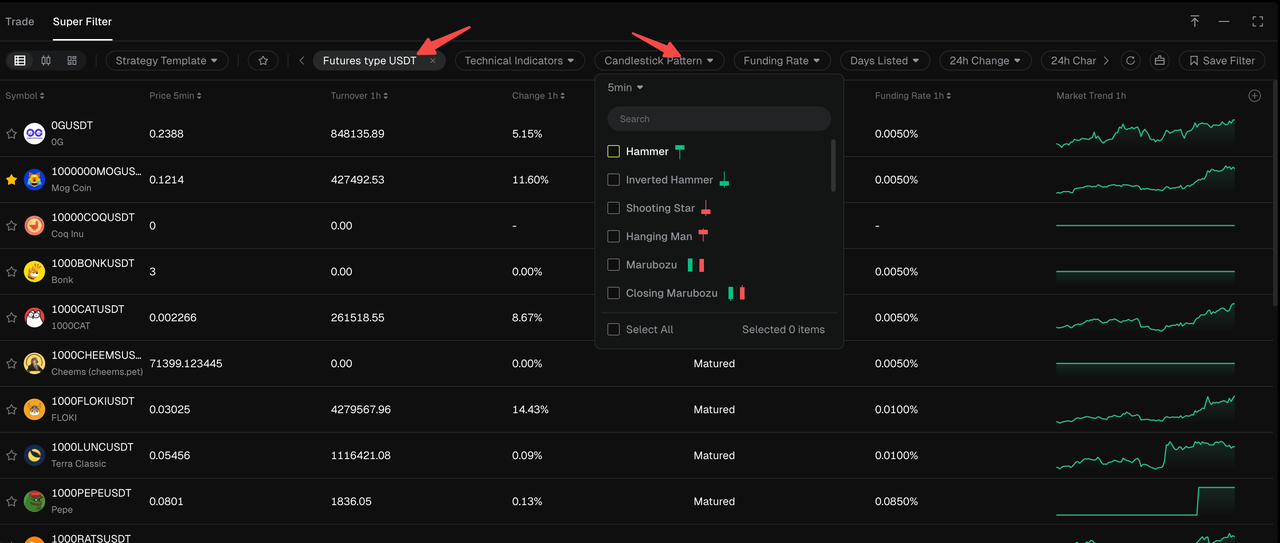
Step 3: Confirm that the conditions have been added, then run the filter.
3.3 View Results and Sync with the Main Chart
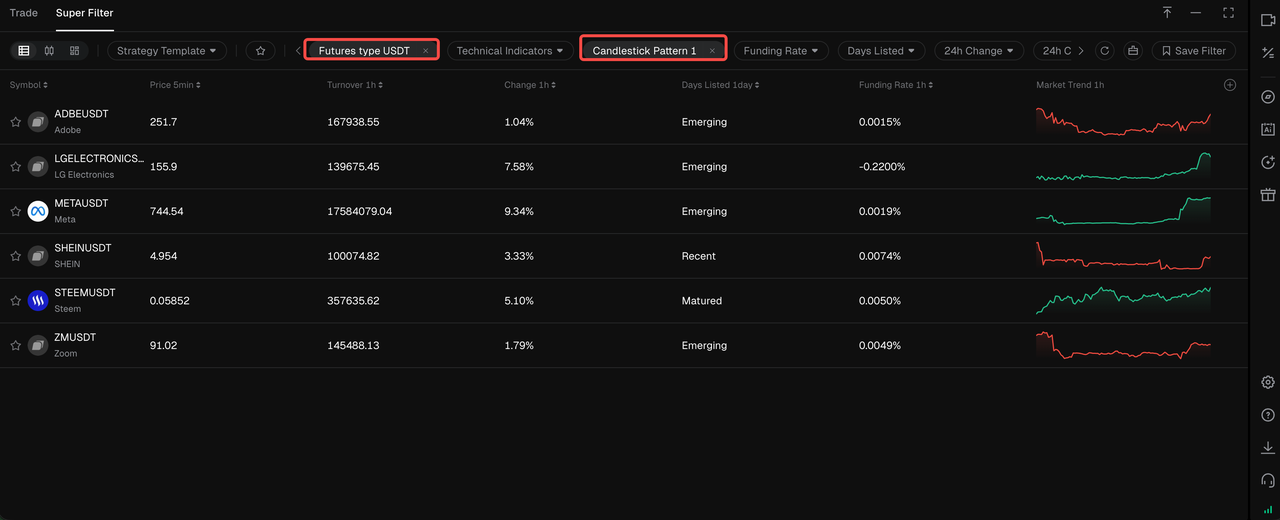
Step 1: After running the filter, trading pairs that match the selected criteria are displayed in the results area.
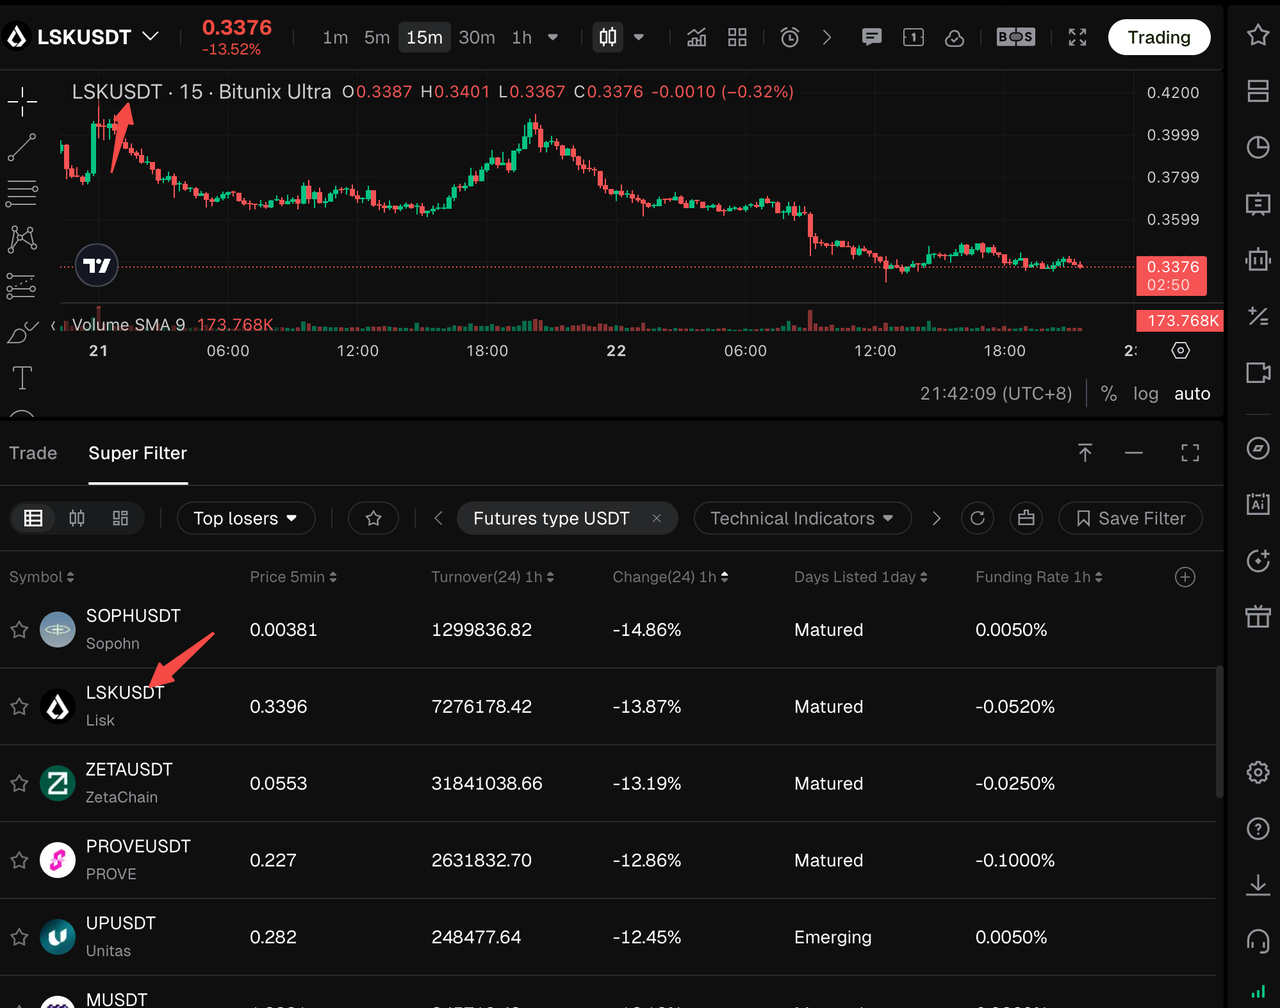
Step 2: Click any filter result to switch the main chart to the corresponding trading pair.
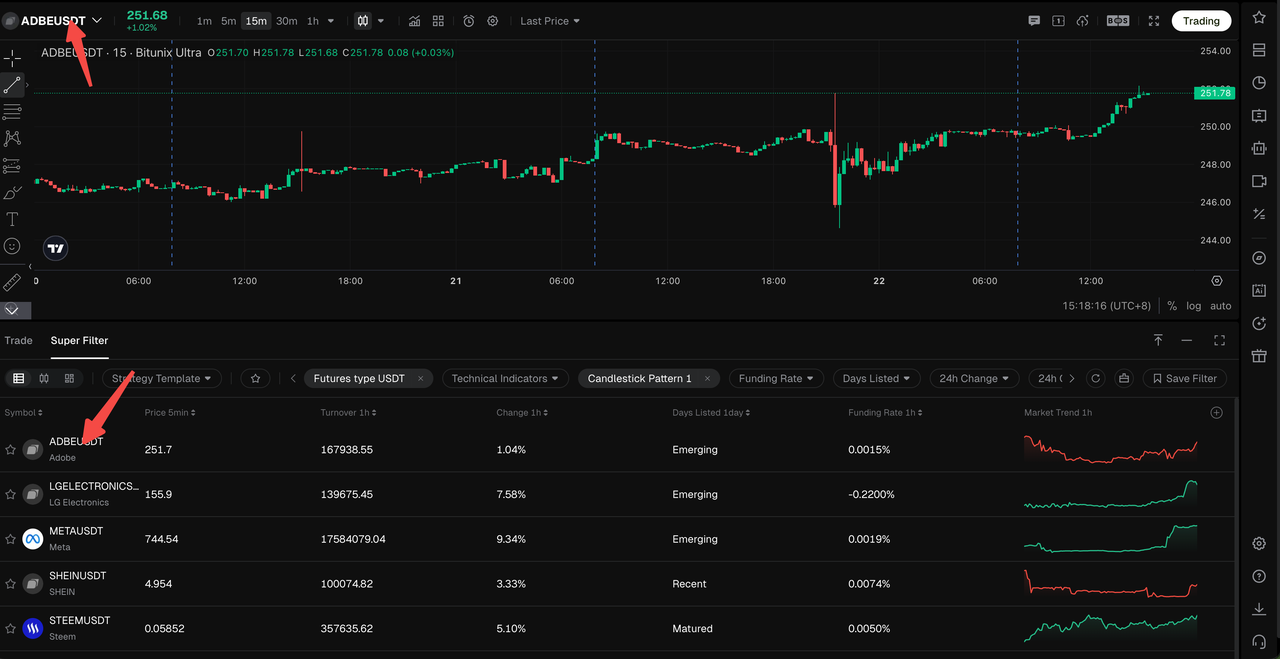
Step 3: Review the results using candlestick trends, technical indicators, and other trading information for further confirmation.
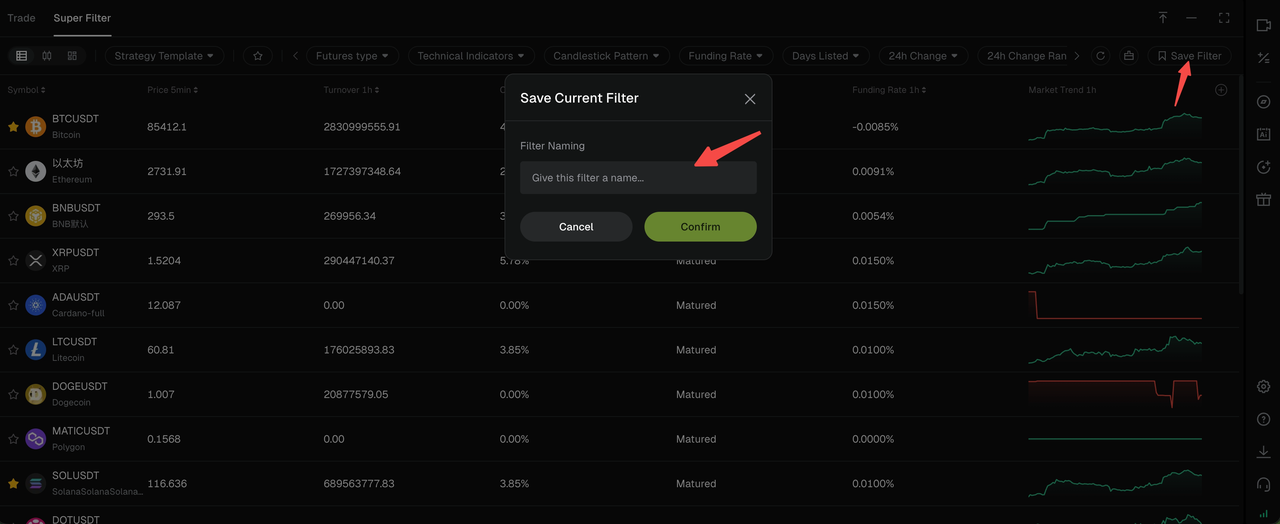
3.4 Save Filter Criteria
Step 1: After configuring the criteria, click Save Filter.
Step 2: When using the same strategy again, open the saved filter.
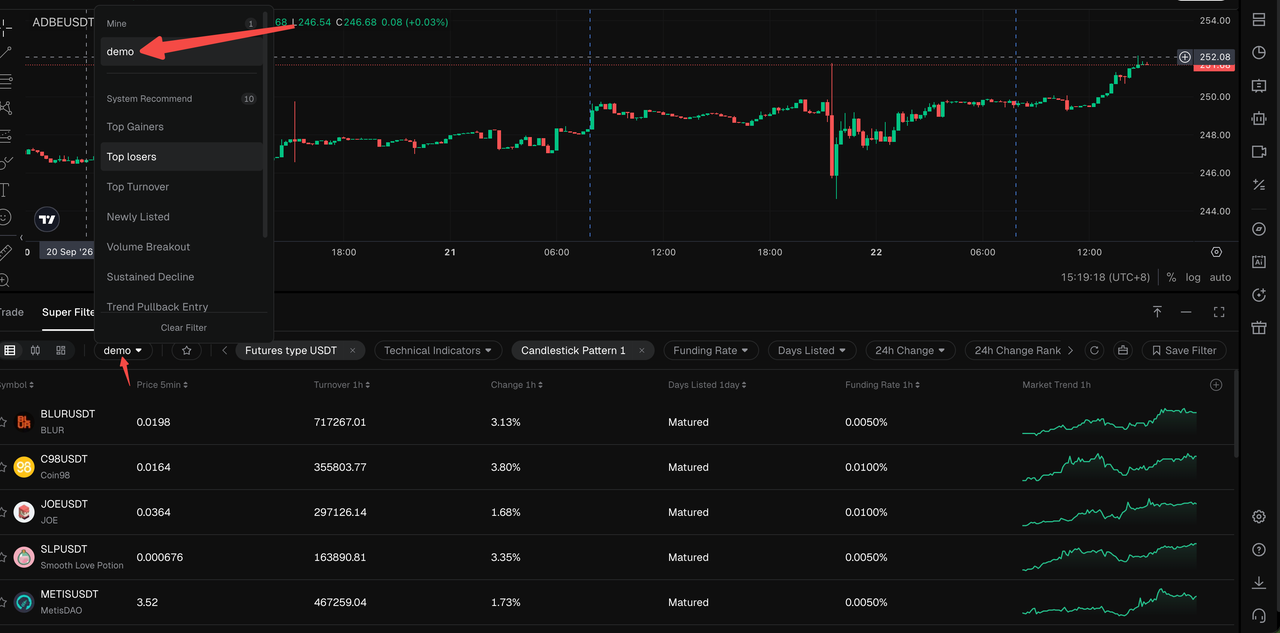
Step 3: Run the filter to view the latest results in the current market without having to configure each criterion again.
3.5 Add Screening Results to Favorites
Step 1: Find the trading pairs you want to continue monitoring in the screening results.
Step 2: Add the corresponding trading pairs to the Favorites List.
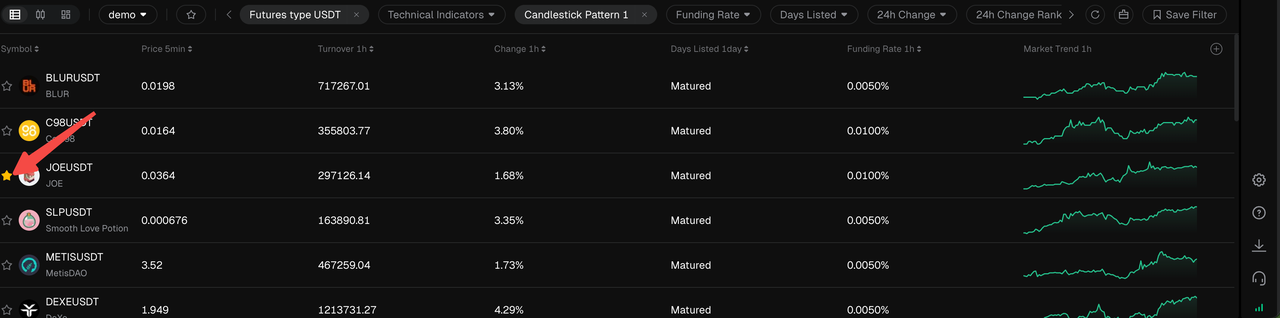
Step 3: Open the Favorites List to switch between and monitor these trading pairs without leaving the main chart.
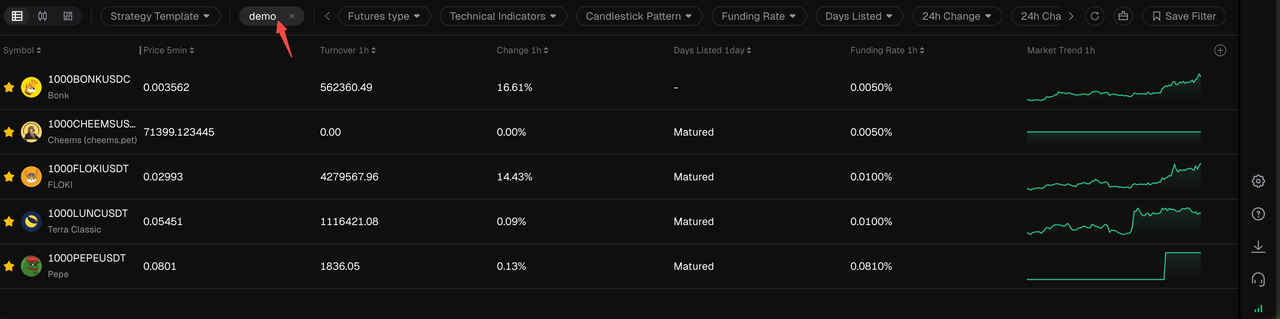
3.6 Switch Between K-Line and Heatmap Modes
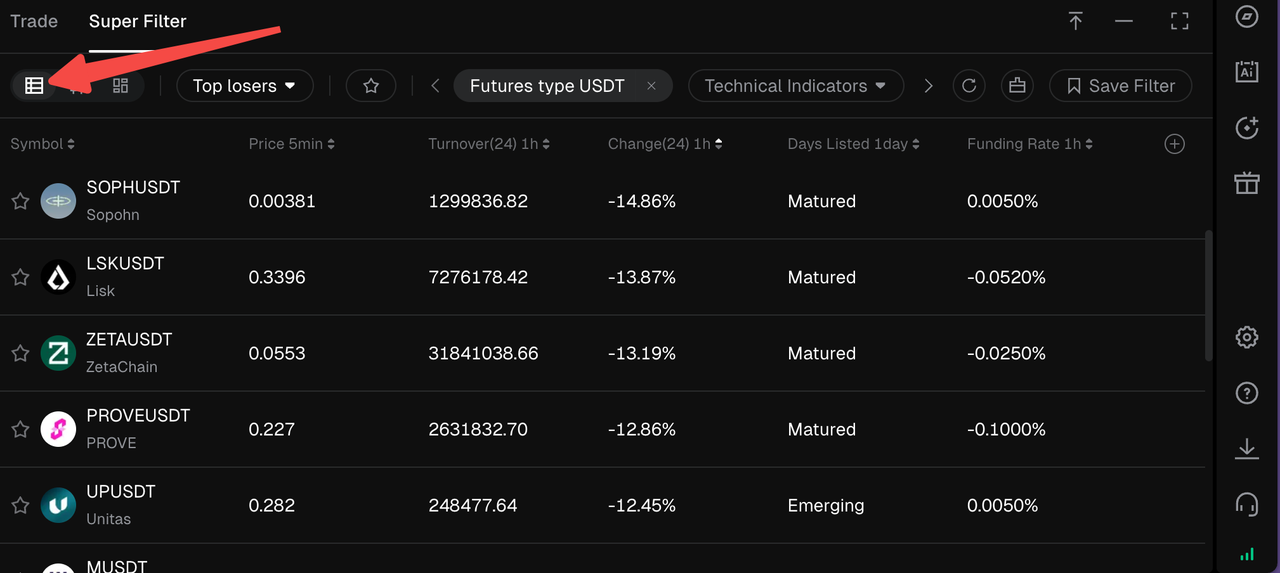
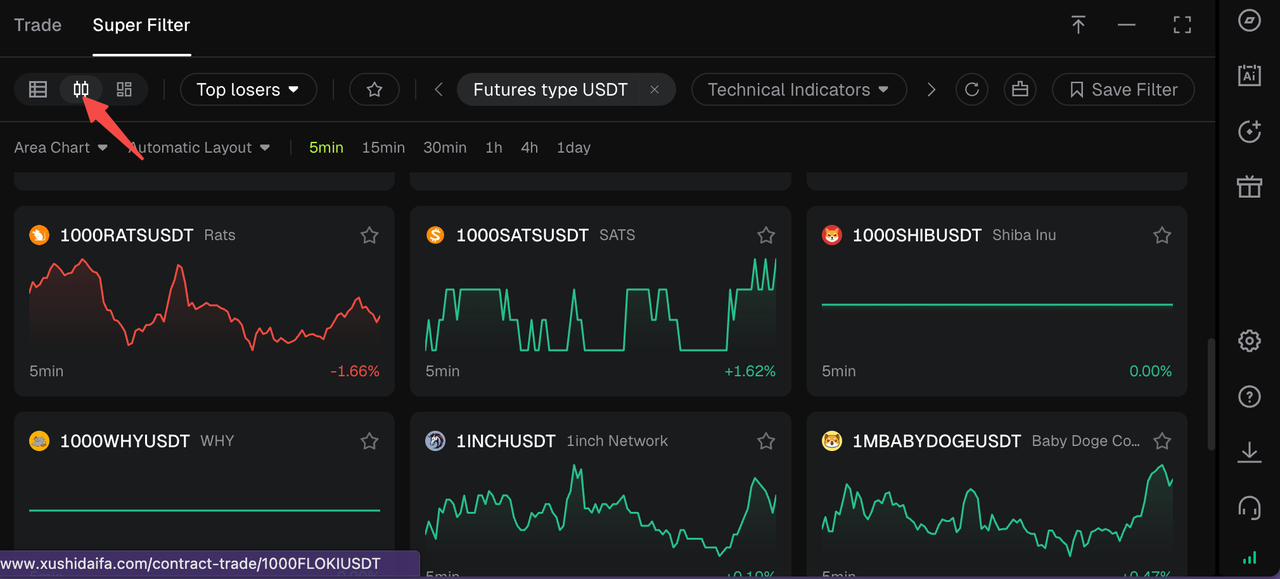
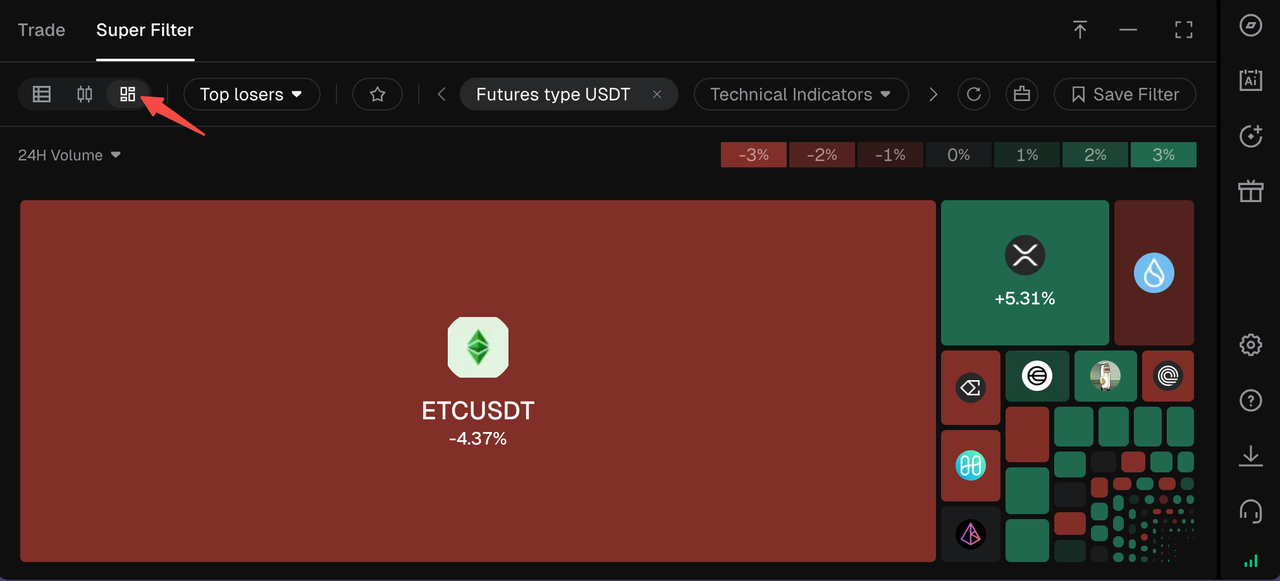
Step 1: Super Filter currently supports List Mode, K-Line Mode, and Heatmap Mode. Click the corresponding mode to switch the display.
List Mode
K-Line Mode
Heatmap Mode
Step 2: After switching to a mode, click any trading pair to view its data in the K-Line area. For example, in List Mode, clicking a trading pair automatically switches the K-Line area to display data for the selected trading pair.
4. Super Filter Video Walkthrough
FAQ
Q1: What criteria does Super Filter support?
A: The current guide covers criteria such as strategy templates, futures types, technical indicators, candlestick patterns, funding rates, days listed, price range, consecutive gains or losses, and trading rankings. Specific options are subject to the actual interface.
Q2: Can I use multiple filter criteria at the same time?
A: Yes. Multiple criteria can be added to the same group to further narrow down the screening results.
Q3: Will clicking a filter result place an order directly?
A: No. Clicking a result only switches the main chart to the corresponding trading pair. You still need to review the market and place the order yourself.
Q4: Can I save filter criteria?
A: Yes. Frequently used combinations of criteria can be saved and reused to run the filter again later.
Q5: Can screening results be kept for long-term monitoring?
A: Trading pairs that you want to continue monitoring can be added to the Favorites List. Screening results reflect the trading pairs that meet the selected criteria when the filter is run, so you should run the filter again as market conditions change.
Q6: Does Super Filter replace the Favorites List?
A: No. Super Filter is used to discover trading pairs that match specific criteria, while the Favorites List is used to continuously monitor trading pairs you are already following. The two can be used together.
Disclaimer
This article is not intended to provide:
(i) investment advice or recommendations;
(ii) an offer or solicitation to buy, sell, or hold digital assets; or
(iii) financial, accounting, legal, or tax advice.
Digital assets, including stablecoins and NFTs, are highly volatile and involve significant risk. Please carefully consider your financial situation and risk tolerance before trading or holding digital assets.
Consult your independent legal, tax, or investment professional to ensure that your actions comply with applicable local laws and regulations.