In 2026, cryptocurrency markets continue to develop with increasing trading activity, new market participants, and more advanced analytical tools. Many traders use technical indicators to better understand price movements, identify market trends, and organize their trading decisions.
Technical indicators do not predict future prices with certainty. Instead, they analyze historical price data, trading volume, and market behavior to help traders evaluate potential scenarios and manage risk more systematically.
So, how do you use crypto technical indicators effectively without relying on unreliable signals?
In this guide, you’ll learn:
What crypto technical indicators are and how they work
The most commonly used indicators for crypto trading
How to combine different indicator categories
Common mistakes when applying technical analysis
Practical methods for building a structured indicator-based approach
What Are Crypto Technical Indicators?

Before exploring specific indicators, it is important to understand what crypto technical indicators are and how traders use them.
In cryptocurrency trading, technical indicators are analytical tools that evaluate historical market data, including price movements, trading volume, and other market information. These indicators apply mathematical calculations to help traders identify trends, measure momentum, analyze volatility, and evaluate possible market scenarios.
Technical indicators can help traders:
Identify potential market trends
Analyze price momentum
Compare current price movements with historical patterns
Create structured entry and exit plans
Monitor market conditions more efficiently
Unlike emotional decision-making, indicators provide objective measurements based on available market data. However, they should be viewed as analytical tools rather than guaranteed signals.
For example, a moving average may help identify the overall trend direction, while RSI may provide information about momentum conditions. However, neither indicator alone can determine whether a market will rise or fall.
Why Technical Indicators Matter in Crypto Trading

Technical indicators are more than visual tools displayed on a chart. They help traders organize market information and evaluate different aspects of price behavior.
1. Trend Detection
Indicators such as moving averages help traders identify whether an asset is generally moving upward, downward, or within a range.
2. Momentum Analysis
Momentum indicators such as RSI and MACD help measure the strength and speed of price movements.
3. Entry and Exit Planning
Tools such as Fibonacci retracement levels and Bollinger Bands can help traders identify important price areas for analysis.
4. Risk Management
Technical indicators can help traders recognize market conditions and adjust their risk management approach.
However, indicators should not replace risk management. Market conditions can change quickly, especially in cryptocurrency markets, where volatility may cause technical signals to become less reliable.
The Four Categories of Trading Indicators

Understanding different indicator categories is essential for building a balanced technical analysis approach.
Technical indicators are generally grouped into four main categories:
Trend Following Indicators
Trend indicators help traders identify the general direction of market movement.
Common examples include:
They are mainly used to understand whether an asset is experiencing an upward trend, downward trend, or consolidation.
Momentum Indicators
Momentum indicators measure the strength and speed of price movements.
Common examples include:
RSI
MACD
Stochastic Oscillator
They are often used to evaluate whether buying or selling momentum is increasing or weakening.
Volume Indicators
Volume indicators analyze trading activity and help traders understand whether price movements are supported by market participation.
Common examples include:
On-Balance Volume (OBV)
Money Flow Index (MFI)
A price movement supported by increasing volume may indicate stronger market participation, while low-volume movements may require additional confirmation.
Volatility Indicators
Volatility indicators measure how significantly price changes over time.
Common examples include:
Bollinger Bands
Average True Range (ATR)
They help traders analyze periods of expanding or contracting market volatility.
How to Choose Indicators as a Beginner
Instead of adding many indicators to one chart, beginners may find it more useful to select indicators based on their purpose:
Goal | Common Indicators |
|---|
Identify market direction | EMA, SMA |
Measure momentum | RSI, MACD |
Analyze volatility | Bollinger Bands |
Confirm trading activity | Volume, OBV |
Identify potential price levels | Fibonacci retracement |
Using several indicators that provide different types of information is generally more useful than combining multiple indicators measuring the same factor.
Top Crypto Indicators You Must Know in 2026
Let’s explore some of the most commonly used indicators for crypto trading, why they are used, and how traders interpret their signals.
No single indicator works in every market condition. Most traders combine different types of indicators to analyze trends, momentum, volatility, and market participation.
1.Moving Averages (MA)
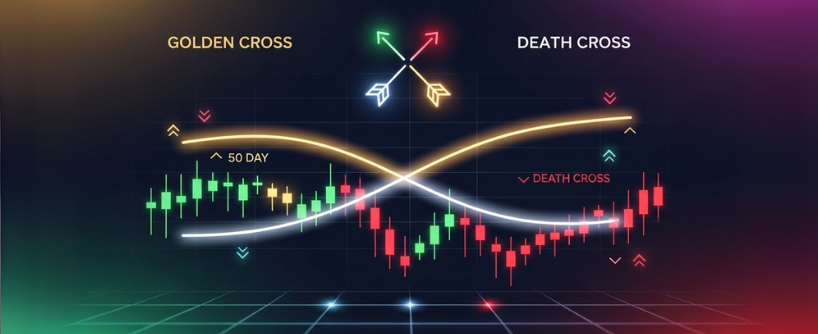
A moving average (MA) calculates the average price of an asset over a specific period. By smoothing short-term price fluctuations, moving averages help traders identify broader market trends.
There are two main types:
The SMA treats all data points equally by calculating the average closing price over a selected number of periods.
For example, a 50-day SMA calculates the average closing price from the previous 50 trading days and is often used to analyze longer-term trends.
The EMA gives greater weight to recent price data, making it more responsive to recent market movements.
Because cryptocurrency markets can experience rapid price changes, many traders use EMA to analyze shorter-term trends.
How do you use MA?
In crypto trading, moving averages are commonly used to:
A commonly discussed example is the Golden Cross, which occurs when a shorter-term moving average crosses above a longer-term moving average. Some traders interpret this as a possible sign of strengthening momentum.
A Death Cross occurs when a shorter-term moving average crosses below a longer-term moving average, which some traders use to evaluate potential weakening momentum.
However, moving average signals are based on historical price data and may react after a trend has already started.
Moving Average Limitations
Moving averages are considered lagging indicators because they use historical prices. They may work better when combined with other analysis methods, such as:
Market structure
Volume analysis
Momentum indicators
Using multiple confirmations can help traders avoid relying on a single delayed signal.
2.Relative Strength Index (RSI)

RSI (Relative Strength Index) is a momentum oscillator that measures the speed and strength of recent price movements on a scale from 0 to 100. It is commonly used to analyze whether an asset may be experiencing strong buying or selling momentum.
Common RSI interpretations include:
However, these levels do not automatically mean price must reverse.
How Does RSI Work?
RSI compares recent gains and losses over a selected period, commonly 14 periods, to estimate momentum strength.
For example:
Traders also watch for RSI divergence, where price movement and RSI movement do not match.
Example:
Some traders interpret this difference as a possible sign that momentum may be weakening.
RSI Limitations in Crypto Markets
RSI can produce misleading signals during strong trends.
For example:
Therefore, RSI is often combined with trend indicators or price action analysis instead of being used alone.
3.MACD (Moving Average Convergence Divergence)

MACD is a momentum indicator that analyzes the relationship between two exponential moving averages.
The standard MACD calculation usually includes:
12-period EMA
26-period EMA
9-period signal line
The indicator contains:
MACD line
Signal line
Histogram
How Does MACD Work?
Traders commonly observe:
MACD Crossovers
When the MACD line crosses above the signal line, it may indicate increasing upward momentum.
When the MACD line crosses below the signal line, it may indicate weakening momentum.
MACD Histogram
The histogram shows the difference between the MACD line and signal line.
Combining MACD With Other Indicators
MACD is often combined with other tools because momentum changes do not always indicate immediate price reversals.
For example:
MACD → evaluates momentum changes
RSI → evaluates momentum strength
Moving averages → evaluate broader trend direction
Using different indicator categories can provide a more complete market view.
4.Bollinger Bands

Bollinger Bands are a volatility indicator consisting of:
A middle moving average
An upper band
A lower band
The distance between the bands changes depending on market volatility.
How Are Bollinger Bands Used in Crypto Trading?
Common observations include:
Bollinger Band Squeeze
When the bands become narrower, it may indicate reduced volatility and a possible increase in future price movement. However, the indicator does not predict whether the breakout will move upward or downward.
Price Near Upper or Lower Bands
When price moves close to the upper band, some traders evaluate whether momentum is becoming extended.
When price moves close to the lower band, some traders evaluate whether selling pressure may be weakening.
Bollinger Bands Limitations
In strong trends, price can continue moving along the upper or lower bands for extended periods.
Therefore, traders often combine Bollinger Bands with RSI, MACD, Volume analysis to evaluate whether a movement has sufficient confirmation.
5.Fibonacci Retracement and Extension
Fibonacci retracement is a technical analysis tool used to identify potential support and resistance areas during price corrections.
It is based on Fibonacci ratios, including:
Traders typically draw Fibonacci retracement levels between significant swing highs and swing lows to analyze possible reaction zones.
How to Use Fibonacci Retracement in Crypto Trading
In an uptrend:
In a downtrend:
These levels are often used to analyze areas where price may react during a pullback.
For example:
After a Bitcoin rally, some traders may observe whether price reacts around the 38.2% or 61.8% Fibonacci levels. However, Fibonacci levels should not be viewed as guaranteed reversal points.
Fibonacci Retracement Limitations
One challenge with Fibonacci analysis is that traders may select different swing points, leading to different results.
For this reason, Fibonacci retracement is usually used together with other analysis methods, including trend indicators, support and resistance analysis, and volume confirmation, to provide a more complete view of potential market conditions.
The Smart Way to Combine Indicators for Crypto Trading Success
Combining indicators effectively is about creating a more complete view of market conditions rather than collecting as many signals as possible.
Different indicators provide different types of information:
Trend indicators help identify market direction.
Momentum indicators measure the strength of price movements.
Volume indicators evaluate market participation.
Volatility indicators analyze price fluctuations.
A balanced approach usually combines indicators from different categories instead of using multiple tools that measure the same factor.
Indicator Categories
1.Trend
Common trend indicators:
Moving averages
Parabolic SAR
Used to analyze the overall market direction.
2.Momentum
Common momentum indicators:
RSI
MACD
Stochastic Oscillator
Used to evaluate the strength and speed of price movements.
3.Volume
Common volume indicators:
On-Balance Volume (OBV)
Money Flow Index (MFI)
Used to analyze whether trading activity supports current price movements.
4.Volatility
Common volatility indicators:
Bollinger Bands
Average True Range (ATR)
Used to understand changes in market volatility.
Beginner-Friendly Example
A simple indicator combination process may look like this:
Step 1: Identify Trend Direction
Use a moving average such as the 50 EMA and 200 EMA to understand the broader market direction.
Step 2: Confirm Momentum
Use RSI to evaluate whether current momentum is strengthening or weakening.
Step 3: Analyze Potential Price Levels
Use Fibonacci retracement levels to identify areas where price may react.
Step 4: Evaluate Volatility
Use Bollinger Bands to understand whether market volatility is expanding or contracting.
The purpose of combining indicators is not to guarantee accurate predictions. Instead, it helps traders organize different types of market information and create a more structured analysis process.
The Triple Confirmation Method
A common approach among technical traders is combining trend, momentum, and timing indicators to evaluate a potential setup.
One example includes:
Trend Identification With Moving Averages
Traders may use the 50-day and 200-day EMAs to analyze the broader trend direction.
For example:
However, moving averages are lagging indicators and should be interpreted alongside other market information.
2. Momentum Confirmation With RSI
RSI can be used to evaluate momentum conditions.
For example:
Some traders also monitor oversold or overbought conditions, but these signals may behave differently depending on the market trend.
3. Entry Timing With MACD
MACD crossovers are often used to analyze potential momentum changes.
For example:
Why Triple Confirmation Does Not Guarantee Results
Using multiple indicators may provide additional context, but it cannot remove uncertainty from crypto markets.
Technical signals can fail because of:
A structured approach should always include risk management alongside technical analysis.
Volume Confirmation: The Missing Piece
Volume is an important part of technical analysis because it shows the level of market participation behind price movements.
For example:
A breakout above resistance with increasing volume may show stronger participation.
A breakout with weak volume may require additional confirmation.
A price increase with declining volume may suggest weakening momentum.
One commonly used volume indicator is On-Balance Volume (OBV).
OBV tracks cumulative volume changes to help traders compare price movements with trading activity.
For example:
If price remains stable while OBV increases, some traders interpret this as increasing buying participation.
If price rises while OBV weakens, it may indicate a potential difference between price and volume trends.
Volume analysis should be viewed as supporting information rather than a standalone signal. Like other indicators, volume patterns can produce misleading signals during volatile or low-liquidity market conditions.
Common Mistakes to Avoid in Crypto Technical Analysis
Technical indicators can provide useful market information, but incorrect usage may lead to poor analysis.
Mistake #1: Using Redundant Indicators
Using too many indicators that measure the same market factor may create the illusion of stronger confirmation.
For example:
RSI and Stochastic Oscillator are both momentum indicators. Using both together may provide similar information rather than independent confirmation.
A better approach is combining different categories, such as:
Trend indicator + momentum indicator
Momentum indicator + volume indicator
Volatility indicator + price action analysis
Mistake #2: Ignoring Market Context
Indicators should not be analyzed separately from broader market conditions.
Important factors include:
A signal that works in a ranging market may behave differently during a strong trend.
Mistake #3: Over-Relying on Single Indicators
No single technical indicator can accurately predict every market movement.
For example:
RSI may remain overbought during strong upward trends.
MACD may produce delayed signals.
Moving averages may react after a trend begins.
Using multiple forms of analysis can help traders evaluate market conditions more comprehensively.
Risk Management: Your Trading Safety Net
Even well-known technical indicators can produce false signals. Risk management remains an essential part of any trading approach.
Important risk management considerations include:
Position Sizing
Many traders limit the amount of capital exposed to a single position to manage potential losses.
The appropriate position size depends on factors such as:
Trading strategy
Risk tolerance
Market conditions
Stop Losses
Stop losses are predefined exit levels designed to limit potential losses if the market moves against a position.
Traders may consider technical levels such as:
Support areas
Resistance areas
Recent price structures
when planning stop-loss placement.
Take Profits
Some traders use technical levels, such as previous highs or Fibonacci extension levels, to identify potential areas for taking profits.
However, market conditions can change quickly, so these levels should be evaluated within the broader trading context.
Risk Management Reminder
Technical indicators help analyze market information, but they do not remove trading risk.
A complete approach combines:
Practical Trading Strategy Example
To understand how multiple indicators can work together, consider a simplified Bitcoin chart analysis example.
Assume Bitcoin is moving within an overall upward trend. A trader may review several indicators:
Trend Analysis
The 50 EMA is above the 200 EMA, suggesting stronger recent price momentum compared with the longer-term average.
Momentum Check
RSI is around 55, showing positive momentum without reaching commonly watched overbought levels.
Price Level Analysis
Bitcoin retraces toward a 61.8% Fibonacci retracement level, which some traders monitor as a potential reaction area.
Volatility Review
Bollinger Bands become narrower, indicating reduced volatility and the possibility of a stronger price movement.
Momentum Confirmation
MACD shows improving momentum conditions, providing additional information about market strength.
Based on this analysis, a trader may create a structured scenario with:
Potential entry area
Risk level
Invalidating conditions
Possible target areas
This example demonstrates how traders organize market information rather than predict future price movements. Technical indicators can support analysis, but unexpected events, market sentiment, and liquidity conditions can still affect price behavior.
Building Your Personal Trading System
Creating a systematic approach to using technical indicators involves developing clear rules and reviewing performance over time.
A basic process may include:
Step 1: Select Suitable Indicators
Choose indicators based on your trading style and timeframe.
For example:
Trend analysis → EMA or SMA
Momentum analysis → RSI or MACD
Volatility analysis → Bollinger Bands
Price level analysis → Fibonacci retracement
Using a smaller number of well-understood indicators is often easier to manage than relying on many tools simultaneously.
Step 2: Define Entry and Exit Conditions
Create specific rules for interpreting signals.
Example:
"Consider a setup when price is above a long-term moving average, momentum indicators show improvement, and price reacts near an important support area."
The purpose of defined rules is to reduce emotional decision-making.
Step 3: Test Your Approach
Review historical market data to understand how your indicator combination performed under different conditions.
Consider testing during:
Trending markets
Sideways markets
High-volatility periods
Step 4: Practice Before Applying Real Capital
New traders can consider practicing their analysis process before committing significant funds.
This allows them to understand:
Conclusion: Understanding Crypto Technical Indicators
Crypto technical indicators are useful tools for analyzing price movements, trends, momentum, volatility, and trading activity.
However, successful technical analysis is not about finding one perfect indicator or a guaranteed signal. It is about understanding how different tools provide different types of market information and applying them within a structured framework.
Key principles include:
Use different indicator categories together to gain a broader view of market conditions.
Avoid relying on a single signal because every indicator has limitations.
Combine technical analysis with risk management to manage potential downside.
Continue learning and reviewing your approach as market conditions change.
Moving averages, RSI, MACD, Bollinger Bands, and Fibonacci retracement are common starting points for learning crypto technical analysis. As traders gain experience, they can refine their own methods based on their goals, timeframe, and risk management preferences.
Technical indicators do not remove uncertainty from cryptocurrency markets, but they can help traders analyze information more systematically and make more structured decisions.
About Bitunix
Bitunix is a global cryptocurrency derivatives exchange trusted by over 5 million users across more than 150 countries/districts. The platform is committed to providing a transparent, compliant, and secure trading environment for every user. Bitunix offers a fast registration process and a user-friendly verification system supported by mandatory KYC to ensure safety and compliance. With global standards of protection through Proof of Reserves (POR) and the Bitunix Care Fund, Bitunix prioritizes user trust and fund security. The K-Line Ultra chart system delivers a seamless trading experience for both beginners and advanced traders, while leverage of up to 200x and deep liquidity make Bitunix one of the most dynamic platforms in the market.
Bitunix Global Accounts
X | Telegram Announcements | Telegram Global | CoinMarketCap | Instagram | Facebook | LinkedIn | Reddit | Medium