Crypto whales leave clues, but reading them takes more than watching price charts. The Whaleportal dashboard brings together funding rates, open interest, and market heatmaps to help traders spot shifts in market sentiment, assess potential liquidation risks, and make better-informed decisions.
What Is Whaleportal?
Whaleportal is a cryptocurrency market analytics dashboard that brings together derivatives data, sentiment indicators, and market visualizations. Traders can use it to examine how market positioning changes alongside price movements, rather than relying on price charts alone.
The platform's published dashboard and educational resources cover indicators such as funding rates, open interest, the premium index, taker buy/sell ratios, Bitcoin exchange balances, and market sentiment. Its charting resources also include heatmaps designed to visualize buying and selling pressure.
You can explore the available indicators on the Whaleportal dashboard and review the platform's indicator guides.
Whaleportal is best understood as an analysis tool, not an automated trading signal provider. Its data can help traders develop and test a market view, but the final interpretation still depends on price action, market conditions, and risk management.
What Market Data Does Whaleportal Provide?
The available data can be grouped into three broad categories:
Derivatives positioning: Funding rates, open interest, premium index, and taker buy/sell ratios help traders examine conditions in futures and perpetual markets.
Market sentiment and price pressure: Sentiment indicators and heatmaps provide additional context for interpreting market behavior.
Historical and market-wide data: Historical metrics and exchange Bitcoin balances help traders compare current conditions with previous periods.
The exact instruments, chart options, and data coverage can vary by indicator. Check the relevant chart or documentation before assuming that a metric covers every exchange, trading pair, or time interval.
Who Can Benefit from Whaleportal?
Whaleportal may be useful for traders who want to:
Check whether a price move coincides with changes in open interest or derivatives positioning.
Assess whether long or short positioning appears unusually one-sided.
Compare buying and selling pressure with the prevailing trend.
Monitor market conditions before entering, adjusting, or closing a futures position.
It is less useful when treated as a substitute for a trading plan. A dashboard can organize information, but it cannot remove uncertainty from the market.
Key Whaleportal Indicators for Crypto Traders
Understanding what each indicator measures is the first step. The more important task is knowing what it can—and cannot—tell you.
Funding Rates and Market Positioning
Funding rates are periodic payments between long and short position holders in perpetual futures markets. Their direction and size can provide clues about the balance of positioning and the cost of maintaining a leveraged position.
When funding is strongly positive, long positions generally pay shorts. This can indicate that bullish positioning is relatively expensive or that demand for long exposure is strong. Strongly negative funding means shorts generally pay longs and may indicate heavier demand for short exposure.
Neither condition automatically predicts a reversal. Positive funding can persist during a strong uptrend, just as negative funding can persist during a selloff.
How to use it: Compare the funding rate with price direction, open interest, and recent volatility. Extreme funding becomes more informative when it coincides with other signs of crowded positioning.
Open Interest and Changes in Trading Activity
Open interest (OI) measures the number of outstanding derivatives contracts that remain open. It helps traders assess whether participation in the derivatives market is expanding or contracting.
Price and OI together provide more context than either metric alone:
Price rises and OI rises: New positions are entering the market as prices advance. This may support the view that participation in the move is growing, but OI alone cannot identify whether the increase reflects net bullish conviction.
Price rises and OI falls: Positions may be closing as the market advances. Short covering can contribute to this pattern.
Price falls and OI rises: New positions are being added during the decline. The direction of the market move is clear, but OI alone cannot establish the motives or net directional exposure of all participants.
Price falls and OI falls: Position closures may be contributing to the decline, including long liquidations or voluntary exits.
These are interpretive frameworks, not fixed rules. OI is an aggregate measure, and every open contract has both a long and a short side.
How to use it: Compare changes in OI with price, trading volume, and funding rates. Look for a consistent pattern rather than drawing conclusions from a single candle or data point.
Premium Index and Futures Market Sentiment
A premium index measures the difference between a futures or perpetual contract price and a reference spot price or index. The precise calculation depends on the instrument and the data provider.
A positive premium indicates that the derivatives price is above its reference price; a negative premium indicates a discount. Persistent or unusually large deviations can provide clues about derivatives demand and market conditions.
A premium does not necessarily mean that the market will continue in the same direction. It can change as prices move, liquidity shifts, or traders adjust their exposure.
How to use it: Compare the premium index with funding rates and spot price action. If the premium and funding rate both become unusually positive, for example, traders may want to investigate whether long exposure is becoming crowded. Confirmation from other data is still necessary.
Taker Buy/Sell Ratio and Trading Pressure
The taker buy/sell ratio compares aggressive buying and selling activity under the data provider's calculation method. Taker orders execute against existing liquidity, making the ratio useful for examining which side is more aggressive in the measured market.
A ratio above 1 generally indicates that taker buying exceeds taker selling within the relevant measurement period. A ratio below 1 indicates the opposite, assuming the provider uses a buy-volume-to-sell-volume calculation.
Aggressive buying does not guarantee a price increase. Sellers may absorb the demand, and the ratio may differ across exchanges or time intervals.
How to use it: Check whether taker buying or selling agrees with the price trend. If aggressive buying rises but price struggles to advance, investigate whether selling pressure or resistance is absorbing the demand.
Bitcoin Exchange Balances and Historical Metrics
Bitcoin exchange balances measure the amount of BTC held in addresses associated with exchanges, subject to the provider's address labeling and data coverage.
A decline in exchange balances can be consistent with withdrawals to self-custody or other destinations. An increase can reflect deposits or transfers into exchange-controlled addresses. Neither movement proves that a specific whale is accumulating BTC or preparing to sell.
Historical metrics help put current readings into context. A funding rate or OI value that looks large in isolation may be ordinary relative to its historical range, while a less dramatic reading may be unusual for the current market.
How to use it: Compare current values with prior periods and consider the time frame, market trend, and data coverage. Treat exchange balances as a broad flow indicator, not a direct record of an individual trader's intentions.
Heatmaps and Market Buying or Selling Pressure
Whaleportal's heatmap guide describes its heatmaps as visualizations of buying and selling pressure derived from multiple market metrics. In the guide's explanation, stronger red areas represent increased selling pressure, while green areas represent increased buying pressure.
These colors should be interpreted in the context of the chart and the platform's methodology. They are not universal signals that price must fall or rise.
For example, selling pressure may increase during an uptrend without ending the rally. If that pressure later fades while the trend remains intact, the market may have more room to advance. The reverse can occur in a downtrend when buying pressure weakens.
How to use it: Read the heatmap alongside price structure, momentum, and other available indicators.
How to Use Whaleportal to Analyze Crypto Market Activity
The goal is not to find one indicator that predicts the next move. It is to build a coherent view from several independent pieces of evidence.
Combine Price Action, Open Interest, and Funding Rates
Start with price direction, then check whether changes in OI and funding rates support or complicate that picture.
Consider a hypothetical example in which Bitcoin rises over several sessions while OI and funding rates both increase. This combination may indicate that participation and the cost of long exposure are growing as the market advances. It does not prove that the rally will continue.
The next questions are more useful than a simple bullish or bearish label:
Is price still making higher highs and higher lows?
Is OI rising steadily or accelerating sharply?
Is funding moving toward an unusually high level relative to its recent history?
Does trading volume support the move, or is price advancing on weakening participation?
If price momentum weakens while OI and funding remain elevated, traders may want to examine the risk of crowded positioning. If the trend remains strong, the same readings may persist without an immediate reversal.
Identify Crowded Trades and Potential Reversals
Crowded positioning becomes a concern when many participants appear exposed in the same direction and market conditions begin to turn against them.
For example, a market may show sharply positive funding, rising OI, and a loss of upward momentum. Together, these conditions can justify closer monitoring for a potential long squeeze. If price falls and leveraged long positions begin closing, the decline may accelerate.
The same logic applies in reverse to heavily positioned shorts. Negative funding, rising OI, and a price breakout may signal that short positions are vulnerable if the move continues.
However, these combinations do not establish how many positions will be liquidated or where liquidation prices sit. Those questions require additional data, and market conditions can change before a crowded trade unwinds.
Use Heatmaps to Examine Market Pressure
Heatmaps can help show whether buying or selling pressure is strengthening or fading around a price move.
A practical review can follow three steps:
Establish the trend. Identify the current price structure and whether the market is trending or moving sideways.
Check pressure changes. Look for areas where buying or selling pressure increases, decreases, or diverges from price behavior.
Seek confirmation. Compare the heatmap with OI, funding, volume, and relevant price levels before deciding whether the signal matters.
Suppose price continues to rise while a heatmap shows increasing selling pressure. That divergence deserves attention, but it is not sufficient evidence to short the market. If the selling pressure fades and price holds its structure, the trend may continue.
The important signal is the relationship between the data and the market context—not the color alone.
Confirm Market Signals with Additional Evidence
Before acting on an apparent signal, check whether it is consistent across the relevant data sources and time frames.
A short checklist can help:
Is the signal visible across more than one time interval?
Do price, volume, OI, and funding tell a reasonably consistent story?
Could the move reflect short covering, long liquidation, or a temporary liquidity gap?
Is there a known event that could distort normal market behavior?
Does the potential trade still make sense after fees, slippage, and the risk of adverse price movement?
Conflicting indicators are not necessarily a problem to solve by choosing one side. They may simply show that the market lacks a clear direction.
How to Analyze Whale Activity and Potential Liquidation Risks
Whale activity and liquidation risk are related to market behavior, but they are not interchangeable. A trader may use derivatives indicators to assess crowded positioning without knowing which wallets hold those positions.
What Derivatives Data Can Reveal About Market Positioning
Funding rates, OI, taker activity, and premium data can help traders assess broad conditions in derivatives markets.
They may reveal that positioning is becoming more expensive, participation is expanding, or aggressive orders are failing to move prices as expected. These observations can help identify conditions in which a sharp move might have an outsized effect on leveraged traders.
They do not reveal the identity of the participants behind every position. Aggregated market data cannot reliably establish that a particular whale opened a position, increased leverage, or is close to liquidation.
How Funding Rates and Open Interest Can Indicate Crowded Positions
Consider a market where funding is unusually positive and OI has climbed rapidly. If price then loses an important support area, leveraged long positions may face increased pressure. Forced position closures can add selling to an already falling market.
But there are several possible explanations for the same data. OI may include positions with different strategies, and the aggregate figures do not show every trader's entry price, margin balance, or liquidation threshold.
A more careful interpretation is that high funding and rising OI can flag conditions worth monitoring for a potential long squeeze, especially when price momentum deteriorates. They do not confirm that a liquidation cascade is imminent.
What Liquidation Data Can and Cannot Confirm
Liquidation data, where available from a reliable provider, can show reported forced position closures over a specified period and market. It may help explain a sudden move or identify periods of elevated liquidation activity.
There are important limits:
Coverage may differ by exchange, contract, and reporting interval.
Aggregated liquidation figures do not necessarily identify the individual trader or wallet involved.
Estimated liquidation levels or heatmaps are not the same as confirmed liquidation events.
Historical liquidations do not guarantee that similar price levels will trigger the same outcome in the future.
If the objective is to monitor actual liquidation events, use data that explicitly reports them and check the provider's methodology. If the objective is to estimate liquidation risk, combine positioning indicators with volatility, liquidity, and price structure, and describe the result as an estimate.
How to Verify Whale Wallet Activity with On-Chain Data
Tracking a specific whale requires a different evidence trail from monitoring derivatives-market sentiment.
On-chain analysis generally starts with an identifiable blockchain address and examines its transactions, token balances, and interactions with contracts or exchanges. A large transfer may be worth investigating, but it does not automatically establish a buy, sell, or directional market bet.
For example, a transfer to an exchange can be consistent with a potential sale, but it may also relate to custody changes, collateral management, or another transaction. Similarly, a withdrawal from an exchange does not by itself prove long-term accumulation.
To make a stronger assessment, verify the address, identify the asset and transaction type, examine the destination, and consider whether the activity has a plausible alternative explanation. Address labels and entity attribution should also be treated cautiously unless supported by reliable evidence.
Whaleportal's published materials establish its role as a market analytics and derivatives dashboard, but the sources reviewed here do not establish that it provides comprehensive tracking of specific whale wallets or their liquidation thresholds. Do not infer those capabilities from its name or from general market indicators.
Limitations of Whaleportal and Crypto Market Indicators
Even a well-designed dashboard can only be as useful as its data, methodology, and interpretation.
Why One Indicator Is Not Enough
Each metric describes a different part of the market. Funding rates relate to the cost of maintaining perpetual positions; OI measures outstanding contracts; taker ratios describe aggressive order flow; and heatmaps visualize pressure based on a particular calculation.
A single reading can be misleading. Positive funding may persist throughout a rally, rising OI can accompany different trading strategies, and strong taker buying may be absorbed by passive sellers.
Cross-checking indicators helps build context, but it does not eliminate uncertainty. Indicators can also be correlated, so several metrics moving together do not always represent several independent pieces of evidence.
Data Coverage, Timing, and Market Regime Changes
Before relying on a reading, check the market, exchange coverage, interval, and calculation method. Two providers may display different values because they aggregate different venues or use different definitions.
Timing matters, too. A chart may update at a different frequency from another data source, and a delayed or incomplete reading can distort comparisons. A strategy that works in a strong trend may also behave poorly in a low-volatility range or during an abrupt liquidity shock.
Use historical comparisons carefully and avoid assuming that past indicator behavior will repeat under different market conditions.
Why Market Signals Do Not Guarantee Trading Outcomes
Whaleportal data can help traders frame hypotheses, but it cannot guarantee a profitable entry, a successful exit, or advance notice of a liquidation event.
Trading costs, slippage, leverage, execution delays, and sudden changes in liquidity can all affect outcomes. A market can also remain crowded longer than expected or reverse before a trader's position can be closed.
Use the dashboard as one input in a broader process that includes position sizing, predefined invalidation levels, and limits on acceptable losses. The purpose of analysis is to improve decision-making under uncertainty, not to remove that uncertainty.
Applying Whaleportal Insights to Crypto Trading
Whaleportal's indicators can be used alongside a trader's own exchange charts and risk controls. They should not be treated as a substitute for checking the specific contract, price, margin requirements, and execution conditions on the platform where a trade will be placed.
Build a Market Monitoring Checklist
A repeatable process is more useful than reacting to every change in a dashboard.
Review price structure: Establish the prevailing trend, important price levels, and current volatility.
Check derivatives positioning: Review OI and funding rates to see whether participation or the cost of exposure is changing.
Examine trading pressure: Use taker ratios and heatmaps to check whether aggressive buying or selling supports the price move.
Assess liquidation risk: Look for signs of crowded positioning and weakening price structure. Use reported liquidation data if you need to verify actual events.
Define the risk before entering: Consider the position size, leverage, trading costs, exit conditions, and the possibility that the analysis is wrong.
This checklist does not generate a trade signal. It helps organize the evidence before a decision is made.
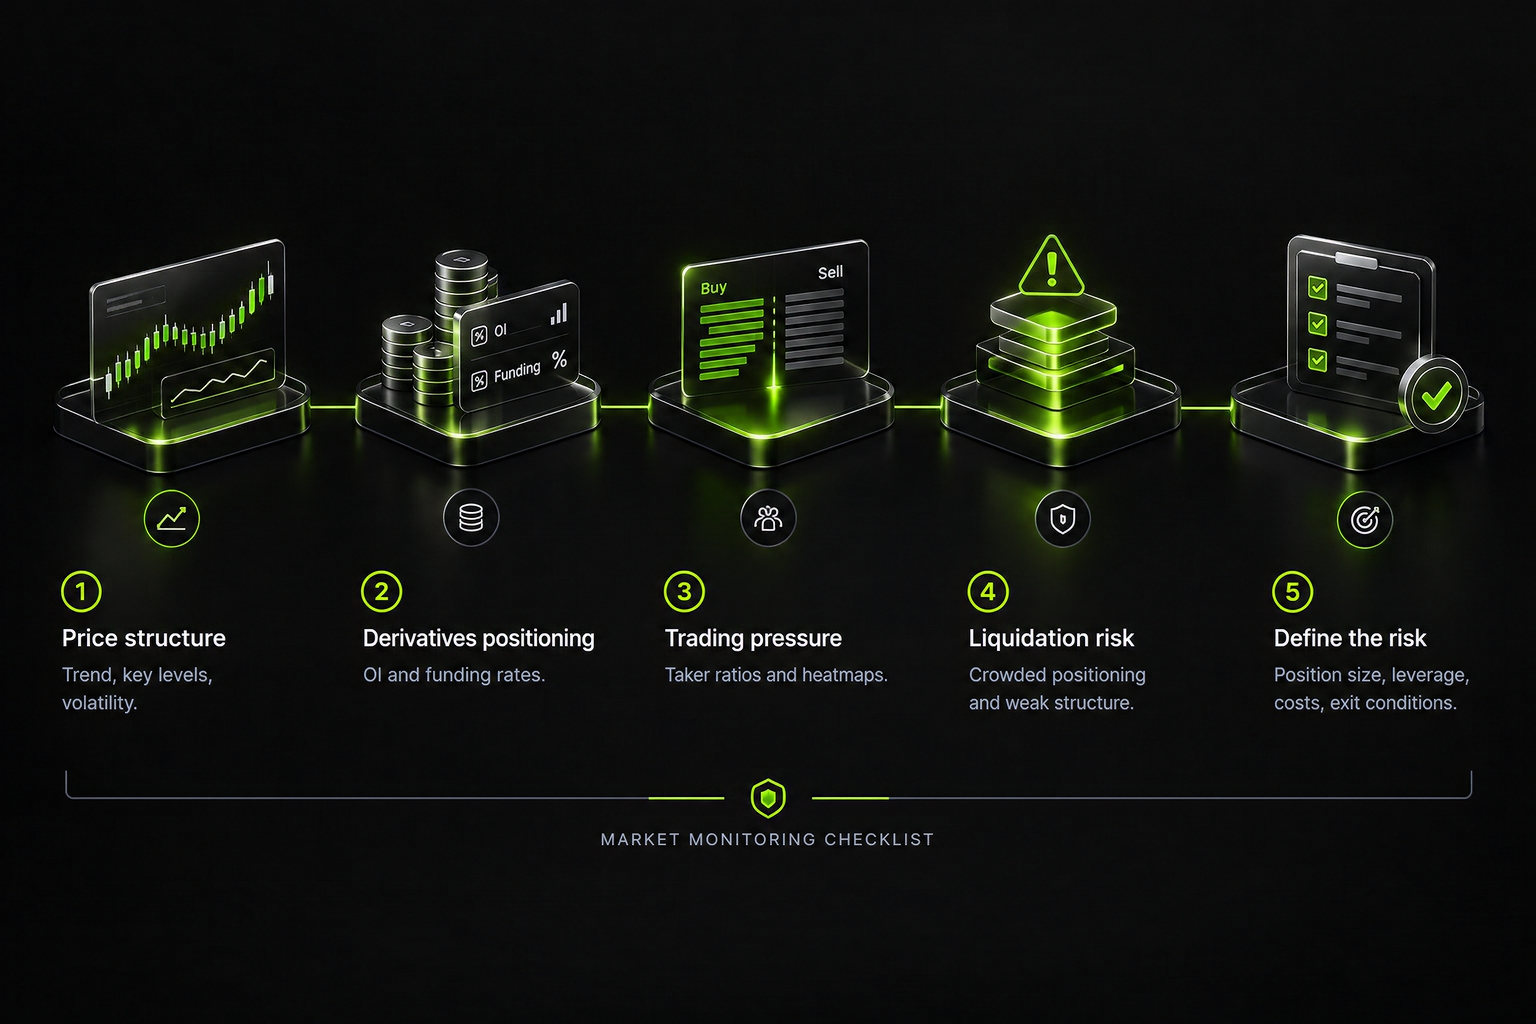
A five-step checklist for evaluating crypto market conditions and defining risk before entering a trade.
Combine Market Data with Position and Risk Management
For traders using Bitunix or another crypto exchange, external market indicators can provide context for a setup. The execution decision should still be based on the specific instrument and the trader's own risk plan.
For example, if a futures setup looks attractive but OI and funding suggest crowded positioning, a trader might reassess the potential downside, reduce exposure, or wait for clearer confirmation. Those are risk-management options, not guaranteed ways to avoid losses.
Likewise, a dashboard reading should not replace checking the exchange's current mark price, margin requirements, or liquidation rules when trading leveraged contracts. External analytics and exchange execution data serve different purposes.
The most useful workflow combines market context, a clearly defined trading hypothesis, and a risk plan that remains valid even if the expected move does not occur.