The crypto market never closes. Bitcoin can break a key level during Asian trading hours, Ethereum can react to macro news overnight, and altcoins can move sharply while most traditional markets are offline.
For active traders, the challenge is not finding more charts. It is building a charting workflow that helps separate meaningful price action from market noise.
The best live crypto charts give traders three things:
A clear view of market structure, trends, and key price levels.
The tools needed to analyze setups without switching between multiple platforms.
A direct connection between analysis and execution.
Modern crypto traders often combine exchange-native charts for execution with dedicated analysis platforms such as TradingView for advanced indicators, alerts, and technical research.
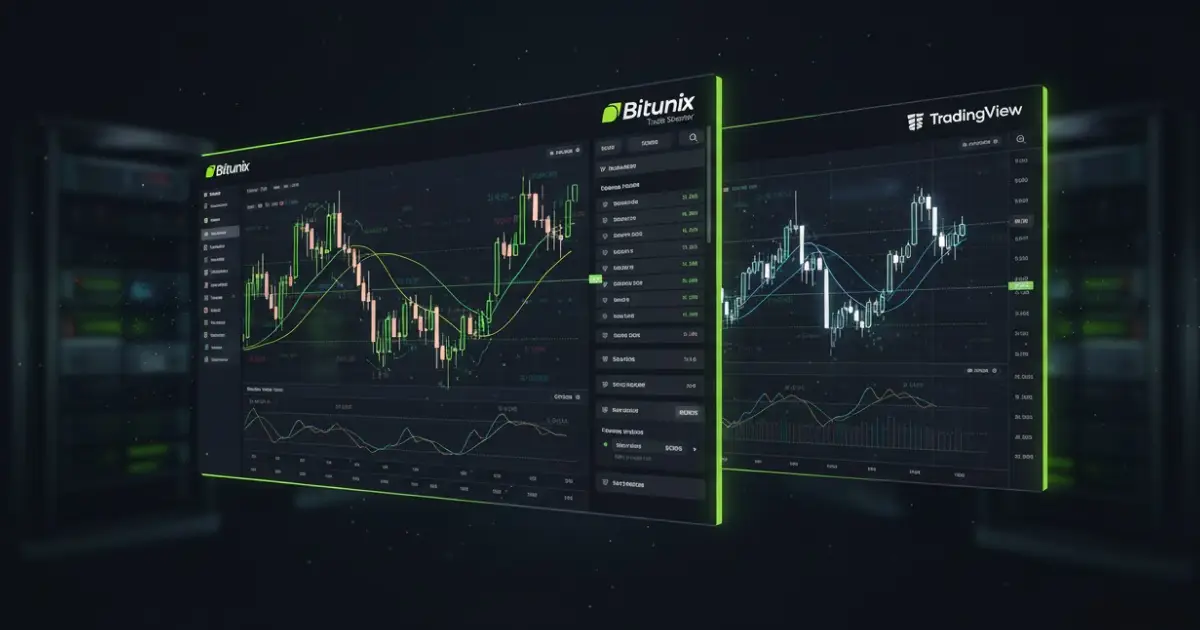
On Bitunix, traders can analyze price movements, manage orders, and execute trades from a unified workspace. Combined with TradingView integration, this creates a workflow that moves from market research to trade execution with fewer distractions.
Whether you are monitoring Bitcoin, Ethereum, or emerging crypto assets, the goal is not to add more indicators or open more screens. A better charting setup helps you make faster decisions with a clearer process.
Why Live Crypto Charts Matter for Traders

Live crypto charts help traders understand what the market is doing before making decisions. Price movement alone is not enough; traders need context around trend direction, volatility, liquidity, and key levels.
Unlike traditional financial markets, crypto trades 24/7. This creates both opportunities and challenges. A price breakout can happen at any hour, but constant market activity also creates more noise.
A useful chart allows traders to answer several important questions quickly:
Is the market trending or moving sideways?
Where are major support and resistance zones?
Is current volatility expanding or decreasing?
Are recent price movements part of a larger market structure?
For example, a Bitcoin chart showing a breakout above resistance tells only part of the story. Traders may also need to check trading volume, volatility conditions, and whether the move aligns with higher-timeframe trends.
A well-designed chart workspace reduces this complexity by putting important information in one place.
On Bitunix, traders can view price action, order placement tools, and market information within the same interface. This reduces unnecessary switching between platforms when a trade setup develops.
TradingView adds another layer for deeper analysis. Traders can create watchlists, apply technical indicators, draw levels, and configure alerts based on specific market conditions.
Together, exchange charts and external analysis tools create a practical workflow:
Research → Identify setup → Confirm conditions → Execute → Review
This process is more valuable than simply searching for the “perfect” indicator.
The Bitunix Chart Workspace at a Glance

A strong trading workspace should make analysis and execution feel connected. Bitunix’s chart interface is designed around this principle, allowing traders to monitor price movements while preparing orders.
After selecting a trading pair, traders can customize their chart view based on their preferred workflow.
Common chart actions include:
Switching between different timeframes.
Adding technical indicators.
Drawing support and resistance levels.
Comparing price movements across assets.
Moving between spot and perpetual markets.
A practical setup for many traders includes multiple timeframe views:
Trading Goal | Common Timeframes |
Short-term market movement | 1-minute, 5-minute, 15-minute charts |
Intraday structure | 1-hour, 4-hour charts |
Higher timeframe trend | Daily and weekly charts |
Instead of constantly changing settings, traders can save layouts based on their trading style.
For example:
A spot trading layout focused on accumulation zones and longer-term trends.
A perpetual futures layout focused on volatility, entries, and risk levels.
Small workflow improvements can reduce mistakes during fast-moving markets.
Simple Chart Setup Tips
Create separate layouts for different trading strategies.
Keep frequently used timeframes visible.
Save drawing templates for recurring analysis.
Remove indicators that do not influence actual decisions.
A clean chart is easier to interpret under pressure.
TradingView for Advanced Crypto Analysis and Market Alerts

TradingView is widely used by crypto traders who need deeper technical analysis, customizable layouts, and automated alerts beyond basic exchange charts.
While exchange-native charts are designed around execution, TradingView focuses more on research and analysis.
Traders can use TradingView to:
Build multiple watchlists for different market conditions.
Apply technical indicators across multiple timeframes.
Create custom chart layouts.
Set alerts when price reaches important levels.
Test trading ideas with historical data.
A common mistake among newer traders is adding too many indicators and assuming more information leads to better decisions.
In practice, a smaller set of well-understood tools often provides clearer signals.
A practical TradingView setup may include:
Analysis Purpose | Common Tools |
Trend identification | 20 EMA, 50 EMA, 200 SMA |
Momentum analysis | RSI, MACD |
Volatility measurement | ATR, Bollinger Bands |
Market structure | Horizontal levels, trend lines, volume |
The goal is not to predict every price movement. It is to create a repeatable process for evaluating market conditions.
For example, a trader analyzing Bitcoin may use:
Daily charts to identify the broader trend.
4-hour charts to locate important support and resistance zones.
15-minute charts to refine potential entries.
This multi-timeframe approach helps connect short-term decisions with larger market structure.
Building a Clean Crypto Charting Workflow

A reliable trading workflow starts with a clear question, not with random chart browsing.
Before opening multiple charts or indicators, define what you are trying to understand:
Is the market trending or ranging?
Are you looking for a breakout or a pullback?
Are you analyzing a long-term position or a short-term trade?
A structured workflow can look like this:
1. Define the Market Context
Start with a higher timeframe chart.
Review:
Overall trend direction.
Major support and resistance zones.
Recent volatility changes.
Previous market reactions around key levels.
The purpose is to understand where price currently sits within the broader structure.
2. Mark Important Price Areas
Avoid filling charts with unnecessary drawings.
Focus on levels that have clear meaning:
Previous highs and lows.
Strong rejection areas.
Consolidation zones.
Breakout points.
A small number of meaningful levels is usually more useful than dozens of lines.
3. Confirm on Lower Timeframes
After identifying a potential area, move to a lower timeframe.
For example:
Daily chart → identify the main zone.
4-hour chart → confirm structure.
15-minute chart → refine execution timing.
Lower timeframes should improve precision, not change your overall market view.
4. Execute Directly From Your Analysis
Once a setup meets your criteria, execution should be straightforward.
On Bitunix, traders can place orders directly alongside the chart.
Common order types include:
Limit orders for planned entries.
Market orders when immediate execution is required.
Stop orders for predefined risk control.
The important part is consistency. A chart analysis process is only useful when it connects with actual execution decisions.
5. Review Every Trade
Professional traders improve by reviewing decisions, not only outcomes.
A simple trade journal can include:
Record | Example |
Entry reason | Breakout above resistance |
Entry price | Marked execution level |
Risk level | Invalidation point |
Market condition | Trending or ranging |
Post-trade review | What worked and what changed |
Screenshots are especially useful because they preserve the original market context.
Over time, reviewing past trades can reveal patterns in your decision-making.
Crypto Chart Drawing Tools Traders Actually Use
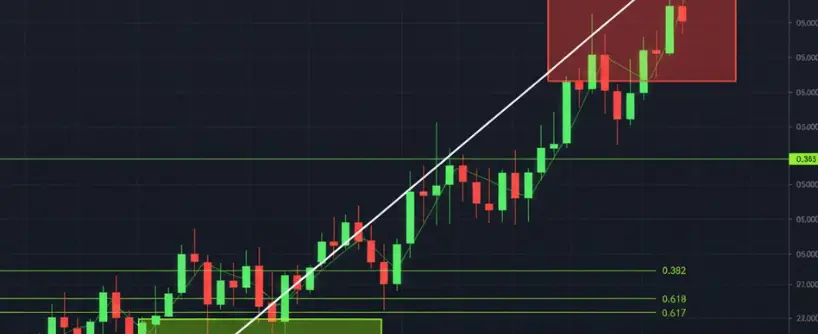
The best charting tools are the ones that help traders quickly identify market structure without creating unnecessary complexity.
Most professional chart setups rely on a small group of drawing tools.
Horizontal Support and Resistance Levels
Horizontal lines are among the most commonly used charting tools.
They help identify:
Instead of marking every minor movement, focus on levels where price has shown repeated reactions.
Trend Lines and Channels
Trend lines help visualize market direction.
They can be used to identify:
Rising or falling price structures.
Potential trend weakness.
Areas where momentum may change.
A trend line should support market analysis, not become a forced prediction tool.
If a line only works after repeatedly adjusting it, it may not represent meaningful market structure.
Fibonacci Retracement Levels
Fibonacci tools are often used to measure potential retracement areas.
Many traders combine Fibonacci levels with:
A Fibonacci level alone does not provide a complete trading signal. It becomes more useful when multiple factors point toward the same area.
Rectangles and Trading Zones
Rectangles are useful for marking areas rather than exact prices.
Examples include:
Accumulation ranges.
Consolidation zones.
Breakout areas.
Risk management zones.
For active traders, zones are often more practical than trying to predict a single perfect entry price.
A clean chart should answer one question quickly:
"What matters here?"
If a chart requires several minutes to understand, the setup may contain too much information.
Indicator Setups That Support Better Decision-Making
Technical indicators are most useful when they answer specific questions. They should support market analysis, not replace a trading plan.
Many traders make their charts harder to read by adding too many indicators at once. A better approach is to assign each indicator a clear purpose.
A practical indicator framework:
Purpose | Indicator | What It Helps Analyze |
Trend direction | 20 EMA, 50 EMA, 200 SMA | Market bias and broader trend |
Momentum | RSI, MACD | Strength, weakness, and momentum changes |
Volatility | ATR, Bollinger Bands | Price range and market activity |
Market structure | Support/resistance levels | Important reaction zones |
Moving Averages for Trend Context
Moving averages help traders understand whether price is moving with or against a broader trend.
Common examples:
20 EMA: Short-term momentum.
50 EMA: Medium-term trend direction.
200 SMA: Long-term market structure.
A trader may use moving averages as a reference point rather than a standalone entry signal.
For example:
The key is combining this information with price structure and market conditions.
RSI for Momentum Analysis
The Relative Strength Index (RSI) measures recent price momentum.
Traders often use RSI to identify:
RSI should not be treated as a simple buy-or-sell signal.
A high RSI does not automatically mean price must fall, and a low RSI does not guarantee a reversal.
Context matters:
ATR for Volatility and Risk Planning
Average True Range (ATR) measures market volatility.
Traders use ATR to understand:
Whether current price movement is unusually large.
How much room price normally moves.
Where risk levels may need adjustment.
For example, a stop level that is too close during a highly volatile period may be affected by normal market fluctuations.
Using volatility data helps traders create more realistic risk parameters.
K-Line Ultra on Bitunix
K-Line Ultra on Bitunix is designed to make mobile chart analysis faster and easier to read, especially when traders need to monitor markets away from a desktop setup.
A mobile trading chart needs to prioritize clarity.
Key chart features that matter in fast markets include:
Clear candlestick visualization.
Smooth zooming and navigation.
Easy access to technical indicators.
Convenient drawing tools.
Quick review of price movements.
For traders managing positions on mobile devices, small interface improvements can make a difference.
For example, quickly checking whether price is holding a support zone or approaching a predefined level is easier when the chart remains readable.
When comparing live crypto charts, usability matters as much as the number of available features.
A chart with fewer distractions can help traders focus on the information that affects decisions.
Placing Orders Directly From the Chart
The connection between analysis and execution is an important part of an effective trading workflow.
A common challenge for traders is the gap between finding a setup and placing an order.
A typical process looks like this:
Identify a potential setup on the chart.
Mark the entry area.
Define the invalidation level.
Select the appropriate order type.
Review the trade after execution.
Bitunix allows traders to place orders alongside their chart analysis, reducing unnecessary switching between screens.
Different situations may require different order types:
Order Type | Common Use Case |
Limit order | Planned entry at a specific price |
Market order | Immediate execution when timing matters |
Stop order | Predefined exit or trigger conditions |
The chart provides the market context. The order panel turns that analysis into an action.
Alerts That Protect Your Attention
Traders do not need to watch every candle. Well-designed alerts help monitor important conditions without constant screen time.
Instead of reacting to every small movement, traders can create alerts around predefined scenarios.
Examples:
Price breaks above a previous high.
Price returns to a key support zone.
A moving average structure changes.
Momentum reaches a specific level.
Alerts are especially useful for:
Swing traders monitoring multiple assets.
Part-time traders who cannot watch markets continuously.
Traders following planned setups.
A good alert system turns chart monitoring from a passive activity into a rules-based process.
The idea is simple:
Plan first. Respond when conditions are met.
Screens, Scanners, and Simple Trading Dashboards
More screens do not always create better analysis. A focused dashboard usually provides more value than a crowded workspace.
A practical crypto dashboard may include:
A small watchlist of liquid trading pairs.
Key market levels.
Relevant indicators.
Notes about current trade ideas.
Alerts for important conditions.
Many traders make the mistake of monitoring too many assets.
A smaller watchlist can improve focus because traders become more familiar with:
Typical volatility patterns.
Historical price behavior.
Important reaction zones.
A clean dashboard helps answer:
Risk Management Starts With Chart Analysis
Charts are not only for finding opportunities. They also help traders define risk before entering a position.
A complete workflow includes:
Entry level.
Exit conditions.
Invalidation point.
Position size.
Post-trade review.
On Bitunix, traders can use features such as margin settings and stop orders to manage positions according to their own risk approach.
A disciplined process focuses on consistency rather than predicting every market movement.
A useful trading journal can track:
Category | Example |
Setup type | Breakout, pullback, range trade |
Entry reason | Price reaction at key level |
Risk level | Defined before execution |
Result | Reviewed after trade completion |
Over time, this information helps traders identify which approaches fit their own process.
Workflow Examples You Can Apply
Breakout Swing Trading Workflow
A breakout setup focuses on identifying when price moves beyond an established range.
Example process:
Mark a clear resistance zone on the daily chart.
Wait for price confirmation above the level.
Use a lower timeframe to monitor a possible pullback.
Execute according to the predefined plan.
Review whether the breakout followed the original expectation.
The focus is not predicting the breakout before it happens. It is creating a structured response when conditions appear.
Mean-Reversion Scalping Workflow
A mean-reversion approach focuses on short-term price movement returning toward an average value.
Example process:
Use a short timeframe such as 1-minute or 5-minute charts.
Identify significant extensions away from average price levels.
Monitor whether momentum weakens.
Execute only when the setup matches predefined rules.
Review execution quality afterward.
Short-term trading requires discipline because small mistakes can quickly accumulate.
Conclusion
The best live crypto charts are not defined by the number of indicators or features they include.
A useful charting setup helps traders understand market structure, organize decisions, and execute plans consistently.
A practical workflow combines:
A clean exchange chart for execution.
TradingView or similar tools for deeper analysis.
A limited indicator framework.
Alerts for important market conditions.
Regular trade reviews.
The goal is not to predict every market movement. It is to build a repeatable process that helps you respond to changing conditions.
Keep charts simple, focus on meaningful information, and let your own trading data guide future improvements.