The best TradingView alternatives for crypto in 2026 are not cheaper charting websites. For most crypto day traders they are exchange terminals that already include the two things TradingView charges for: multi-chart layouts and a market screener. Bitunix PC Ultra is one example. Every account gets multi-window chart layouts, a screener with 19 candlestick patterns, and order entry on the same chart, with no subscription tier.
Most "TradingView alternatives" target stock traders with fundamentals and broker plugins. If you're a crypto analyst monitoring 30 perpetual pairs, you need something else entirely: multi-chart layouts, instant setup scanning, and chart-native execution.
If you are setting up a screen for live streaming, the livestream screen setup guide covers that in detail. If you want the full cost comparison of paid tools versus free ones, see the streamer tech stack breakdown. Here, the focus is multi-chart viewing and opportunity discovery.
Why Day Traders Need Dedicated Multi-Chart Setups for Crypto
Every crypto trader evaluating chart platforms checks for one thing before anything else: multi-chart layouts. You simply cannot track this market one ticker at a time.
When a Bitcoin liquidation cascade hits, it never stays contained. It flushes open interest out of 50 altcoins in five minutes flat. You see the exact same herd behavior when a sector bid arrives—eight AI perps or memecoins start running inside the exact same thirty-minute window. Flipping through browser tabs to check candles one by one is an easy way to miss the move entirely. If you aren't seeing that spillover happen live on a single display, your fills are going to suffer.
The Rise of Multi-Pair Day Trading Strategies in Fast Markets
Intraday crypto is rarely about analyzing a chart in isolation. You're almost never just trading an altcoin—you're trading its spread against Bitcoin.
When BTC dumps into support, does your ticker hold its bid or fall off a cliff? When the market bounces, which pair gets bought first? That spread is where the edge actually is. Whether you're playing relative strength, chasing narrative leaders, or trading pairs, it fall apart if you're clicking back and forth between browser tabs. You need those candles pinned side by side, updating tick for tick, or you simply miss the turn.
The practical requirement is simple: four to eight charts visible at once, each on its own timeframe and indicator set, with the same time window aligned. On TradingView that is a Plus or Premium feature. On an exchange terminal built for derivatives, it should be standard.
Why Single-Chart Interfaces Cause Traders to Miss Key Market Movements
Cycling through ten browser tabs to track ten pairs is an easy way to bleed money. Every alt-tab costs you a couple of seconds—the browser takes a beat to render, your eyes have to re-find the level, and your mental map resets. Inevitably, the breakout wick fires on tab seven while you're staring at tab two. By the time you click over, you're chasing.
The cost is not only missed entries. It is also late exits, because a stop that should have been tightened after BTC broke a level gets adjusted after the altcoin has already followed. A 24/7 market makes this worse. There is no closing bell that resets the board, so the trader who can only see one chart is permanently sampling the market instead of watching it.
The Challenge of Syncing Timeframes Across Multiple Trading Pairs
Tiling four charts on a screen is completely useless if they aren't talking to each other.
Glance at a 15-minute SOL wick next to a 1-hour BTC candle, and you'll start trading divergences that don't actually exist. A functional setup requires real chart synchronization—locking timeframes, zoom levels, and crosshairs across every single tile simultaneously. When you scrub your cursor over an impulsive candle on chart one, the vertical guideline needs to slice through the exact same millisecond on every other asset without lag.
That sync mechanic is the acid test. If a free TradingView alternative can't handle it, you aren't looking at a pro trading terminal; you're just looking at a glorified grid of static thumbnails.
The Limitations of Free Charting Platforms for Multi-Pair Analysis
Free charting tiers are designed as trials, not workstations. The limits are set precisely at the point where a trader starts doing serious multi-pair work, which is why "free alternatives to TradingView" is such a common search. The constraints fall into three groups.
Single-Chart Paywalls and Pop-up Ads on Free SaaS Tiers
The following table shows how TradingView's non-professional plans scale the features that matter for multi-pair crypto trading, at list prices as of October 2026 (verify on tradingview.com/pricing before subscribing, as plans change):
Plan | Monthly price | Annual price | Charts per tab | Indicators per chart | Ads |
Basic (free) | $0 | $0 | 1 | 2 | Yes |
Essential | $14.95 | $155.40 | 2 | 5 | No |
Plus | $34.95 | $359.40 | 4 | 10 | No |
Premium | $69.95 | $719.40 | 8 | 25 | No |
Two catches immediately break a standard workflow:
First, the free plan's two-indicator cap rules out a basic EMA + RSI + volume setup on one chart.
Second, the feature a day trader most needs, four or more charts per tab, starts at $359.40 a year on annual billing.
Most competitors run the exact same squeeze. GoCharting, for example, locks free accounts to two charts and a single device, then puts live crypto feeds behind a separate paywall.
Browser Latency and Memory Drain When Opening Dozens of Tabs
Tiling separate browser tabs to dodge a paywall breaks down the moment volatility picks up.
It handles two or three tickers fine, but scaling to eight tabs forces your machine to run eight separate WebSocket connections and eight isolated canvas rendering loops. Memory usage spikes, fans kick in, and chart updates start dropping frames during fast liquidation wicks—the exact seconds where you need real-time prices. You also end up with eight disconnected watchlists, desynced indicators, and alerts firing silently in background tabs.
A proper multi-pane workspace consolidates data into a single pipe and rendering pass. It takes the strain off your machine, keeping charts responsive under heavy order flow without needing a high-end desktop.
External Chart Disconnect: Analysis Silos vs. Market Timing
A separate charting tool has no connection to your trading balance. You spot a setup on one screen, but taking it still requires clicking over to your exchange, pulling up the pair, and typing in your size manually.
That delay ruins fills. When the tape speeds up, those extra few seconds easily mean taking heavy slippage on a breakout or mistyping your position size in a rush.
It also breaks the screening loop. A screener on one site and a chart on another means every candidate has to be re-typed into a search box before you can even look at it. That friction is the reason crypto traders increasingly treat exchange-native terminals as the best TradingView alternatives for their workflow rather than as a compromise.
What to Look for in Free Alternatives to TradingView
Traditional equity criteria mean nothing here. Fundamentals, broker links, and novelty AI alerts won't help you pick a tool for intraday crypto.
The criteria below are the ones that decide whether a free tool can replace a paid charting subscription for multi-pair crypto work.
Smooth Multi-Grid Rendering Without High GPU/FPS Latency
You only find out if a multi-chart layout works during a liquidation cascade. Throw the maximum number of 1-minute charts on screen and watch what happens. If the candles freeze or data depth quietly throttles, it’s just for show. Right after that, hit refresh—if your custom layout and drawings disappear, move on.
Integrated Market Screening and Real-Time Pattern Recognition
A proper crypto screener has to live directly inside your charting workspace. It needs to filter for specific technical triggers and candle structures, not just lazy 24-hour percentage gainers that only show you what already pumped.
The second a scanner flags a setup, clicking that ticker should instantly pull it up on your primary execution chart. If the tool can't save your custom filter presets between sessions, you're just wasting time rebuilding your scans every single day.
Native Indicator Synchronization Across Correlated Assets
The third requirement is synchronization: symbol, interval, visible range and crosshair locked across windows, with the option to keep an indicator template consistent across all of them. Without it, the multi-chart grid becomes a set of unrelated pictures. Beyond these three, there are secondary factors that decide whether the tool holds up day to day. The following table summarises what to check:
Criterion | What to verify | Why it matters for crypto |
Multi-chart capacity | Max windows per layout; per-window timeframe and indicators | Sector moves play out across several pairs at once |
Window sync | Symbol / interval / date range / crosshair lock | Prevents comparing mismatched timeframes |
Screener depth | Indicator and candlestick conditions, not just % change | Finds setups across hundreds of pairs |
Chart-to-order path | Order entry and position lines on the same page | Removes the tab-switch gap at execution |
Alerts | Indicator, drawing and pattern alerts, not only price | Covers the pairs you are not looking at |
Cost structure | Features gated by tier vs. standard for all accounts | A "free" tier that caps charts is a trial |
Account persistence | Layouts and templates follow your login | Needed for multi-device and streaming setups |
A tool that passes the first four rows is a working alternative. A tool that passes all seven is a replacement.
Bitunix PC Ultra: One of the Best Free TradingView Alternatives in 2026
Against the checklist above, Bitunix PC Ultra is one of the few options where the multi-chart layout, the screener and the order panel are all on one page and none of them is tied to an account tier. It is a layout mode of the Bitunix web futures terminal rather than a separate product: open any USDT, USDC or USD perpetual pair, click Ultra at the top-right of the chart, and the page reloads with the candlestick chart in the main area, the order panel fixed on the right and the order book moved to an on-demand drawer. Positions, open orders and margin settings are unaffected by the switch.
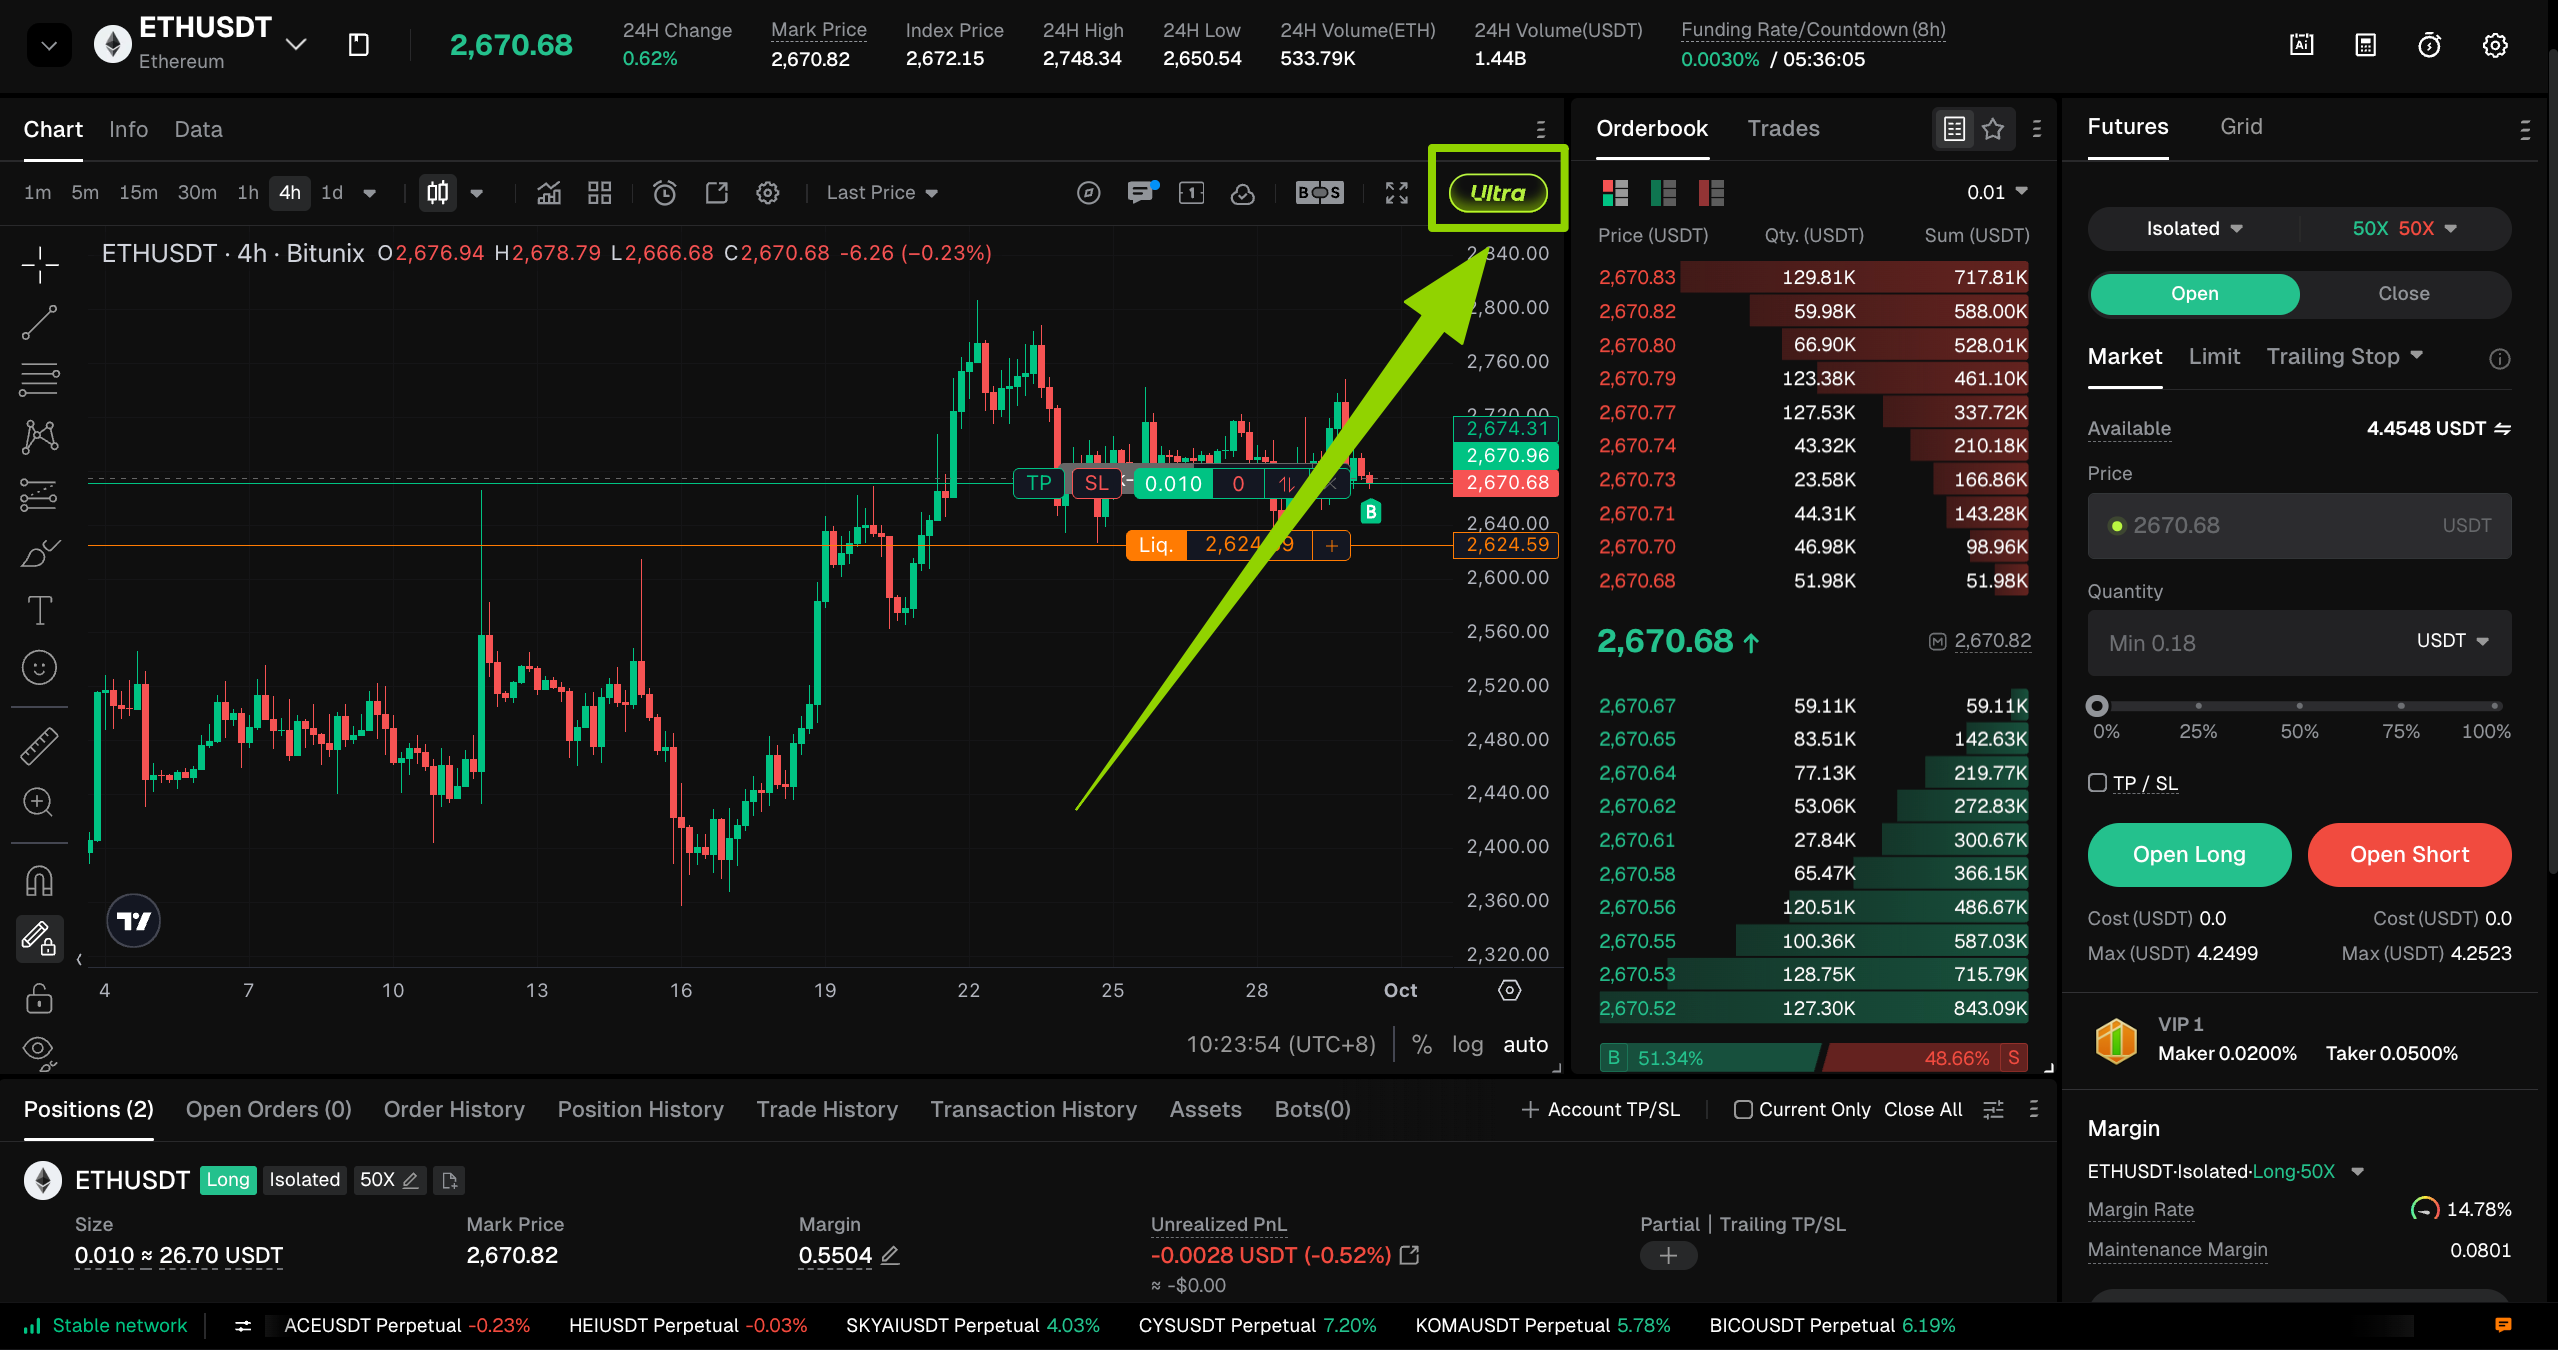
Click "Ultra" at the top-right of the Bitunix futures chart to switch to the PC Ultra layout mode.
Native Multi-Chart Layouts Directly Inside the Futures Terminal
Bitunix fits anywhere from 2 to 16 charts onto a single screen using 35 layout presets, but the real draw is in-panel execution—you can fire orders directly from whichever window you're looking at.
Each tile runs its own ticker, timeframe, chart style, and indicator template independently. When you need everything aligned, global sync toggles lock the symbol, interval, date range, and crosshair across the entire grid. That keeps timestamps honest when you're comparing relative strength and cuts out the alt-tab execution gap entirely.
Inside the Ultra layout the chart area also supports split view, so two pairs can sit side by side at full width, while Super Filter's candlestick grid handles the wider sweep across many pairs at once. For context, TradingView's eight-chart tab is a Premium feature at 69.95 a month; its 16-chart tab is Ultimate at 239.95. On Bitunix the window count is a layout setting, not a plan.
Maximizing Screen Space with Full-Screen Immersive Mode
Hotkeys control the entire workspace.
Hit Esc to hide all panels and go full-screen. When a setup hits, tap Space to pop up the order ticket, and use the arrow keys to check open orders. Toolbars hide in slide-out drawers so an order book doesn't permanently eat half your screen. It includes webcam slots for streamers, but for solo trading, the benefit is simple: maximum screen space for price action.
Retaining Professional Indicator Depth at Zero Subscription Cost
The reason to list Bitunix among the best free TradingView alternatives in 2026 is that the free part does not come with reduced charting.
There are no artificial restrictions here: zero ads, no indicator caps per chart, and custom templates sync between the web terminal and mobile app in about three seconds. All 100+ indicators, 23 timeframes, and drawing tools are unlocked out of the box rather than gated behind a subscription.
The cost model is worth stating plainly. PC Ultra, the multi-screen layouts and Super Filter are standard for every registered account; Bitunix earns on trading fees, which are the same whether you use the Standard page or the Ultra layout.
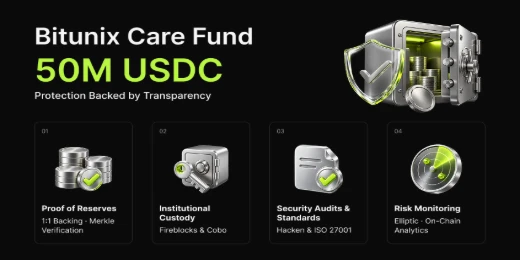
Account security follows the exchange's usual framework, including an audited Proof of Reserves and a $50 million Care Fund, which matters once your charting tool is also where your margin lives. Regional restrictions apply, and leveraged perpetual futures carry liquidation risk regardless of how good the chart looks.
Multi-Chart Viewing Modes: Grid, Candlestick Array, and Heatmap
Multi-chart viewing on Bitunix happens in two places: the multi-screen layout, which is a persistent workspace of independently configured windows, and Super Filter's result views, which show a filtered set of pairs in three switchable modes. The second is where discovery happens, and each mode answers a different question. The following table summarises the three Super Filter views:
View | What it shows | Best used for |
List | Pair, 24h change, turnover and the matched condition, sortable | Ranking hits by momentum or liquidity |
K-Line (candlestick grid) | Several pairs' candlestick charts tiled on one screen, with OHLC on hover | Comparing trend structure across hits at a glance |
Heatmap | Hits as tiles sized and coloured by volume or turnover | Seeing where activity is concentrated |
In every mode, clicking a pair switches the main chart to that pair without leaving the page and without placing an order.
Candlestick Array Mode: Comparing Multi-Asset Trend Lines Side-by-Side
K-Line mode is the view most traders will live in after a scan. Instead of reading a list of tickers, you see the candidates' charts tiled together and can tell within seconds which ones share the structure you are looking for, which one is leading and which is lagging. Hovering a candle shows its open, high, low and close. For a trader running a "strongest pair in a sector" strategy, this is the step that used to require opening each result in its own tab.
Heatmap and Volume View: Spotting Turnover Concentration
Heatmap mode replaces the chart with a block view ranked by volume or turnover. Its job is to show where the market's activity is concentrated among your filtered pairs, which is useful for two reasons: it points to the pairs with enough liquidity to trade at size, and it exposes when a scan has returned mostly thin, newly listed contracts that look good on a pattern filter but will slip on execution.
Pair the heatmap with the 24h Turnover Rank filter (Top 10%, 30%, 50% or 80%) to keep scans inside tradeable liquidity.
List View: Rapid Sorting by 24h Momentum and Turnover
List mode is the fastest way to rank. Each row carries 24h change, turnover and which condition the pair matched, and the columns sort. It suits a momentum workflow: run a scan for pairs in the top 10% of gainers with RSI below a threshold, sort by turnover, and work down from the most liquid.
From the list, pairs you want to keep can be added to Favorites, which appear in the Ultra right-hand toolbar for the rest of the session.
Deep Dive: Scanning Hundreds of Markets with Super Filter
Super Filter opens from the bottom of the PC Ultra chart page and screens the entire Bitunix perpetual futures market against conditions you combine in one group. It is the component that turns a multi-chart layout from a monitoring tool into a discovery tool. Results are a snapshot at the moment you run the scan, so the habit is to re-run as the market moves, not to treat the list as live.
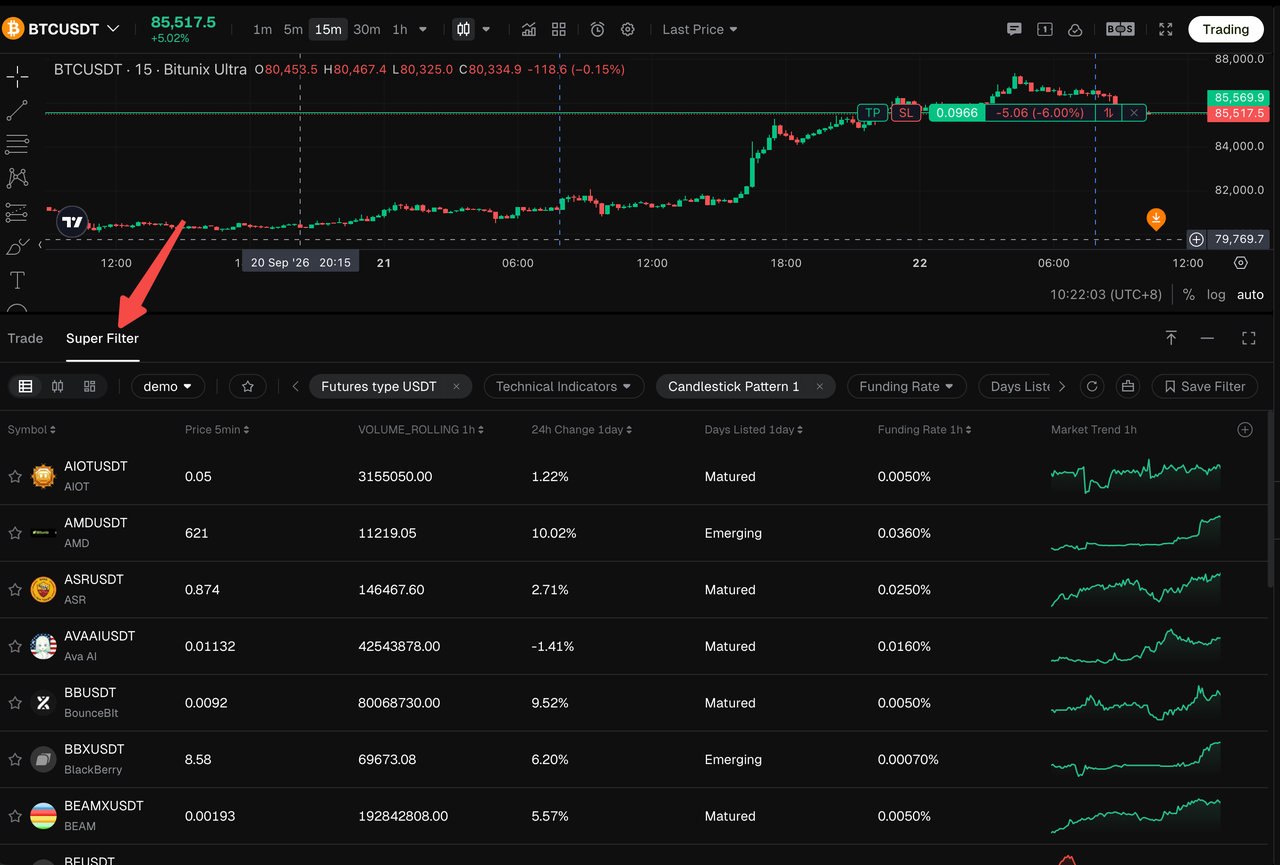
Access the Super Filter tab in Bitunix PC Ultra to screen multiple crypto pairs and candlestick patterns without paid subscription plans.
Multi-Condition Technical Filtering: MA, RSI, MACD, and Volume
The filter dimensions available as of the September 2026 guide are listed below. Options may vary by web version:
Dimension | Options |
Futures type | USDT, USD, USDC perpetuals |
Technical indicators
| EMA and MA at 5, 9, 20, 50, 100 and 200 periods; RSI; MACD; ADX; DMI; TRIX |
Candlestick patterns | 19 built-in patterns (see next section) |
Funding rate | Positive (longs pay) or negative (shorts pay) |
Days listed | New (<7 days), Recent (7–30), Emerging (30–80), Matured (>180) |
24h change | Six bands from ≤ −20% to ≥ +20% |
24h change rank | Top 10% / 10–30% gainers; top 10% / 10–30% losers |
24h turnover rank | Top 10%, 30%, 50%, 80% |
You can stack multiple triggers into a single query: USDT perps, an EMA 20/50 cross, MACD confirmation, and top 30% volume all at once.
It also tracks the data generic stock tools ignore—funding rates and token age. With one click, you can filter out volatile pairs listed less than a week ago or isolate coins with extreme funding, without tab-hopping to external tracker sites to double-check.
Scanning for 19 Built-in Candlestick Patterns Across the Futures Market
You can stack 19 classic candlestick patterns—including Hammers, Engulfing bars, and Morning Stars—directly into your technical filters. Running a scan for a Morning Star strictly across the day's worst 10% performers takes a single click.
Two practical realities matter when using it:
A recognized pattern is just an alert to check the chart, never a standalone entry trigger without volume or level confirmation. And because the scanner sweeps the entire exchange, bare pattern scans will pull up illiquid micro-caps. Always add a 24-hour turnover filter to make sure the setups you find actually have enough order book depth to trade.
One-Click Chart Synchronization: Instantly Loading Filter Hits to the Main Grid
Clicking any result switches the main chart to that pair with your existing indicator template applied. It never places an order; execution is always a separate, deliberate action.
Condition groups can be saved under a name, so a "pattern scan" and an "indicator scan" are one click apart the next session, and any result can be added to Favorites for ongoing monitoring from the Ultra toolbar. That is the full discover-confirm-monitor loop without a second application, and it is available to every account at no cost.
Workflow Efficiency: Bridging Multi-Chart Discovery with Direct Chart Execution
The gain from an exchange-native terminal is measured in the steps removed between seeing a setup and having a position with a stop on the chart. On a split stack (charting site plus exchange tab) that path has four or five context switches. On PC Ultra it has none.
Eliminating Context Switching Between Screeners and Order Slips
Scanning and execution happen in a single, closed loop without ever switching tabs.
Run a saved screener preset, pick a ticker off the grid to load it on the primary chart, and hit Space to throw the order ticket over the screen. The terminal plots your entry preview and position size directly across the candles before you even click buy or sell.
Fire the order, tap Space to hide the UI, and drag your TP and SL levels directly along the price action. To stop fast clicks from turning into reckless exposure, Fixed Risk mode calculates your contract size strictly from your chosen dollar loss rather than a rough notional value.
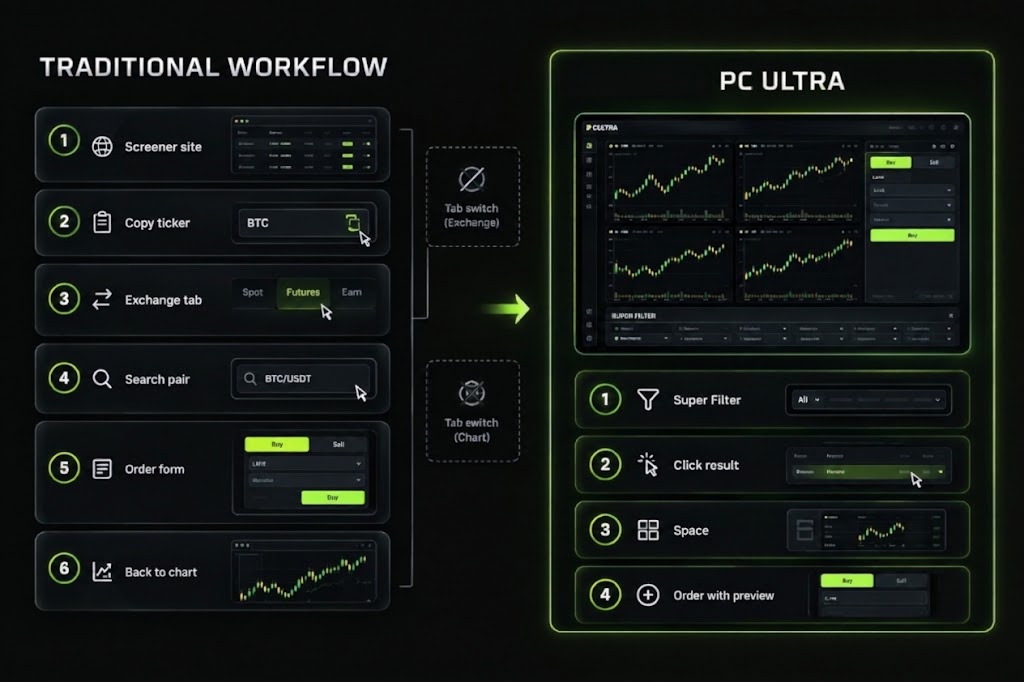
Execution path on a split charting-plus-exchange stack versus a single Bitunix PC Ultra page.
Visualizing Active Positions and Orders Across Pinned Multi-Chart Tabs
Because the terminal holds your account, every chart window can display the position line, pending orders and TP/SL levels for that pair. In a multi-screen layout, that means a trader with positions on four pairs sees four charts, each with its own risk levels drawn, and can adjust any of them in place. Super Alert, the platform's alert engine, adds indicator, drawing, pattern and price alerts delivered to the app, Telegram or Discord, which covers the pairs that are in Favorites but not currently on screen.
None of this changes the risk of the trade itself. Leverage, liquidation and funding costs apply the same way on any layout, and a faster path to execution is only an advantage if the decision behind it was sound.
Other TradingView Alternatives for Crypto Traders
That covers the main draw of PC Ultra: packing charting, custom scans, and direct execution into a single screen eliminates the friction and tab-switching latency entirely.
In live trading, no single terminal fits every style. Looking across the market, several specialized tools remain staples on active trading desks—like GoCharting and Bookmap for order flow and market microstructure, CoinGlass for aggregated derivatives telemetry, Coinigy for managing accounts across multiple venues, and DEX Screener for tracking on-chain liquidity at the source.
Here is a breakdown of those core alternatives, where their real strengths lie, and the exact workflows they are built for.
GoCharting: Advanced Charting and Order Flow Analysis
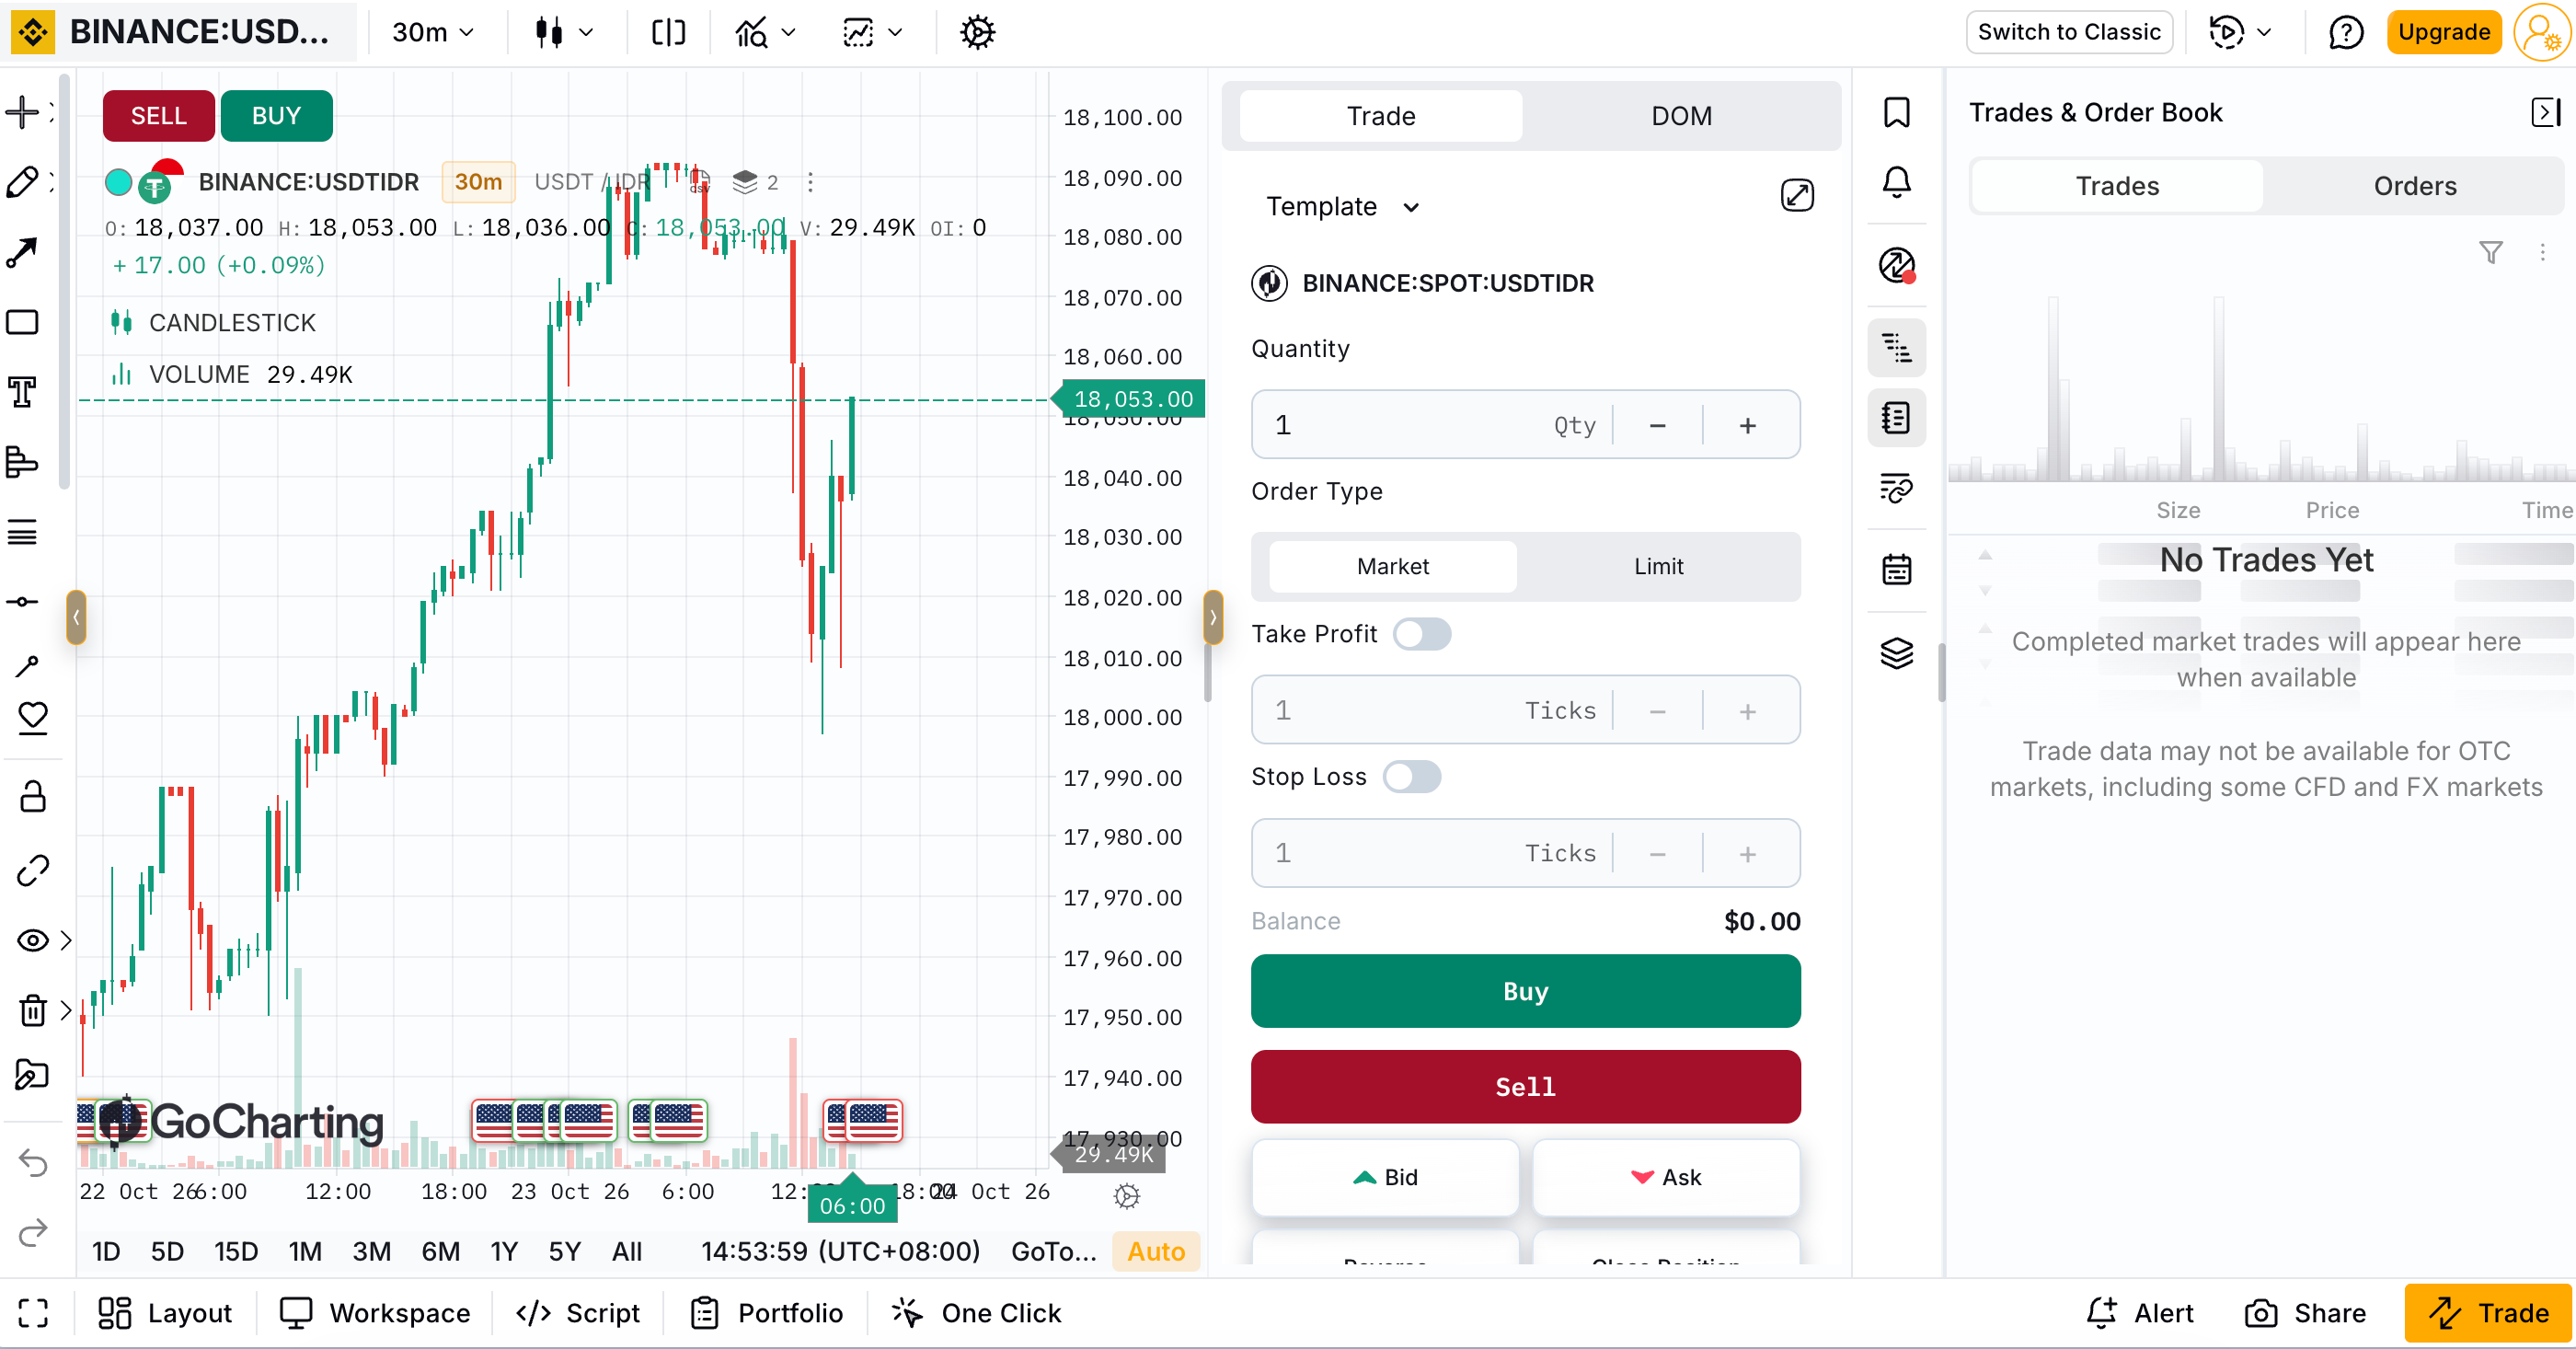
GoCharting trading interface featuring technical candlestick charts, trade execution panel, and order book depth tools.
GoCharting positions itself as a lightweight order flow platform that operates entirely in the browser, bypassing the setup required by legacy desktop terminals. Unlike standard charting tools that only record price bars, it integrates traditional indicators with Footprint Charts, Volume Profile, and Cumulative Volume Delta (CVD), allowing traders to inspect tick-level transaction density and bid-ask imbalances at specific price levels.
The platform involves distinct architectural and operational trade-offs:
Resource Overhead: While the web-based build eliminates local software installations, rendering high-frequency footprint data inside a browser puts a heavy load on local memory, particularly during high-volatility sessions or multi-window layouts.
Feature Gating: The free tier is limited to standard charting and baseline indicators. Real-time tick feeds, large-order tracking, and multi-chart workspaces are reserved for paid tiers.
Best for: Short-term and futures traders who require order flow and volume profile visualization, but prefer a browser-based interface over configuring dedicated desktop terminals or external data feeds.
Coinigy: Multi-Exchange Charting and Trading

Coinigy supported crypto exchange directory featuring Binance, Kraken, and Coinbase across spot, derivatives, and DeFi markets.
Coinigy is not a standard charting tool. It is a multi-exchange console. It pulls data from Binance, Coinbase, and Kraken into a single screen. The objective is simple: eliminate the friction of fragmented accounts.
Traders skip toggling between separate logins. From one window, you can track spot spreads between US venues and global order books, while keeping an eye on aggregate balance exposure.
The trade-offs are concrete:
Routing latency is real. Orders move through API relays and cloud servers. That rules out fast scalping. It works for manual adjustments, nothing faster.
API limits strip features. Exchanges open different levels of API access. Complex perpetual and conditional orders often do not carry over.
Cost depends on your setup. The platform carries a monthly subscription. If you only trade on one venue, paying that extra fee makes zero sense.
Best for: Crypto traders holding funds across multiple venues who need a single cockpit to monitor regional spreads and rebalance manual positions.
Bookmap: Visualizing Market Depth and Liquidity
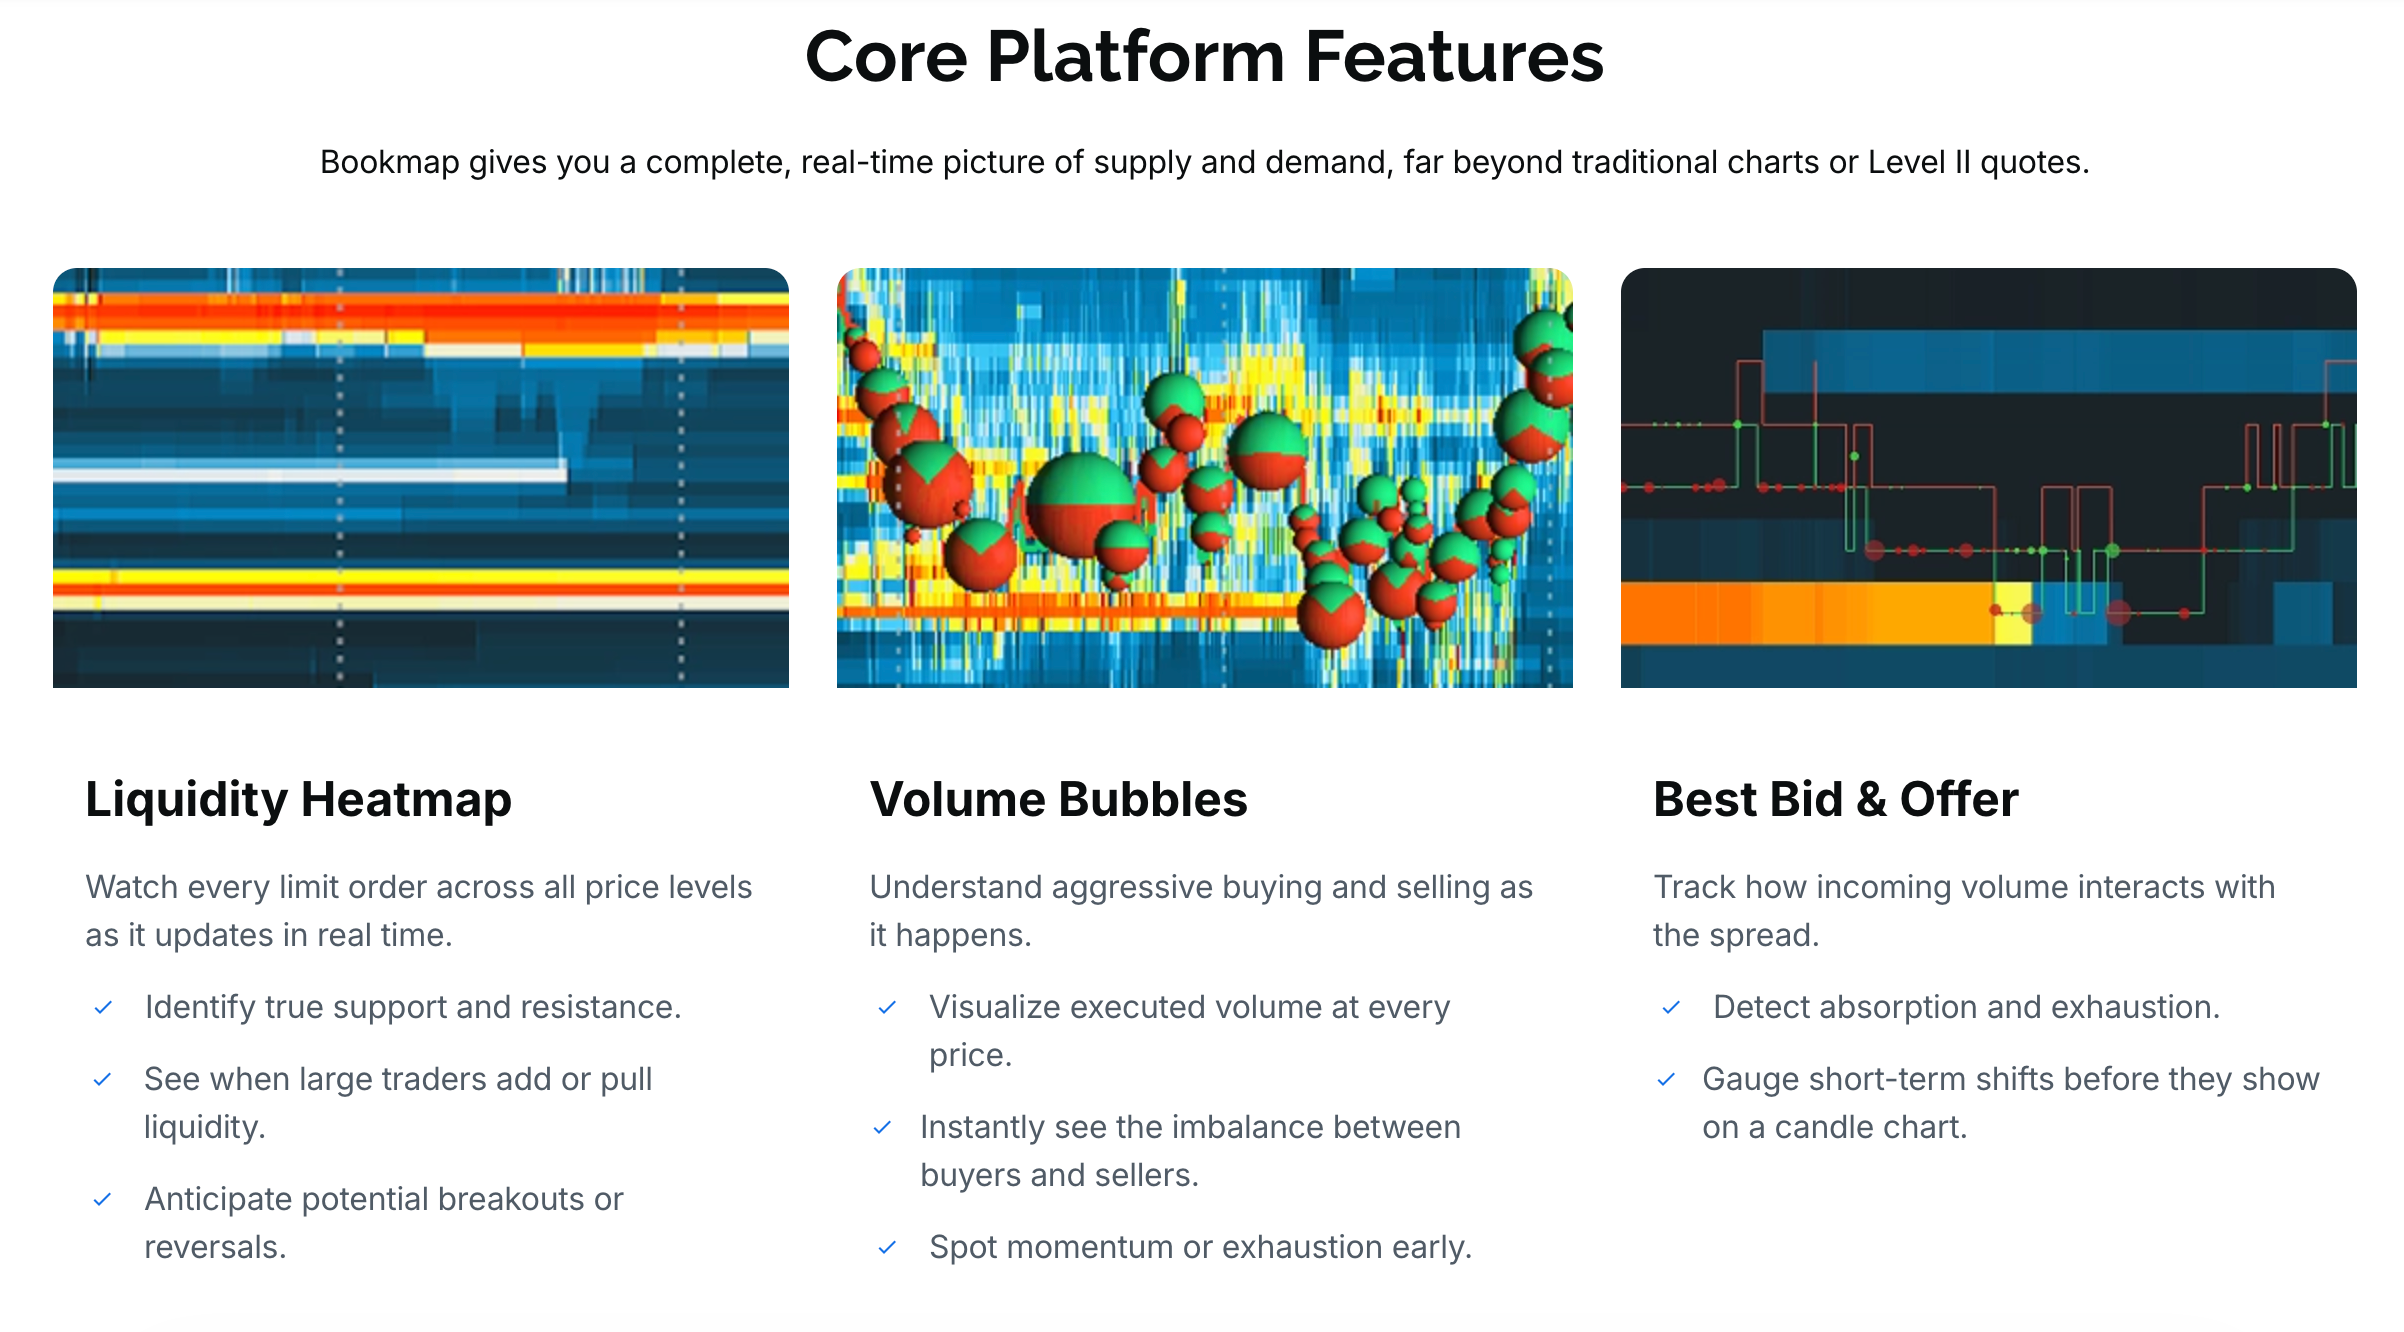
Bookmap core features: Liquidity Heatmap, Volume Bubbles, and Best Bid & Offer for tracking real-time order flow and market depth.
Bookmap bypasses conventional multi-chart setups to focus entirely on market microstructure. Its defining feature is the liquidity heatmap. The platform maps resting limit orders across historical price bars as color-graded bands, pairing them with executed volume bubbles to reveal passive order accumulation and aggressive absorption in real time.
In live execution, several structural realities apply:
Resting liquidity is not guaranteed direction. Limit orders displayed on the heatmap can be modified or pulled in milliseconds. Spoofing is common. Visible liquidity walls should not be treated as standalone price signals.
Local processing and bandwidth demands are heavy. Bookmap runs as a dedicated desktop client. Streaming uncompressed Level 2 order book data from overseas exchange feeds places continuous load on local RAM, CPU, and network stability.
The free tier is limited to one symbol. The entry-level Digital package includes real-time crypto feeds, but restricts workspace views to a single trading pair. Multi-instrument monitoring and footprint tools require paid tiers.
Best for: Crypto scalpers and intraday traders who build strategies around order-book depth (DOM) and tick-level volume, rather than static candlestick grids.
CoinGlass: Crypto Derivatives Data and Market Analysis
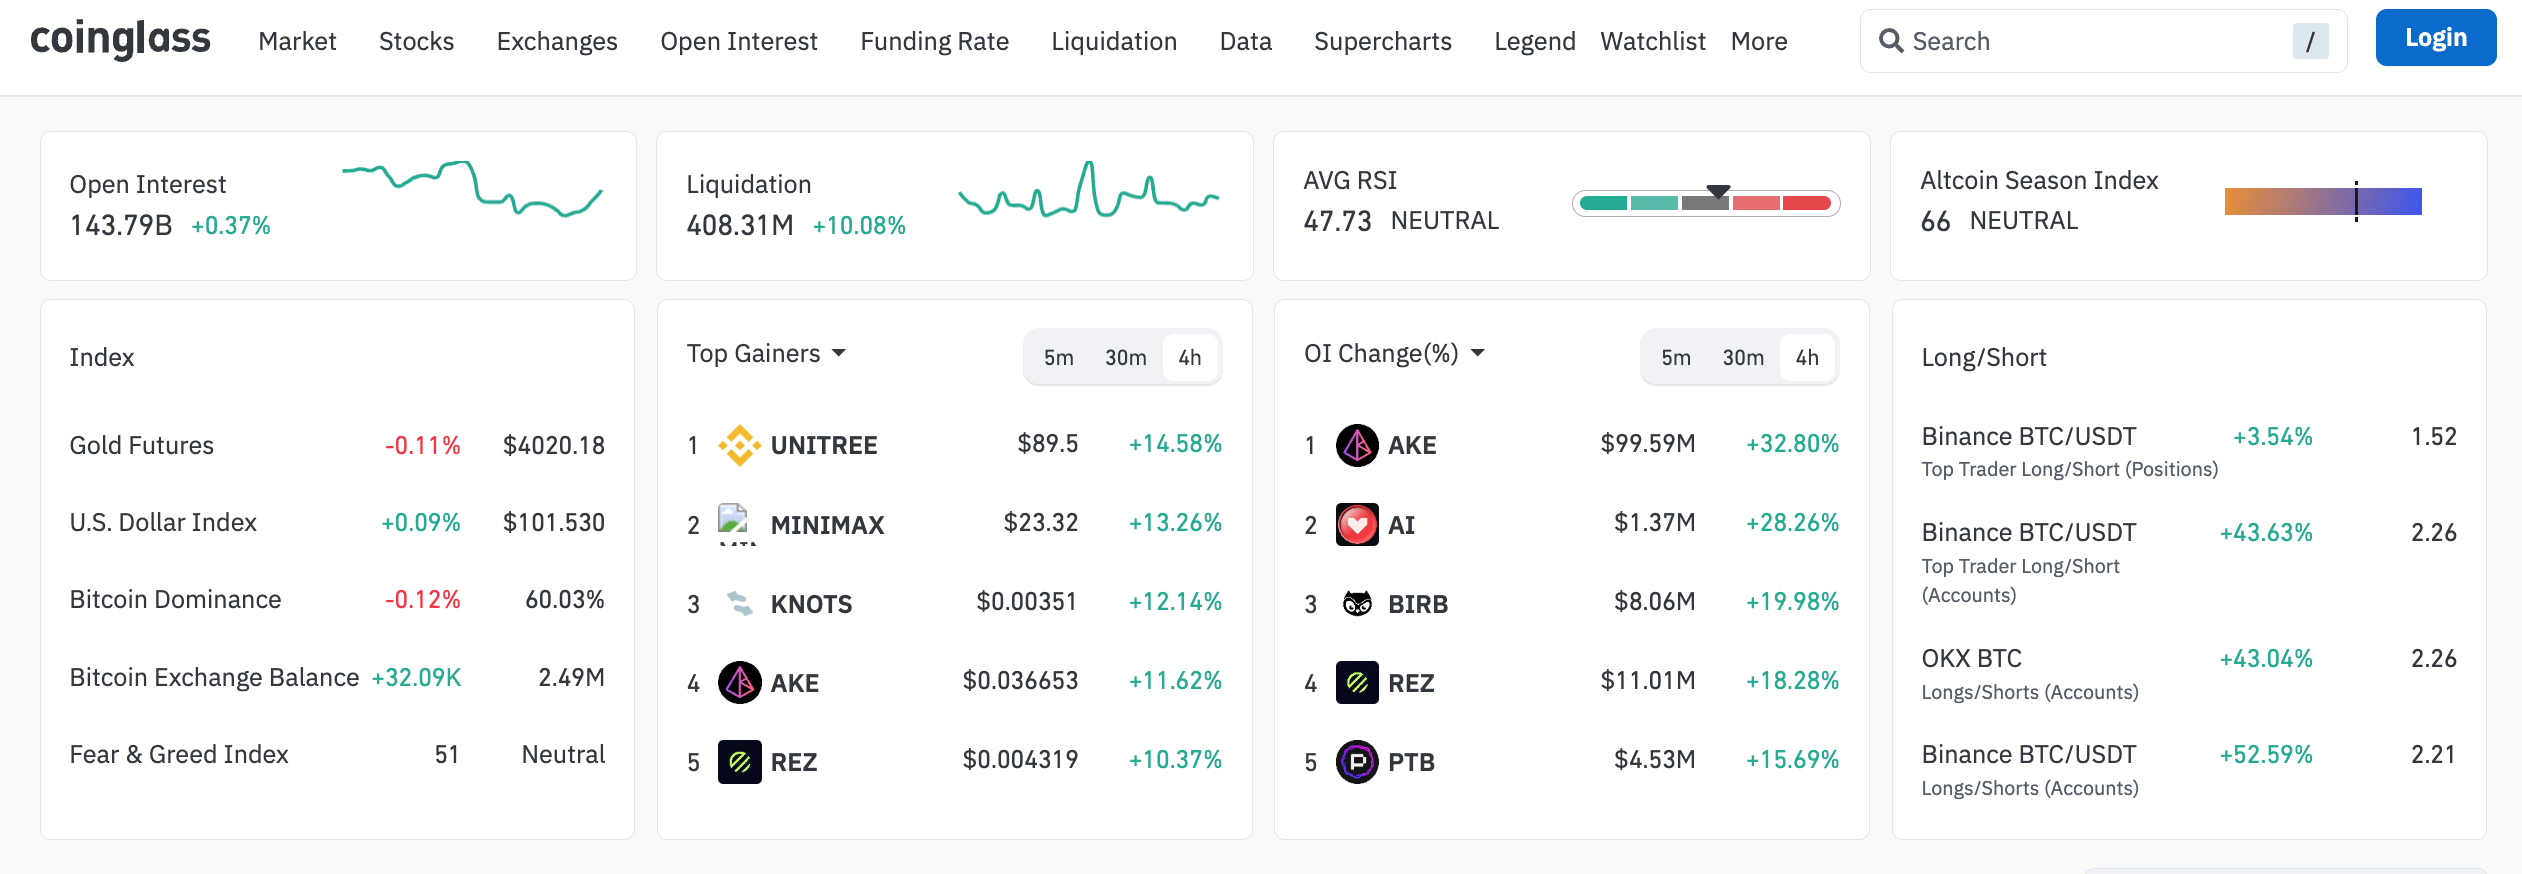
CoinGlass dashboard displaying crypto derivatives metrics including open interest, liquidations, and long/short ratios.
CoinGlass is not built to replace standard charting tools like TradingView. It operates as a telemetry dashboard for crypto derivatives. Its primary utility is aggregating futures market indicators from disparate venues into a unified feed, revealing the leverage dynamics that standard price bars hide.
The platform provides macro context for sharp price action:
Contextualizing price moves with leverage. It consolidates open interest (OI), funding rates, and liquidation heatmaps. A rally alongside climbing OI confirms aggressive new positioning. A rally with collapsing OI points to a short squeeze driven by forced liquidations.
Aggregating global contract depth. By pooling data across major offshore exchanges (such as Binance and Bybit) alongside institutional options hubs (such as Deribit), it allows traders to spot cross-venue funding skews and positioning imbalances at a glance.
Its operational boundaries are straightforward:
Leverage metrics are not directional signals. Liquidation clusters highlight where stop losses and margin calls pool, not when price will sweep them. Extended trends can keep funding rates heavily pinned for days.
Analytics only, no execution. The platform is strictly an analytical layer. It has no order-routing engine, meaning traders still need a separate terminal or exchange interface to execute.
Best for: Crypto derivatives traders who pair technical charts with aggregated open interest, funding rates, and liquidation heatmaps to track squeeze risks and crowded leverage.
DEX Screener: Real-Time Charts for Decentralized Markets

DEX Screener trending tokens table showing real-time on-chain DEX pair prices, 24h volume, liquidity, and transaction counts.
DEX Screener acts as a front-line discovery radar for on-chain liquidity. It bypasses centralized exchange listing queues entirely, tracking raw trading pairs across chains like Solana, Ethereum, and Base. Alongside price action, it displays pool reserves, live swap feeds, and basic contract security metrics.
Trading decentralized pools involves structural rules that differ from traditional order books:
Pool reserves outweigh chart patterns. Prices are set by Automated Market Maker (AMM) reserve ratios. A single token often trades at different valuations across separate pools. In thin pools, minor volume paints false breakouts, and exit slippage destroys trade profitability.
Permissionless global access with node latency. Decentralized contracts bypass the regional KYC and IP blocks common on centralized exchanges. Anyone with a Web3 wallet can connect. However, data updates depend on local RPC nodes and blockchain congestion, lacking the sub-millisecond reliability of centralized matching engines.
Discovery tool, not a futures terminal. The core edge is catching micro-caps before centralized venues list them. The platform does not offer perpetual margin execution, and early pools carry relentless exposure to honeypots and rug pulls.
Best for: Crypto traders hunting early on-chain launches who track cross-chain pool reserves and decentralized volume before assets ever reach centralized order books.
Is Bitunix PC Ultra the Best Free Alternative to TradingView for Crypto Traders?
The search for TradingView alternatives for crypto usually starts with price and ends with workflow. The free charting tiers cap exactly the feature a multi-pair day trader needs most, the multi-chart layout, and even the paid tiers leave the chart disconnected from the order. An exchange-native terminal closes that gap.
Unlike standalone charting platforms such as GoCharting and Bookmap, PC Ultra brings market screening, multi-chart monitoring, and futures order entry into a single exchange interface. It is best suited to traders who prioritize crypto market discovery and execution efficiency over custom scripting or cross-asset charting.
Bitunix PC Ultra gives every account multi-screen layouts of up to 16 windows, a market-wide screener with 19 candlestick patterns and crypto-specific filters, three result views, and order entry on the same page, at no subscription cost. Whether it replaces TradingView for you depends on one question: do you need Pine Script and cross-asset charts, or do you need to see more crypto pairs and act on them faster?