Grid, arbitrage, and day trading bots automate different parts of crypto trading. Grid trading bots place orders within a defined price range, arbitrage bots seek to capture price discrepancies across markets, and day trading bots execute short-term strategies based on predefined rules.
If you prefer to follow another trader rather than configure a strategy yourself, Bitunix Copy Trading offers a different approach: eligible trades from a selected lead trader are replicated according to your settings. Understanding these differences can help you choose a method that fits your trading experience, market outlook, and risk tolerance.
How Do Grid, Arbitrage, and Day Trading Bots Differ?
Although all three approaches can automate trading decisions, they use different mechanisms and respond to different market conditions.
Grid Trading Bots: Trading Within a Price Range
A grid trading bot divides a selected price range into multiple levels and places orders according to a predefined grid. Depending on the strategy and configuration, it can buy at lower levels and sell at higher ones as the price moves back and forth.
The approach is designed to capture repeated price fluctuations rather than predict every market move. It may suit a market that trades within a relatively stable range, but it becomes more challenging when the price breaks beyond the configured boundaries and continues in one direction.
Grid trading can be configured for spot or derivatives markets, depending on the platform and bot. These implementations have different risk profiles: a spot grid can accumulate an asset as prices fall, while a leveraged futures grid may also face liquidation risk.
Arbitrage Bots: Exploiting Price Differences
An arbitrage bot looks for price discrepancies between markets or related instruments. It attempts to buy at a lower effective price and sell at a higher one, accounting for the costs and risks of executing both sides.
Common approaches include:
Cross-exchange arbitrage: Buying an asset on one exchange and selling it on another where the effective selling price is higher.
Triangular arbitrage: Trading through three currency pairs on the same exchange to exploit a pricing discrepancy between the pairs.
Funding-rate arbitrage: Combining positions in spot and perpetual futures, or in related derivatives, to seek returns from funding payments while managing directional exposure.
Arbitrage opportunities can be brief. Trading fees, withdrawal costs, slippage, insufficient order-book depth, and execution delays may turn an apparent price difference into a loss. Funding-rate strategies also carry basis, funding, and position-management risks.
Day Trading Bots: Automating Short-Term Entries and Exits
Day trading bots execute short-term strategies according to rules based on indicators, price action, market structure, or other signals. A strategy might use moving averages to identify a trend, RSI to assess momentum, or a breakout rule to trigger an entry.
Unlike a grid bot, which follows a price-level structure, a day trading bot typically depends on conditions that determine when to open and close positions.
The bot's effectiveness depends on the quality of those rules, the timeframe, execution speed, and trading costs. A strategy that performs well in a strong trend may generate repeated false signals in a sideways market. Frequent trading can also make fees and slippage a significant part of the overall result.
Which Strategy Fits Different Market Conditions?
Factor | Grid Trading | Arbitrage | Day Trading |
Main objective | Capture price fluctuations within a range | Capture pricing discrepancies | Execute short-term market strategies |
Potentially suitable conditions | Sideways or ranging markets | Markets with executable price discrepancies | Markets that meet the strategy's entry criteria |
Main configuration inputs | Price range, grid count, spacing, capital | Markets or pairs, execution rules, cost thresholds | Entry signals, exits, position size, risk limits |
Key costs | Trading fees and slippage | Trading fees, slippage, funding, and possible transfer costs | Trading fees, spread, and slippage |
Main risks | Breakouts, inventory imbalance, poor range selection | Execution failure, disappearing spreads, incomplete hedges | False signals, overtrading, and rapid price moves |
No strategy is consistently effective in every market environment. Choose based on the behavior you want to trade and the risks you can manage, rather than assuming one bot type is inherently more profitable than another.
How Do Grid Trading Bots Work?
A grid bot starts with an upper price boundary and a lower price boundary. It then divides that range into price levels and places orders according to its configured rules.
For example, a bot configured for BTC/USDT might operate between $58,000 and $62,000. If the range is divided into 10 equal intervals, the distance between adjacent levels is $400. The bot uses those levels to organize its orders as the market moves through the range.
This is a hypothetical configuration example, not a current BTC price forecast or a trading recommendation. Actual order placement depends on the bot's implementation, order requirements, available capital, and market conditions.
Arithmetic vs. Geometric Grid Spacing
Two common ways to distribute grid levels are arithmetic and geometric spacing.
Arithmetic spacing uses a fixed price difference between adjacent levels. If the range is $58,000–$62,000 with 10 equal intervals, each interval is $400.
Geometric spacing uses a fixed percentage difference between adjacent levels. The absolute price difference increases at higher price levels and decreases at lower ones.
Setting | Arithmetic Grid | Geometric Grid |
Spacing rule | Fixed price difference | Fixed percentage difference |
Example | Every $400 | Approximately the same percentage between levels |
Main consideration | Equal dollar intervals | Equal proportional intervals |
Useful question | Do fixed price steps fit the range? | Does percentage-based spacing better fit the intended market behavior? |
The choice depends on the asset, price range, and strategy. Neither method guarantees better results, and some bots may offer only one spacing method.
Grid Profit vs. Unrealized Profit and Loss
A grid bot may complete profitable buy-sell cycles while the total account position remains at a loss.
For example, a completed cycle might sell an asset above its purchase price, generating a realized trading gain before costs. However, if the market subsequently falls and the bot holds a larger quantity of the asset, the unrealized loss on that inventory may exceed the realized gains.
To evaluate performance, distinguish between:
Realized profit and loss: Gains or losses from closed trades.
Unrealized profit and loss: The current mark-to-market result on open positions or holdings.
Trading costs: Fees, spread, slippage, and any applicable funding payments.
Net result: The overall outcome after accounting for realized and unrealized P&L and relevant costs.
A dashboard showing completed grid profits does not necessarily represent the strategy's total return.
How to Configure a Grid Trading Bot Step by Step
Grid settings determine where orders are placed, how frequently the bot may trade, and how much capital is exposed to market movements. Before activating a bot, understand each parameter and how the settings work together.
The exact fields and available controls vary by platform and bot type. The following is a general configuration framework, not a claim about a specific Bitunix bot interface.
Step 1: Choose the Trading Pair and Market
Select an asset pair with sufficient liquidity for the intended strategy. Major pairs may offer deeper order books, although liquidity and spreads still vary with market conditions.
Before choosing a pair, review:
Trading volume and order-book depth.
Bid-ask spread and expected slippage.
Recent volatility and typical price ranges.
Whether the bot operates in spot or derivatives markets.
Minimum order sizes and applicable trading fees.
Spot and futures grids should not be treated as interchangeable. A spot grid can accumulate or sell an asset, while a futures grid may involve leverage, margin requirements, funding payments, and liquidation risk.
Step 2: Set the Upper and Lower Price Limits
The lower boundary defines the bottom of the configured range, while the upper boundary defines its top.
A range that is too narrow may cause the market to move outside it frequently. A range that is too wide may spread capital across levels that are rarely reached, depending on the grid design.
Use historical price action and volatility to assess whether the range is reasonable, but do not assume past support and resistance levels will hold. The market can break beyond either boundary.
Before confirming, ask:
Does the range reflect the market conditions the strategy is designed for?
What happens if the price moves below the lower limit?
What happens if the price moves above the upper limit?
Will the bot stop placing orders, hold existing positions, or follow another rule outside the range?
These behaviors depend on the specific bot and should be checked in its documentation.
Step 3: Choose the Number of Grids and Spacing
Grid count determines how many intervals divide the selected price range. More intervals create smaller price gaps between levels; fewer intervals create larger gaps.
For an arithmetic grid, the approximate interval is:
Grid interval = (Upper price − Lower price) ÷ Number of intervals
For example, a hypothetical BTC/USDT range of $58,000–$62,000 divided into 10 equal intervals produces a $400 price difference per interval.
This calculation describes the spacing between levels, not the profit from each completed trade. Actual results depend on order size, execution prices, fees, slippage, and whether the required buy and sell orders are filled.
Before selecting a grid count, consider whether the price difference between levels is large enough to cover trading costs and leave a meaningful margin. A dense grid can generate more trades, but additional transactions also create more opportunities for fees and slippage to erode results.
Step 4: Set the Investment Amount
The investment amount determines how much capital is allocated to the strategy. It should be based on your risk tolerance and the bot's capital requirements, not on an expected monthly return.
Check whether the bot reserves funds for multiple open orders, whether capital is distributed evenly across levels, and whether additional balance may be needed as the market moves.
For futures grids, also check margin requirements, leverage, liquidation rules, and how the platform handles insufficient margin. Avoid assuming that a bot will automatically reduce risk if the market moves sharply against its positions.
Step 5: Account for Trading Fees and Minimum Order Requirements
A grid can complete many transactions, so small costs may accumulate over time.
Before activation, estimate the combined effect of:
Maker and taker fees, depending on how orders execute.
Bid-ask spread and slippage.
Minimum order quantities and notional values.
Funding payments for applicable perpetual futures positions.
Any other platform-specific costs.
Compare the expected price difference between grid levels with the total costs of entering and exiting a trade. A price movement that looks profitable before costs may not remain profitable after execution.
Step 6: Define Exit and Risk Controls
A grid configuration should include a plan for what happens when market conditions change.
Depending on the bot's available settings, risk controls may include price alerts, stop-loss rules, take-profit conditions, a maximum allocation, or a rule for stopping the strategy when the price exits the range.
For leveraged futures, understand the liquidation mechanism before starting. A stop-loss order may not execute at its trigger price in a fast market, and it does not remove all execution risk.
Decide in advance:
When the bot should be paused or stopped.
How open orders and positions will be handled when it stops.
What loss level would prompt a review.
Whether you will exit, reduce exposure, or reassess the range after a breakout.
Do not assume that every bot supports all these controls. Verify the available settings and the behavior of existing orders and positions before relying on them.
Step 7: Review the Configuration and Monitor Performance
Before allocating meaningful capital, review the configuration and test it using available backtesting, paper trading, or other simulation tools where supported.
Evaluate the strategy across different market conditions, including sideways trading, strong trends, and sharp price moves. Include realistic fees and slippage assumptions wherever possible.
Once active, monitor more than the number of completed grid trades. Review total equity, open positions, realized and unrealized P&L, trading costs, and whether the price remains within the intended range.
A bot should be reassessed when market conditions change. Automation can execute predefined rules, but it does not determine whether those rules remain appropriate.
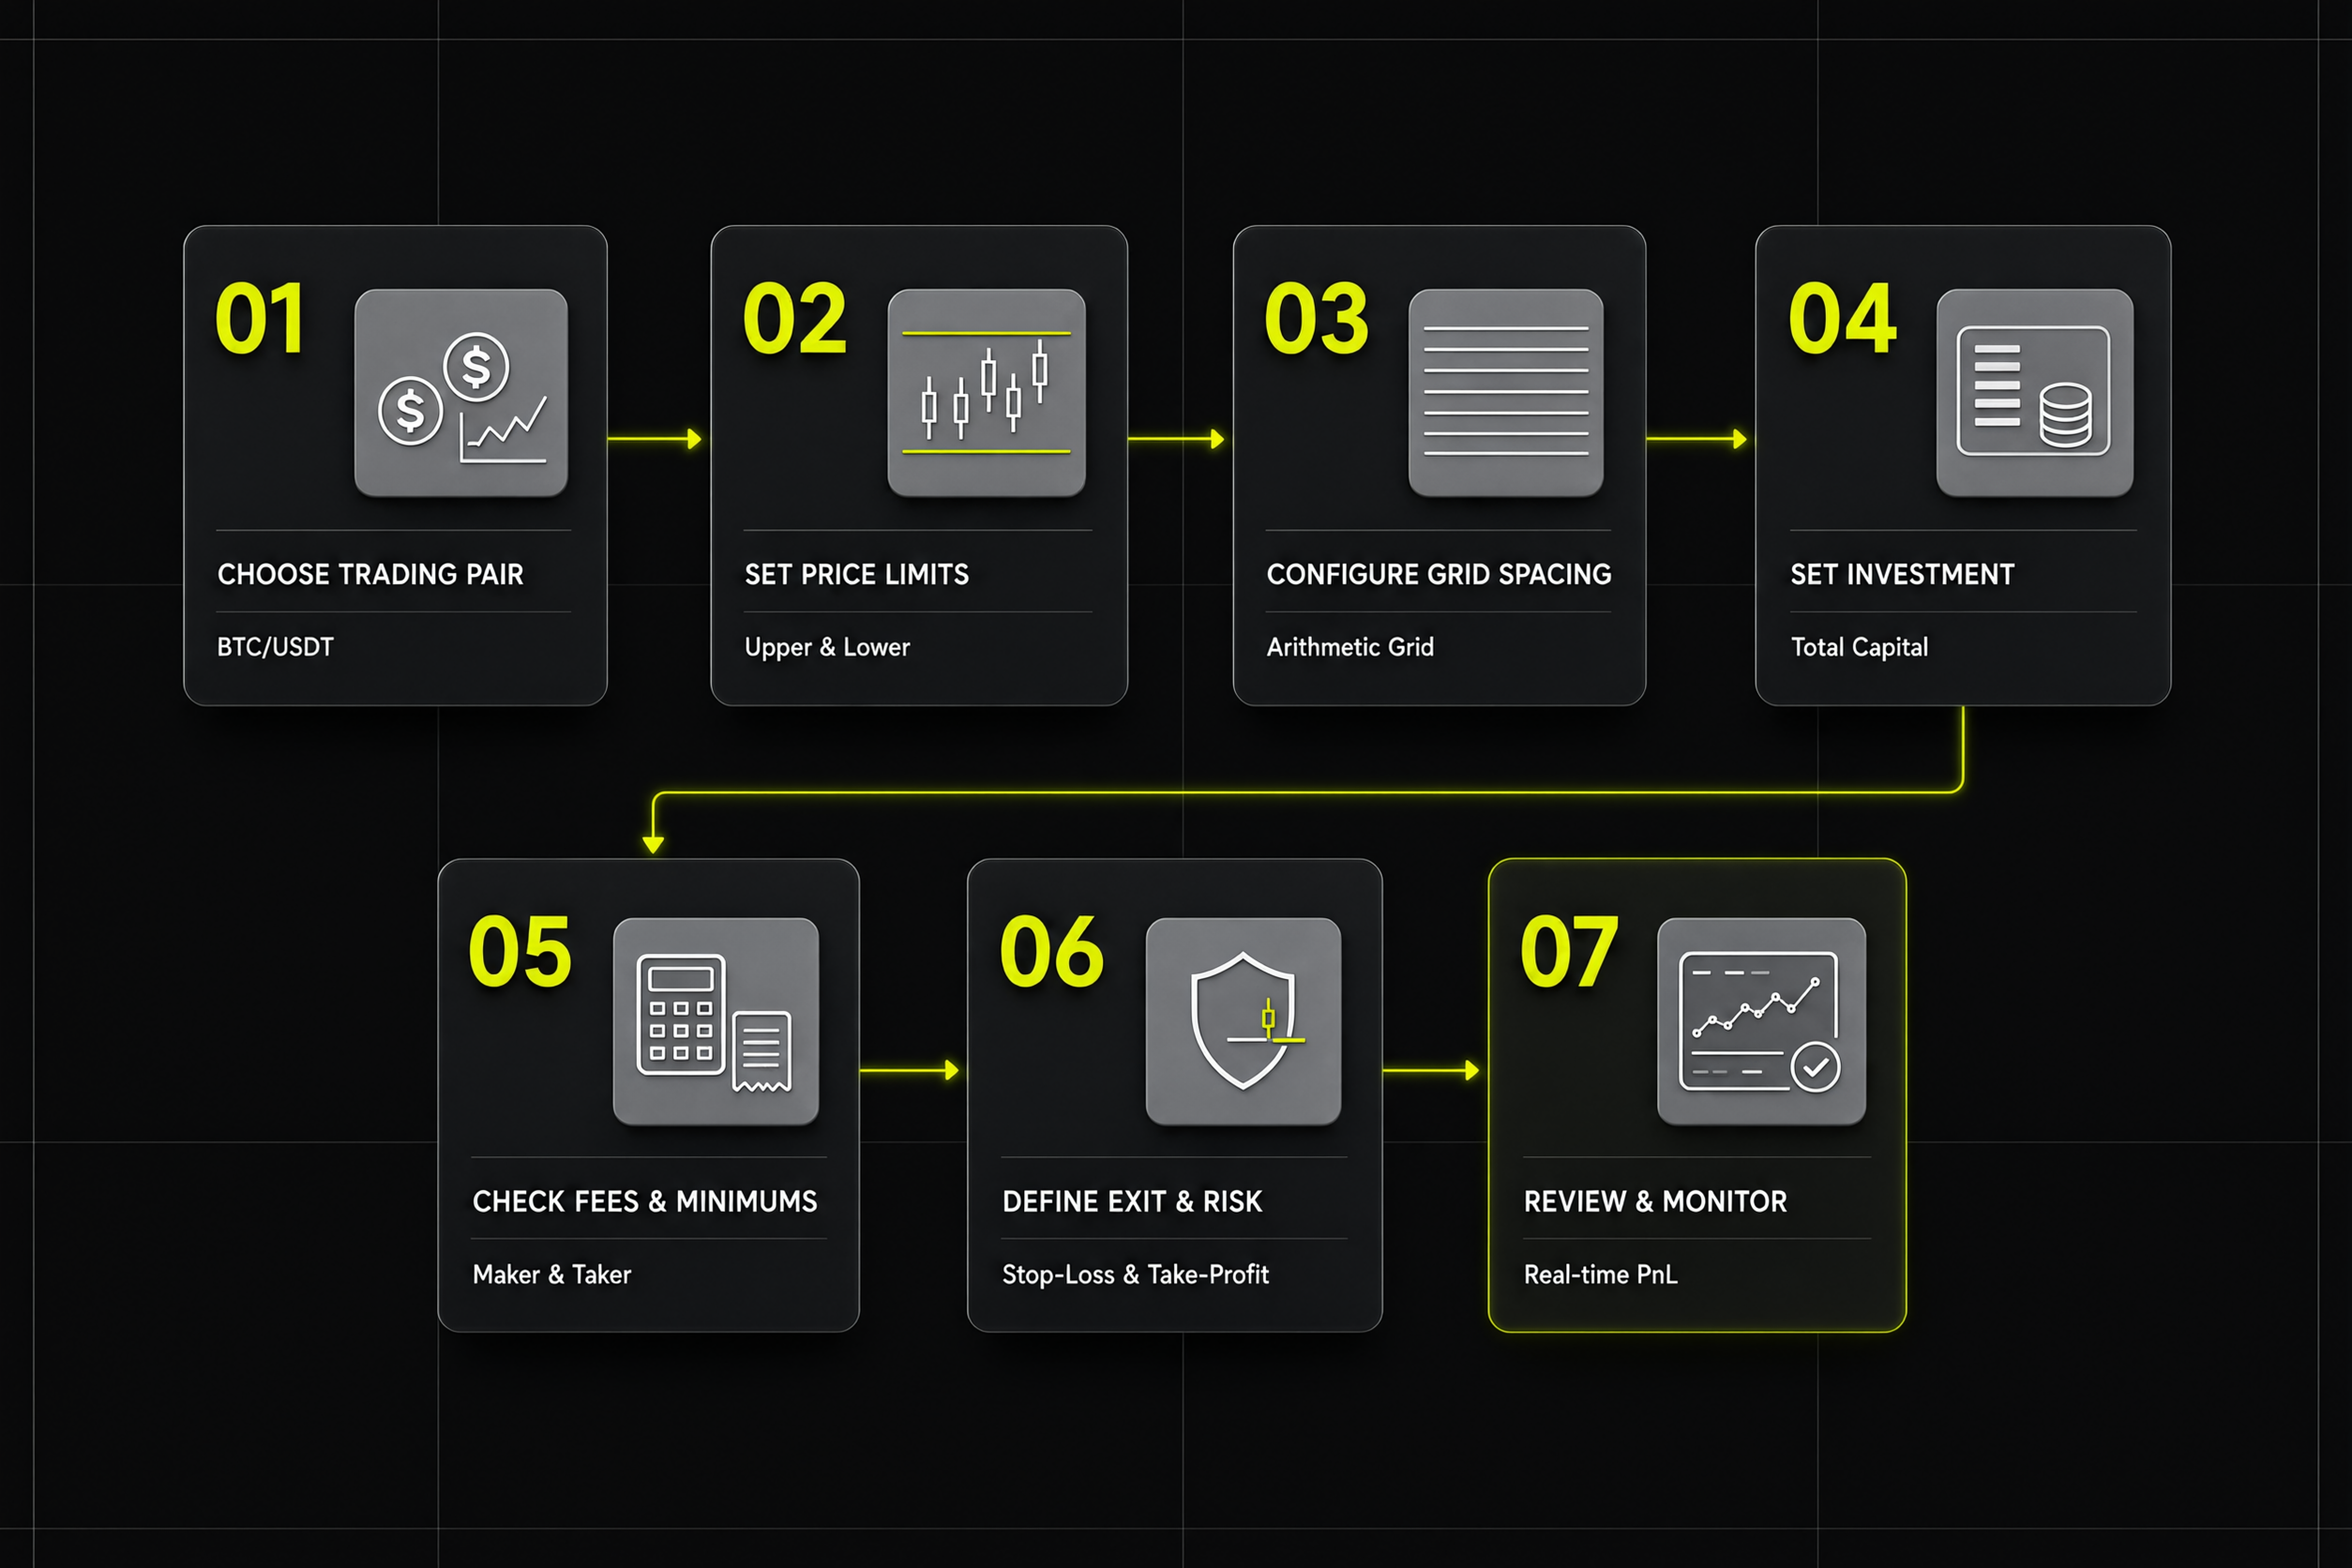
Seven steps to configure a crypto grid trading bot, from selecting a trading pair to reviewing settings and monitoring performance.
How Does Arbitrage Trading Work, and What Must You Configure?
Arbitrage strategies aim to capture pricing differences, but identifying a discrepancy is only the first step. The opportunity must remain available long enough to execute the required trades at prices that cover costs and risk.
Cross-Exchange Arbitrage
Cross-exchange arbitrage involves buying an asset on one exchange and selling it on another at a higher effective price.
For a practical assessment, compare the executable bid and ask prices rather than relying only on last-traded prices. Account for trading fees, available order-book depth, transfer costs where relevant, and the time needed to move assets or rebalance balances between venues.
Pre-positioning funds on both exchanges can reduce transfer delays, but it introduces other considerations, including capital allocation and counterparty exposure. Price differences may disappear before both sides execute.
Triangular Arbitrage
Triangular arbitrage uses three trading pairs to exploit a discrepancy in their implied exchange rates.
A simplified route might convert USDT to BTC, BTC to ETH, and ETH back to USDT. The strategy compares the final amount with the starting amount after accounting for each conversion.
The apparent opportunity must be calculated using executable prices and the fees for every leg. If one order is only partially filled or a price changes before the route completes, the final result may differ from the estimate.
Funding-Rate Arbitrage
Funding-rate strategies attempt to capture funding payments between traders holding opposing perpetual futures positions. Some approaches combine spot holdings with a futures position to reduce directional exposure.
However, a positive funding rate is not a guaranteed return. Funding can change, the spot-futures basis can move, and trading fees or margin requirements can affect the result. A hedge may also be imperfect if the two positions do not track each other closely.
Before using this approach, understand how funding is calculated and paid, how each leg is sized, and what happens if one position is liquidated or cannot be executed as planned.
How to Evaluate an Arbitrage Opportunity
Before executing an arbitrage strategy, check:
Executable prices: Use the prices available for the intended order size, not just the displayed last price.
Order-book depth: Determine whether both sides can be filled without excessive slippage.
Total costs: Include trading fees and any relevant funding, transfer, or conversion costs.
Execution risk: Consider partial fills, latency, price changes, and failed orders.
Position exposure: Understand whether an incomplete hedge could leave you exposed to directional price movements.
Arbitrage automation can help process pricing information and submit orders quickly, but execution speed alone does not make a strategy profitable.
What Are the Main Risks of Automated Trading Bots?
Automated trading does not remove market risk. It changes how trading decisions are executed, while leaving the strategy exposed to market conditions, costs, technical issues, and configuration errors.
Strong Trends and Breakouts Outside a Grid
Grid strategies are often designed around a defined range. If the market breaks out and continues trending, the bot may stop opening new orders at some levels or accumulate an unfavorable position, depending on its rules.
A range that worked in a quiet market may become unsuitable after a major news event or a shift in volatility. Reassess the strategy when the price repeatedly approaches or moves beyond its boundaries.
Fees, Slippage, and Poor Execution
A strategy's estimated edge can disappear when actual execution differs from assumptions. Market orders may experience slippage, limit orders may not fill, and repeated transactions can increase cumulative fees.
Backtests should include realistic cost assumptions, but even detailed historical tests cannot fully reproduce every live execution condition.
Leverage and Liquidation
Bots operating in derivatives markets may use leverage, increasing exposure relative to the margin allocated. Adverse price movements can trigger liquidation before a strategy has time to recover.
Understand the margin model, liquidation rules, funding payments, and behavior of open orders. Do not assume that automation will always close positions at the intended price.
Technical Failures and Configuration Errors
API outages, connection interruptions, stale market data, incorrect parameters, and failed order submissions can disrupt automated strategies. API permissions should be limited to what the bot needs, and withdrawal permissions should not be granted to a trading bot unless there is a specific, justified requirement.
Monitor order status and account exposure rather than assuming the system is operating correctly because it is switched on.
Backtesting Limitations
A strategy can look successful on historical data but perform poorly in live trading. Overfitting, unrealistic execution assumptions, and changes in market structure can all weaken results.
Test a strategy across multiple market conditions and avoid selecting parameters solely because they produce the best historical result. Paper trading or small-scale forward testing, where available, can help identify differences between simulated and live behavior.
For a broader framework covering entries, exits, position sizing, and risk controls, see the Bitunix Crypto Futures Trading System Guide.