Key Takeaways
Section | Summary |
Purpose | Combine indicators from different categories to raise signal quality. Two daily Bitunix USDT Perpetual cases apply confluence to entries, scaling, SL/TP, and leverage. |
Structure | Part 1 (BTC/ETH): wait for aligned signals. Part 2: channels, M-top, Fibonacci, S/R flips via 5 steps: trend → confluence → entry → SL/TP → leverage. |
One rule | No lone golden/death cross. ≥3 categories (trend, levels, momentum, volume) plus candle close. Confluence improves reliability, not profit certainty. |
HAEDAL (short) | Channel break → M-top/neckline break. Short rebounds at neckline/ex-support (now resistance) if candles are bearish and volume fades. SL above neckline; staged TP at prior lows; lower leverage. |
HYPE (long) | Hold 50% Fib and old channel support; weekly channel still up. MA120 hold + low-level bullish MACD. SL under support; staged TP at highs/channel top. |
Also / who | Indicator roles, four combo setups, 3-step SOP, risk rules, 10 FAQs. For traders who know candles, MACD, and MAs. |
Risk | Education only, not advice. Crypto/leveraged futures are high risk. Do your own research; follow local law and platform terms. |
1. Basic Definition: What Is a Multi-Indicator Confluence Trading Strategy?
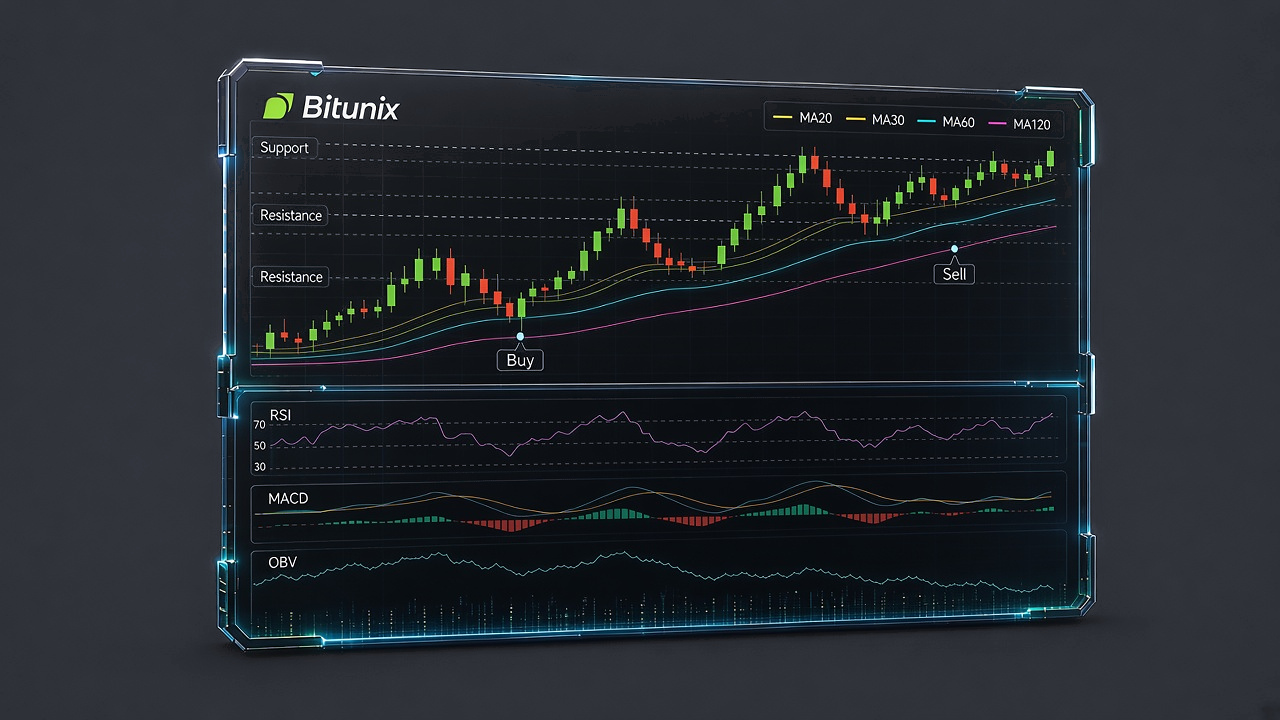
In a nutshell: Multi-indicator confluence occurs when different types of technical indicators generate signals in the same direction and reinforce one another. The goal is to improve signal reliability and reduce interference from false signals.
A Closer Look: A multi-indicator confluence strategy uses a unified decision-making framework, such as determining the overall market direction on a higher timeframe and identifying entry opportunities on a lower timeframe. A trade is considered only when at least three independent conditions across different dimensions, including trend, price levels, momentum, and volume, align in the same direction and are confirmed by a completed candlestick.
This approach aims to filter out false golden crosses, false breakouts, and misleading bullish or bearish signals caused by sudden price wicks.
2. Practical Trading Examples
Note: This example is for educational and illustrative purposes only and does not constitute investment advice. Cryptocurrency trading involves significant risks. Always apply appropriate risk management measures before trading.
1. HAEDAL/USDT Perpetual Futures (Daily Chart | Bearish Confluence Setup Combining an Ascending Channel Breakdown and an M-Top Pattern)
Breakdown Below the Daily Ascending Channel Signals the Start of a Bearish Trend
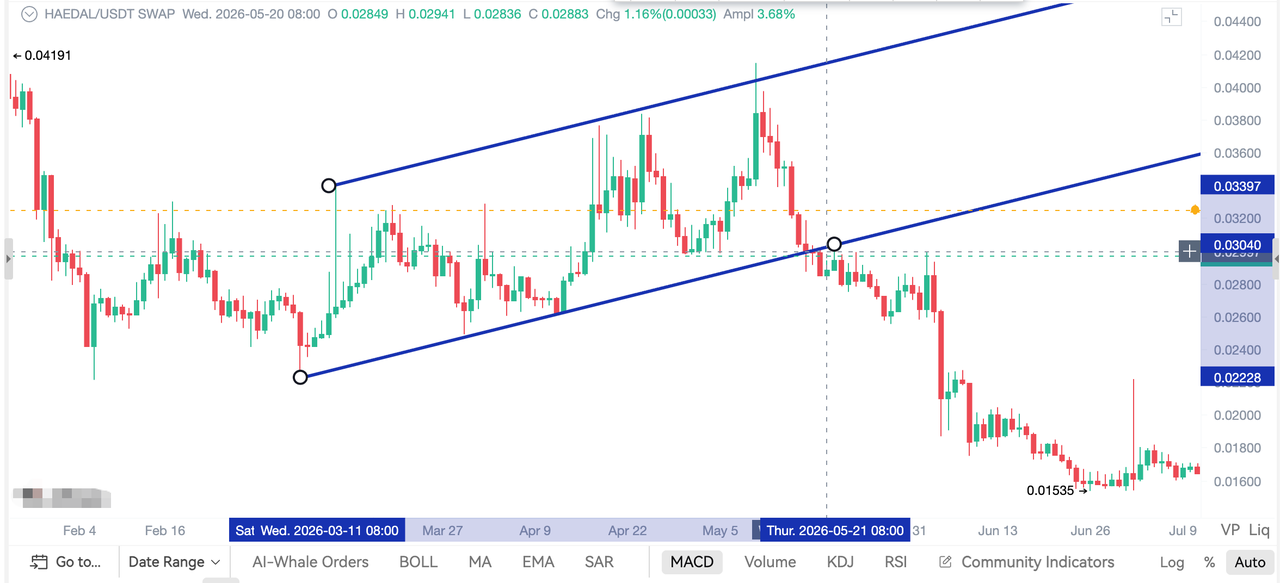
Figure 1: As shown in the chart, price initially traded within a wide ascending channel before breaking below its lower support boundary. This marked the beginning of a daily bearish cycle, with the overall trend shifting from bullish to bearish. From this point onward, traders should prioritize looking for short entry opportunities in the direction of the prevailing downtrend.
M-Top Pattern Breaks Below the Neckline, with the Rebound Facing Resistance
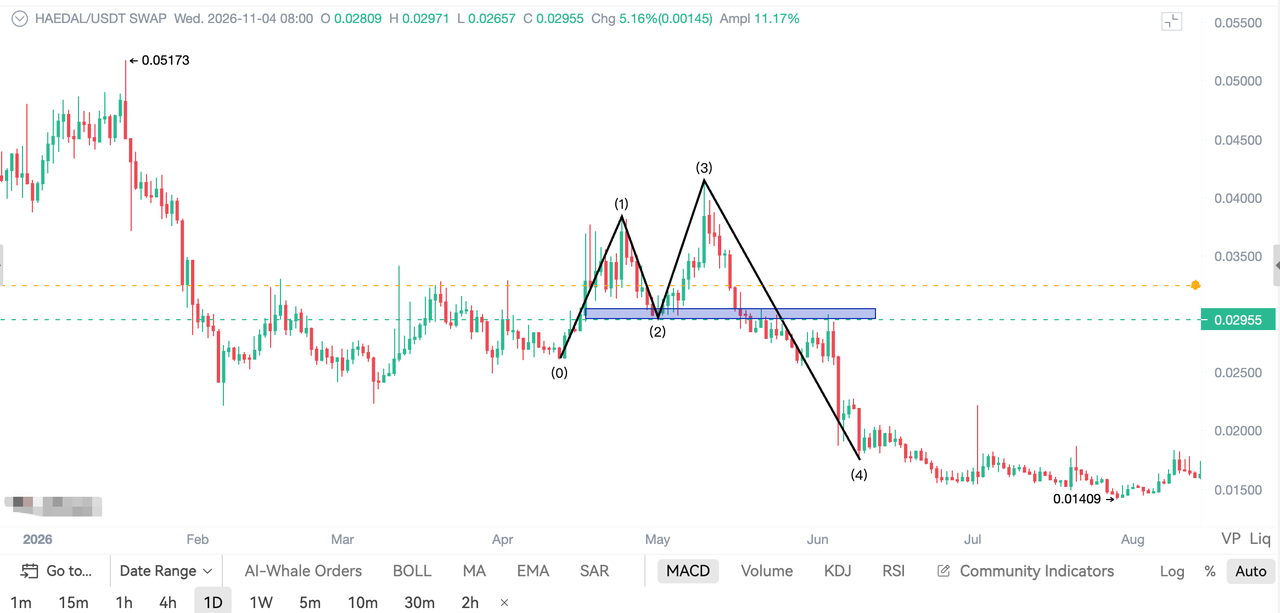
Figure 2: Price formed a classic M-top (double-top) reversal pattern and broke decisively below the pattern's neckline support. During the subsequent rebound, price retested the neckline but failed to break above it, confirming that the former support had turned into resistance. This retest provided a potential opportunity to add to an existing short position in line with the prevailing trend.
Ascending Channel + M-Top + Resistance: Multiple Structural Signals Confirm the Bearish Setup
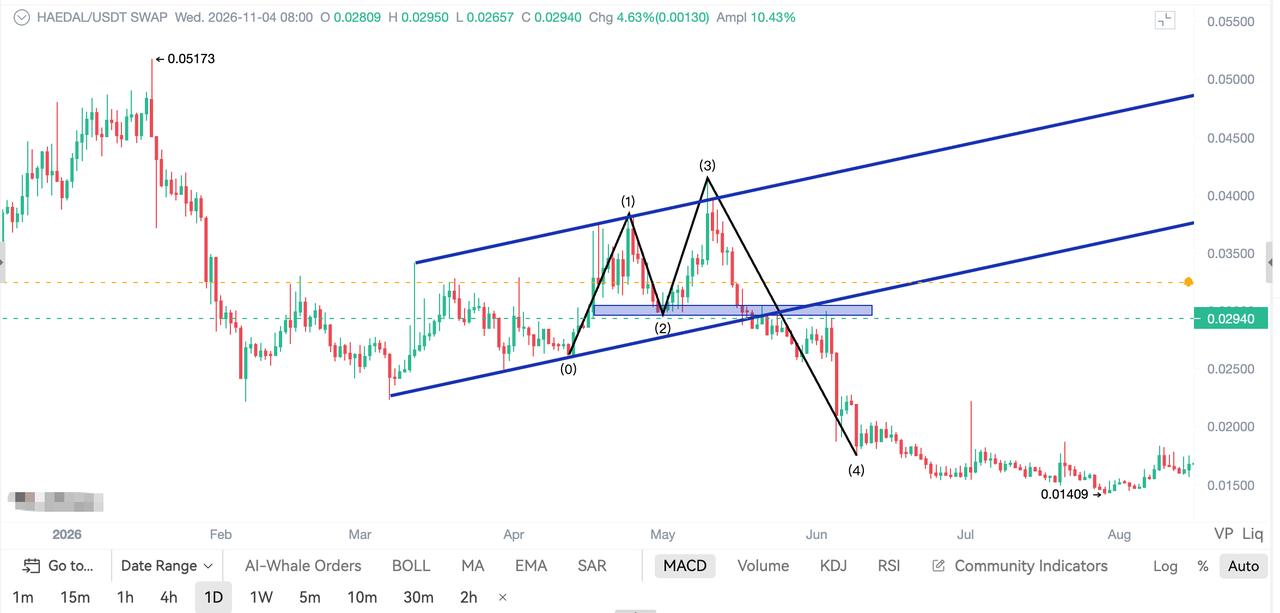
Figure 3: Combined confirmation from two major chart patterns. Price first broke below the long-term ascending channel, then formed an M-top reversal pattern, with the neckline subsequently acting as resistance. The alignment of these two bearish structures provides further confirmation of the daily downtrend. Any rebound toward the resistance zone may present a potential opportunity to establish or manage short positions in line with the prevailing trend.
Step 1 | Identify the Market Trend
Daily timeframe: The previous ascending channel has broken down, followed by an M-top reversal pattern. The higher-timeframe trend is bearish, with sellers dominating the overall market. Prioritize looking for short opportunities on rebounds rather than attempting to catch a bottom by opening long positions.
Step 2 | Identify Key Signals
Price rebounds into the M-top neckline resistance zone, which overlaps with resistance formed by the former lower boundary of the ascending channel after the breakdown. These two resistance levels converge, and the rebound's failure to make further upside progress signals potential selling pressure.
Step 3 | Look for Entry Signals
When price reaches the neckline and former channel boundary resistance zone, look for signs of a stalled rebound and bearish candle closes, supported by declining volume and weakening indicators, before establishing a short position. If price rebounds and retests this resistance zone a second time, consider adding to the position in line with the prevailing downtrend.
Step 4 | Set SL/TP Levels
Place the SL order above the neckline resistance, allowing a reasonable buffer to avoid being stopped out by a false breakout. Set the first TP target near the previous low and the second at a target level below the descending channel. Close the position in stages as price reaches each target.
Step 5 | Apply Leverage Management Principles
As this setup involves a major daily timeframe trend with a wide price range, consider using lower leverage. Avoid oversized positions and frequent leverage increases. Maintain strict risk management to reduce the risk of liquidation caused by sudden price spikes.
2. HYPE/USDT Perpetual Futures (Daily Chart | Bullish Confluence Setup Combining Fibonacci Retracement, Channel Structure Flip, Moving Averages, and MACD)
Fibonacci 50% Retracement Holds, While a Support Flip Creates a Second Base
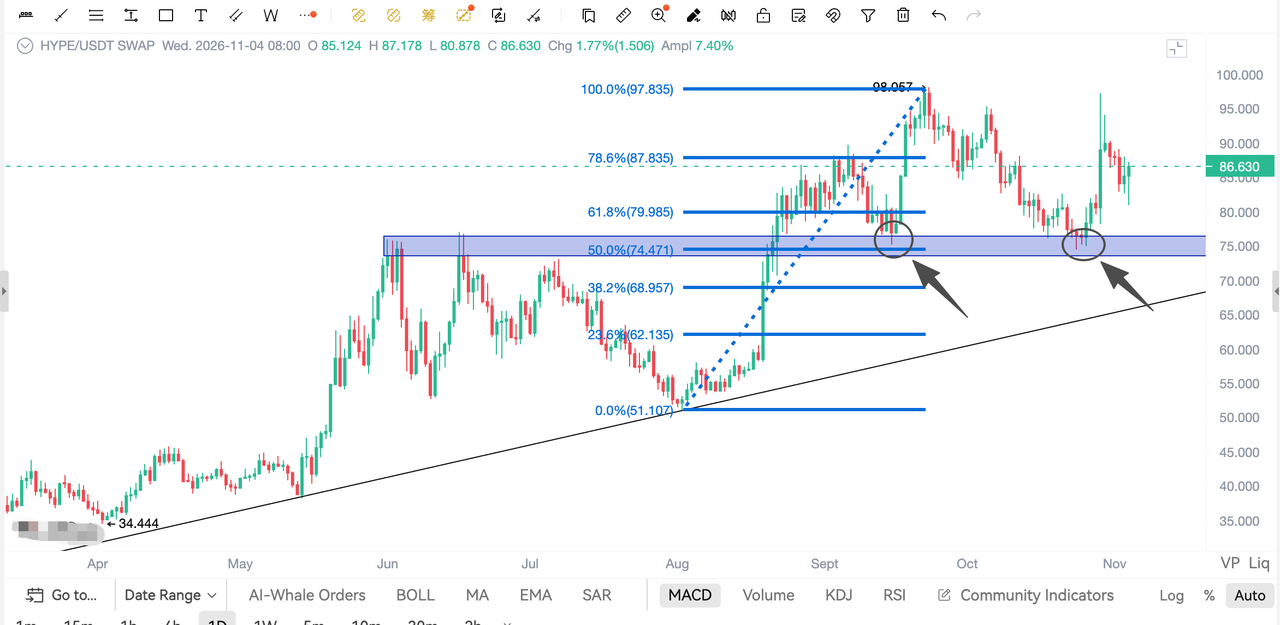
Figure 1: Price pulled back to the 50% Fibonacci retracement level of the previous downtrend and found support. The former support of the ascending channel has since turned into a new support zone, forming a second base in the chart structure. This is a key area to watch for potential long entries.
Price Retests the Flipped Support Zone, While the Weekly Ascending Channel Remains Intact
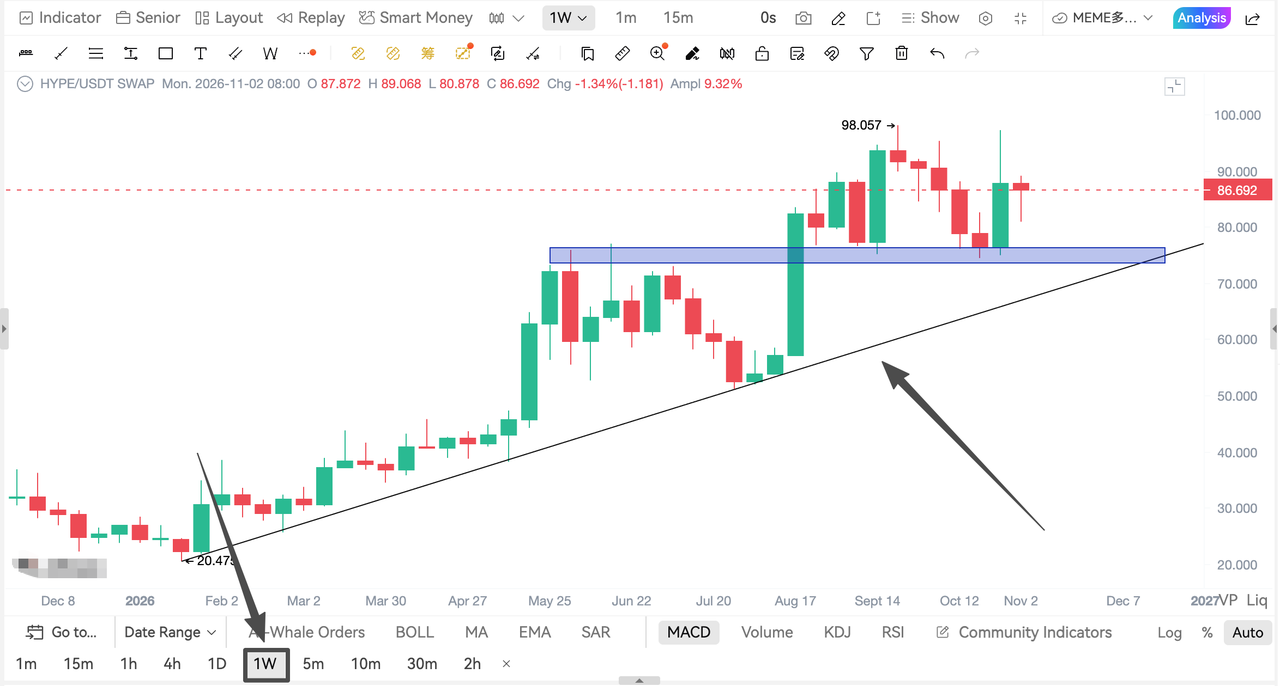
Figure 2: Price retests the support zone that has already undergone a support-resistance flip. From a higher-timeframe perspective, the weekly ascending channel remains intact, with no breakdown below its lower boundary. The broader trend therefore retains a bullish bias, making pullbacks toward support potential opportunities to establish long positions.
MA120 + MACD Golden Cross Confirm Bullish Confluence
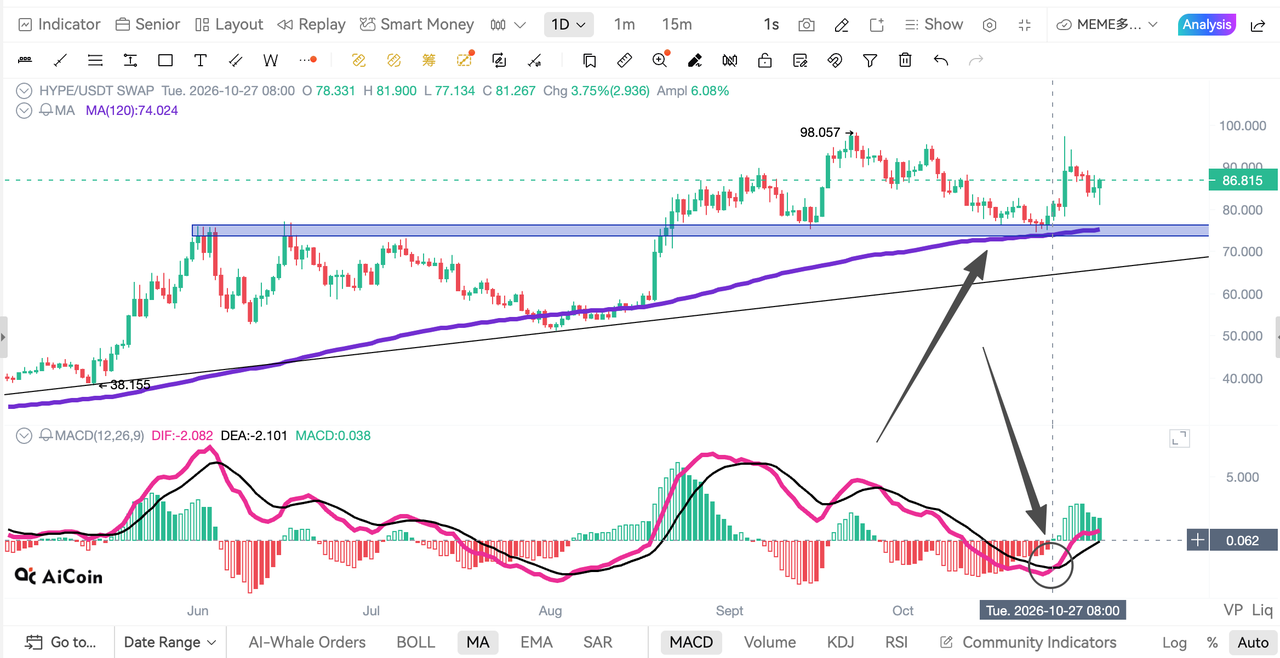
Figure 3: Price finds support at the MA120, while MACD forms a golden cross at a relatively low level. The moving-average structure and momentum indicator align to provide further confirmation of the bullish rebound setup. This confluence supports looking for opportunities to enter long positions near the support zone.
Step 1 | Identify the Market Trend
Daily timeframe: Price has stabilized at the 50% Fibonacci retracement level, while a support-resistance flip has created a second base. The broader weekly ascending channel remains intact, keeping the overall trend bullish. Prioritize looking for long opportunities on pullbacks to support rather than taking a bearish stance without sufficient confirmation.
Step 2 | Identify Key Signals
Price pulls back to the 50% Fibonacci retracement level, where it converges with support from the former channel resistance and the MA120. These multiple support levels form a confluence zone. A bullish reversal signal on the candlestick chart provides a potential signal to watch for long opportunities.
Step 3 | Look for Entry Signals
Once price stabilizes within the multiple-support zone and forms a bullish reversal candle, look for confirmation from a MACD golden cross before establishing a long position. If price retests the support zone a second time and holds, consider adding to the position in line with the prevailing uptrend.
Step 4 | Set SL/TP Levels
Place the SL order below the multiple-support zone, allowing a reasonable buffer to avoid being stopped out by a false breakdown. Set the first TP target near the previous swing high. For the second target, monitor the upper boundary of the weekly channel as potential resistance. Take profits in stages as price reaches each target.
Step 5 | Apply Leverage Management Principles
Although this is a trend-rebound setup on the daily timeframe, the risk of sudden intraday price spikes should not be overlooked. Consider using lower leverage. Avoid oversized positions and arbitrary increases in high leverage. Follow SL rules strictly and maintain disciplined capital and risk management.
3. Applying Multi-Indicator Confluence in Different Market Scenarios
3.1 How Different Tools Work Together in Bitunix USDT Perpetual Futures Trading
The following table outlines the role of each tool and its typical application in Bitunix USDT Perpetual Futures trading, with links to the corresponding Academy courses.
Tool | Key Question | Typical Application |
Trendlines | Where are the trend boundaries, and is a breakout genuine or false? | Use the 4H or daily chart and look for three-point trendline alignment. See the Trendline Guide. |
EMA | Is the medium- or long-term trend continuing or reversing? | Use EMA 30, EMA 120, and EMA 200. See the EMA Trading Strategy. |
BOLL | Is the market ranging or trending? | Use the 20-period, 2-standard-deviation setting. Watch for band contraction and expansion. See the BOLL Guide. |
Support and Resistance | Where are potential trading opportunities and key price zones? | Identify trading ranges, previous highs, and previous lows. See the Support and Resistance Guide. |
Fib | Where are potential high-probability pullback or rebound zones? | Watch the 38.2%, 50%, 61.8%, and 78.6% retracement levels. See the Fibonacci Confluence Guide. |
MACD | Is momentum shifting, and are there signs of divergence? | Look for golden crosses, death crosses, and bullish or bearish divergence. See the MACD Guide. |
Volume | Is a breakout supported by sufficient market participation? | Look for price and volume rising or falling together. See the Volume Trading Guide. |
KDJ | Is the market approaching short-term overbought or oversold conditions, or a potential turning point? | Use the (9, 3, 3) setting and monitor the 20/80 zones. See the KDJ Guide. |
3.2 Four Common Multi-Indicator Confluence Setups at a Glance
All entries require at least three confirming conditions and a completed candlestick close.
No. | Indicator Combination | Market Scenario | Example of Additional Confirmation |
① | EMA 30/120 + Trading Range + Volume | Trend Initiation | Golden cross/death cross + breakout + increased volume |
② | BOLL Contraction → Expansion + Trading Range + Volume | Potential Trend Shift | Band expansion in the direction of the breakout + volume confirmation |
③ | Fibonacci 38.2%–61.8% + EMA + KDJ/MACD + Candlestick Patterns | Pullback | Fibonacci counts as one condition; combine trend confirmation with two additional signals selected from momentum and volume |
④ | Flip Zone + MACD Divergence/Death Cross + Resistance | Potential Reversal | Key price level + divergence + death cross |
3.3 How This Strategy Relates to the Three-Step Futures Trading SOP
Step 1: Identify the Trend and Key Levels. Use trendlines, EMA, and support/resistance or Fibonacci levels to determine the overall trend and identify key price zones.
Step 2: Confirm the Trading Setup. Enter a trade only when the trend, key price levels, and at least three confirming confluence signals align.
Step 3: Manage the Trade. Apply SL rules, position sizing, and ongoing position monitoring throughout the trade.
This article does not provide a separate step-by-step execution checklist. Instead, both trading examples are analyzed within this three-step framework.
Important: Confluence can improve signal quality, but it does not guarantee profits. Futures trading involves leverage and significant risk. Always follow strict SL rules and position-size limits.
3.4 Multi-Indicator Trading Strategy | Complete Futures Trading Guide
4. Risk Management and Key Considerations
1. Reduce Confluence Weighting in Sideways Markets
As highlighted in our Bollinger Bands Guide, contracting bands and flattening channels typically indicate market consolidation or washouts; trading breakouts blindly during these periods carries elevated risk. The EMA Trading Strategy Guide similarly emphasizes that in choppy or range-bound assets, moving averages frequently cross over, rendering signals prone to failure. During consolidation, false golden crosses and death crosses across MACD and KDJ multiply. Traders should reduce position sizes or remain on the sidelines, pivot to a mean-reversion approach between the upper and lower bands, or wait for confirmed breakout expansion following a squeeze before entering with the trend.
2. Confirm on Candle Close
Both our Bollinger Bands and Support & Resistance Courses emphasize that intraday wicks piercing bands or key levels often signal false breakouts or deceptive volatility spikes. In Support and Resistance Guide, breakout validity is measured by 2–3 consecutive candles closing firmly above or below the level, while Bollinger Bands Strategy advises against executing orders based on fleeting intraday price swings. In practice, always wait for the candle to close before entering a trade. On the platform, you can configure Bitunix Super Alert with candle-close conditions to avoid getting stopped out by wick sweeps.
3. Never Enter on a Single Indicator
Our Fibonacci Confluence Trading Strategy sets a strict rule: touching the 61.8% retracement level alone does not warrant immediate execution. Entries require validation from at least two (and ideally three or more in live execution) confluence factors, such as moving averages, KDJ indicators, candlestick confirmation, or volume profiles. The KDJ Trading Strategy and Volume Trading Strategy similarly explain that an isolated golden cross or simple volume contraction is insufficient to confirm a structural reversal—diminishing volume often reflects mid-range churn rather than a genuine bottom. When only a single signal appears, treat the setup as non-confluent.
4. Respect Strong Trending Markets
Fib Confluence Trading Strategy notes that aggressive trending momentum can easily blow through key retracement levels such as 61.8% and 78.6%. Furthermore, the KDJ Trading Strategy points out that in sustained one-way trends, oscillators can remain pegged in overbought (>80) or oversold (<20) territory for prolonged periods, generating frequent false divergences and premature crosses. In strong trend regimes, prioritize trend-following setups aligned with EMA direction and widening Bollinger Band expansions. Reserve KDJ strictly for timing pullback entries within the dominant trend—never use it to catch falling knives or top-tick counter-trend reversals.
5. Maintain Charting Consistency
The Fib Confluence Trading Strategy requires anchoring levels strictly to complete swing-wick extremes rather than mixing candle bodies, which leads to level drift. Additionally, our Support & Resistance Guide highlights that horizontal swing highs/lows and high-density liquidity clusters offer the highest probability confluence when they align directly with Fibonacci ratios. Trading desks and individual post-trade reviews must standardize these drawing conventions and save setups via Bitunix KLine Ultra chart templates to prevent conflicting price levels across the same strategy.
6. Leverage and Position Sizing
Across our EMA, Bollinger Bands, and MACD trading examples, risk parameters remain consistent: maintain conservative leverage at ≤10x (aggressive capped at ≤20x), keep single-trade exposure under 10% of total portfolio margin, and strictly prohibit holding losing positions at maximum margin. The Fibonacci Guide recommends a minimum risk-to-reward ratio (R:R) of 1.5 : 1. Beginners should practice charting, confluence checklists, and SL execution on Bitunix Demo Trading before deploying capital in live futures contracts.
7. Risk Disclaimer
This article and the Academy articles referenced above are for educational purposes only and do not constitute investment advice. Digital asset and futures trading involve significant risks, and leverage can amplify losses and potentially lead to liquidation. Always conduct your own research and comply with applicable local laws and regulations, as well as Bitunix platform terms, fees, and regional restrictions.