Buying into a 45% Bitcoin pullback—right as BTC breaks below $70,000 amid a $622 million liquidation flush—feels uncomfortable.
Yet that exact washout is why hunting for the best crypto to buy now ahead of 2027 requires a strict filter rather than hype. As of November 13, 2026, Bitcoin sits near $68,700—well off its October 2025 peak of roughly $126,000—weighed down by hotter-than-expected U.S. inflation data and a five-day, $1.44 billion outflow streak across U.S. spot Bitcoin ETFs that pushed 2026 net flows into negative territory.
Stripping out thin-liquidity traps and heavy unlock schedules during a market-wide deleveraging leaves a clear risk-tiered shortlist: Bitcoin (BTC), Ethereum (ETH), and Solana (SOL) anchor the core; Sui (SUI) and NEAR lead the mid-cap growth tier; and a smaller slice of higher-risk plays targets AI compute and tokenized assets.
Ahead, we score each tier using hard on-chain and supply metrics, separate genuinely undervalued setups from low-unit-price traps, and show where exchange execution quality makes a measurable difference to your bottom line.
How We Screened the 2027 Shortlist (November 2026 Baseline)
Before ranking any token by upside, every candidate had to clear four quantitative filters designed for a risk-off market:
Liquidity floor: At least $100 million in genuine 24-hour spot volume across tier-one exchanges, ensuring you can enter or exit without moving the order book.
Supply discipline: Under 15% annualized circulating supply inflation from team or investor token unlocks over the next 12 months.
On-chain traction: Verifiable protocol fee generation or active developer and user retention—not incentives propped up purely by token emissions.
Multi-cycle survival or institutional rails: Either proven recovery across prior bear markets or active spot ETF / institutional custody infrastructure.
2027 Crypto Scorecard: The Best Crypto to Buy Now, Ranked by Risk Tier
The ranking below orders assets from the lowest to the highest risk tier rather than by projected return, since no return forecast can be verified in advance. Every figure is a market snapshot taken on November 13, 2026, and will shift with live trading.
Direct-Answer Block: 2026–2027 Asset & Gateway Matrix
The following table summarizes price, supply, the main 2027 catalyst and the main risk for each asset covered in this guide:
Asset | Price | Supply in circulation | 2027 catalyst to watch | Primary risk | Primary risk |
Core | Bitcoin (BTC) | ~$68,700 | ~96% of 21M cap | Return of spot ETF net inflows; rate cuts | Prolonged ETF outflows |
Core | Ethereum (ETH) | ~$1,925 | 122.2M, no hard cap | Glamsterdam mainnet timing; staking ETF demand | Fee leakage to Layer 2s; upgrade delays |
Core | Solana (SOL) | ~$78.60 | No hard cap | Alpenglow finality in production; app fee growth | Revenue tied to speculative trading cycles |
Growth | Sui (SUI) | ~$0.78 | 41% of 10B | Fee-paying usage vs. unlock schedule | Dilution: FDV is ~2.4x market cap |
Growth | NEAR | ~$3.31 | ~1.35B, no hard cap | Chain abstraction adoption | Usage may not translate into token demand |
Growth | Aptos (APT) | ~$0.54 | ~42% of 2.1B | Recovery in on-chain activity | Dilution; down about 83% in 12 months |
Growth | Celestia (TIA) | ~$0.42 | ~85% of 1.17B total | Rollup demand for data availability | Low fee revenue; about 98% below its high |
High beta | Bittensor (TAO) | ~$207 | 56% of 21M cap | AI subnet revenue vs. token emissions | Valuation ahead of revenue |
High beta | Render (RENDER) | ~$1.50 | ~83% of 644M | Paid GPU rendering and AI workloads | Competition from centralized cloud |
High beta | Kaspa (KAS) | ~$0.028 | ~97% of 28.7B | Smart-contract layer adoption | Narrow exchange coverage |
High beta | Ondo (ONDO) | ~$0.35 | 49% of 10B | Growth of tokenized Treasuries and equities | Token value capture; future unlocks |
How Each Risk Tier Is Traded and Held
Risk Tier | Typical Hold Period | Best Way to Buy & Manage |
Core | Multi-year (through full cycles) | Spot buying, U.S. spot ETFs, or perpetuals to hedge downside |
Growth | 12–24 months (review around token unlocks) | Spot on major exchanges; perpetuals for swing trades |
High beta | Short-to-medium term (event-driven, small size) | Spot on liquid exchanges; avoid high leverage due to thin depth |

Crypto assets grouped by risk tier, with price and circulating supply share as of November 13, 2026.
The 4-Pillar Evaluation Framework: Methodology, Metrics, and Tokenomic Audits
Every asset in the scorecard above is stress-tested against four repeatable checks using public on-chain and market data:
1. Real on-chain activity. Protocol fees paid, organic stablecoin transfer volume, and daily active addresses are read together so that automated bot traffic or wash transactions cannot inflate the picture. Sources: DefiLlama, Token Terminal, Artemis.
2. FDV dilution pressure. The ratio of circulating market cap to fully diluted valuation (float percentage), paired with insider and ecosystem unlock schedules over the next 12 months. Sources: Tokenomist and official project vesting documentation.
3. Developer retention. The number of full-time developers still committing code at least a year after onboarding—a far cleaner signal of ecosystem durability than raw repository counts, especially after developer mindshare split heavily toward AI projects in 2026. Source: Electric Capital Developer Report.
4. Order-book friction. Bid-ask spread, resting liquidity within ±0.5% of the mid-price, and actual execution slippage on a realistic $25,000 to $50,000 order across major spot venues.
Rather than assigning a static numeric score—which goes stale within days as order-book depth thins out or unlock cliffs approach—each token is graded dynamically. Any asset that fails two or more checks automatically drops a risk tier, a filter that quickly weeds out fragile mid-caps during market-wide deleveraging events like November 2026.
How Tokens Pass or Fail: The 4-Pillar Audit Thresholds
Evaluation Pillar | Green Light (Pass) | Red Flag (Fail / Downgrade Trigger) |
1. Real On-Chain Activity | Steady or growing fee revenue and stablecoin settlement over 90 days | High transaction count paired with near-zero fee capture or falling active users |
2. FDV Dilution Pressure | Circulating float ≥ 65%, or < 15% annualized supply unlock over the next 12 months | Low float (< 45%) facing heavy VC/team cliff unlocks into weak spot demand |
3. Developer Retention | Flat or rising multi-year full-time contributor base year-over-year | Sharp drop in full-time commits once initial grant or airdrop incentives end |
4. Order-Book Friction | ±0.5% depth > $250K on tier-one exchanges; < 0.3% slippage on a $25K market order | Wide spreads and > 1.0% slippage on a $25K order, trapping mid-sized buyers |
Macro Inflection Point: Year-End Capital Rotation and the 2027 Institutional Liquidity Wave
The institutional bid that carried the market through late summer has decisively reversed. U.S. spot Bitcoin ETFs absorbed roughly $3.5 billion in August and $2.6 billion in September before flipping to $515 million in net outflows during October.
Selling accelerated in early November—starting with $1.28 billion in redemptions during the first week and another $1.44 billion across the five sessions through November 11, pulling cumulative 2026 net inflows into negative territory. Spot Ether ETFs have fared no better, extending their withdrawal streak past six consecutive weeks.
Interest-rate repricing explains part of the exodus, though it was hardly the only trigger.
Following three straight months of upside U.S. inflation surprises, Goldman Sachs tightened its Federal Reserve outlook on November 11—adding a 25-basis-point rate hike in March 2027 on top of its expected December 2026 increase, and pushing the first rate cut back to December 2027.
Combined with steady ETF outflows, a tech-stock sell-off, and over $1.3 billion in 24-hour leveraged liquidations once Bitcoin broke below $70,000, that macro pressure dragged the Crypto Fear & Greed Index down to a four-month low of 20 ("Extreme Fear") by November 13.
Even on November 9, when U.S. equities posted their biggest single-day rally since April, Bitcoin stalled near $75,000 before rolling over—underscoring that crypto is decoupling to the downside rather than riding broader equity risk appetite.
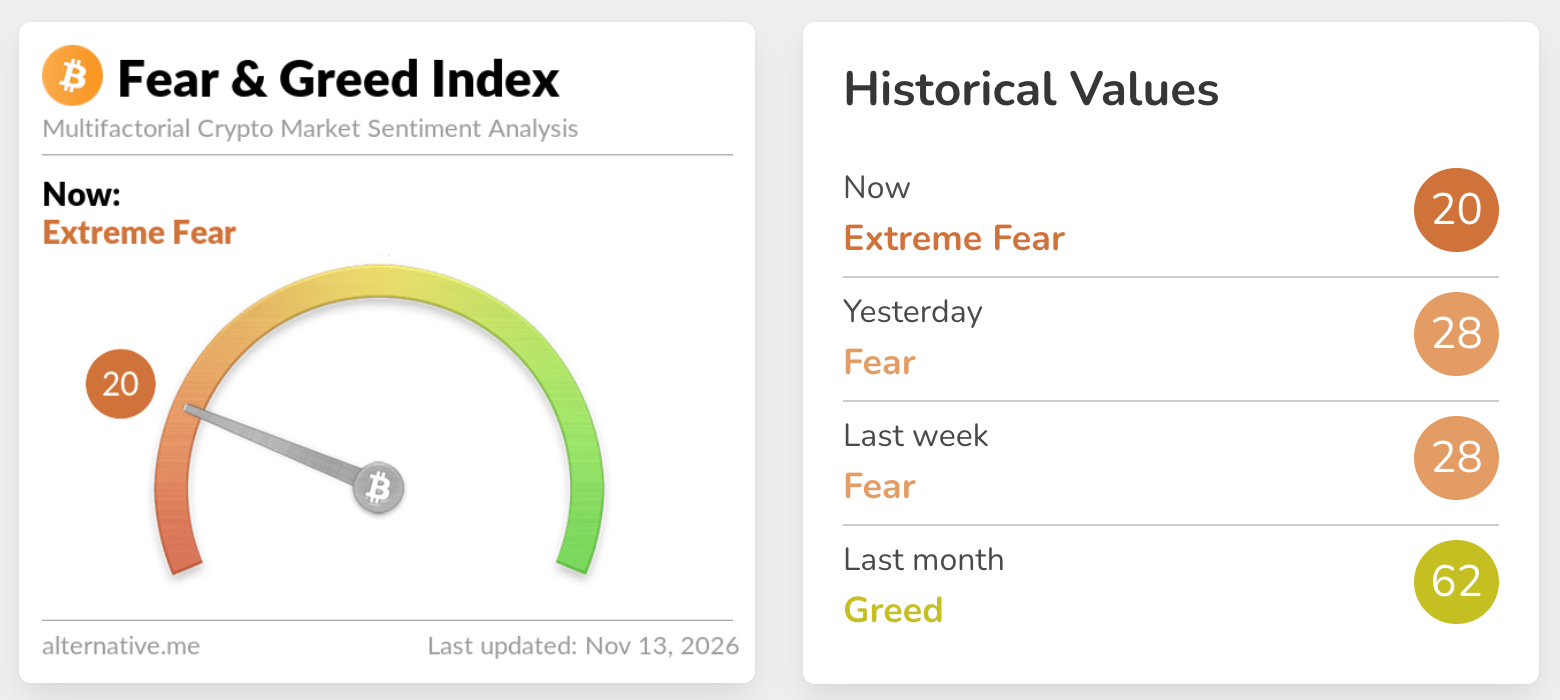
Crypto Fear & Greed Index falls to 20 (Extreme Fear) on November 13, 2026. Source: Alternative.me
A genuine 2027 liquidity wave therefore hinges on three observable shifts:
A clear Fed pivot back toward easing, replacing the December 2026 and March 2027 rate hikes now being priced into bond markets.
Sustained multi-week net inflows returning across both U.S. spot BTC and ETH ETFs rather than isolated single-day bounces.
Bitcoin reclaiming and holding its 50-week moving average (~$75,200), which it closed below in early November after a seven-week stint above the line.
Until those signals show up on the tape, year-end portfolio rebalancing and tax-loss harvesting remain the more probable drivers of near-term flows.
Blue-Chip Anchors: Large-Cap Assets for Long-Term Holding
For investors weighing which crypto to buy today for long-term holding—or which is the best crypto to invest in across a multi-year horizon—the shortlist starts with three assets.
None of them is immune to steep drawdowns; Bitcoin itself traded as low as $59,100 in June 2026. What sets these three apart is deep order-book liquidity, regulated institutional rails, and battle-tested network durability.
Bitcoin (BTC): Institutional Reserve Asset, ETF Net Inflows, and Macro Hedge Status
Bitcoin's investment case rests on its hard cap of 21 million coins and the deepest liquidity pool in digital assets. Even after recent redemptions, U.S. spot Bitcoin ETFs hold roughly $93.7 billion in net assets—giving pension funds, registered investment advisers, and corporate treasuries a compliant, liquid gateway into the asset.
Its "macro hedge" label, however, deserves scrutiny. Throughout 2026, BTC has traded like a high-beta liquidity asset rather than digital gold—lagging both physical gold and U.S. equities during November's rebound and reacting far more sensitively to ETF flow reversals than to inflation prints. For a 2027 thesis, the single most important variable to monitor is multi-month ETF flow direction, because those funds now act as the market's marginal buyer and seller.
Ethereum (ETH): Layer 1 Settlement Moat, Staking Yield Floors, and L2 Cannibalization Dynamics
Ethereum remains the primary settlement layer for institutional tokenization, hosting roughly 43% of distributed real-world asset (RWA) value as of late September 2026.
Native staking pays around 2.5% annually in ETH, and staking-enabled spot ETFs now pass that yield directly to fund shareholders—offering a baseline reference rate for long-term holders, even if it cannot act as a hard price floor during risk-off sell-offs.
The network's core structural tension is Layer 2 cannibalization.
Most retail transaction volume has migrated to rollups that pay minimal data-availability fees back to the base layer, capping mainnet fee burn. Glamsterdam—the next major upgrade designed to expand Layer 1 throughput—activated on the Sepolia testnet on October 6, 2026, but developers postponed its subsequent Hoodi testnet fork to address smart-contract gas compatibility risks, leaving no firm mainnet date. Against that backdrop, ETH trades roughly 61% below its $4,946 peak.
>>> Related Reading: Ethereum Future Outlook: What's Next for ETH, Scaling, and Network Upgrades
Solana (SOL): Retail Execution Engine, Firedancer Maturation, and App-Layer Fee Velocity
From an engineering standpoint, Solana has delivered on its roadmap. Jump's Firedancer—an independent validator client—has operated on mainnet since December 2025, reducing single-client concentration risk.
On October 21, 2026, the network also activated Alpenglow to replace its legacy consensus mechanism, targeting ~150-millisecond finality compared with roughly 12.8 seconds previously (an independent 24-hour sample two days after launch recorded a median finality of 404 milliseconds).
Token performance has yet to reflect those technical milestones: SOL is down about 26% over the past 30 days, while U.S. spot Solana ETFs have logged net outflows over the past month. Because Solana's fee revenue still relies heavily on decentralized exchange and speculative trading activity, network cash flows expand and contract with retail risk appetite.
Sub-second finality strengthens Solana's edge for high-frequency order books and consumer payments, but sustained non-speculative volume is what will ultimately drive long-term token value.
Core Tier Comparison: What Drives Recovery for BTC, ETH, and SOL in 2027
Core Asset | Drawdown from ATH (Nov 13, 2026) | Native / ETF Yield | Marginal Buyer | Key 2027 Metric to Watch |
Bitcoin (BTC) | ~45% (from ~$126,000) | None | Spot ETFs & corporate treasuries | Multi-week net inflows returning to U.S. spot ETFs |
Ethereum (ETH) | ~61% (from $4,946) | ~2.5% staking yield | Institutional RWA issuers & ETFs | Glamsterdam mainnet rollout & L1 fee capture |
Solana (SOL) | ~73% (from ~$294) | ~5.0%–5.2% staking yield | Retail traders & on-chain DEX apps | Non-speculative payment & app fee retention |
Mid-Cap Growth Leaders: High-Conviction Layer 1s and Modular Infrastructure
Mid-cap Layer 1s and modular protocols offer the sharpest technical differentiation in crypto—and some of the steepest 2026 drawdowns. That disconnect between engineering progress and token performance defines both the upside and the trap in this tier.
Next-Gen Monolithic Chains (SUI, APT): Object-Based Architecture and Parallel Execution Breakthroughs
Sui and Aptos are both built on the Move programming language and process transactions in parallel, though they take different architectural paths. Sui models assets as independent objects so unrelated transactions can bypass global consensus ordering, whereas Aptos executes transactions optimistically and re-runs only the subset that conflicts.
The market has priced the two very differently.
SUI carries a roughly $3.2 billion market cap and gained U.S. spot ETF access in February 2026, though the token is still down about 47% year to date.
APT trades near $0.54 after an 83% slide over the past 12 months, hovering close to the all-time low it printed on August 30, 2026.
Heading into 2027, both networks face the same fundamental test: whether organic fee-paying usage can outpace ongoing token unlocks.
Interoperability & Modular Hubs (NEAR, TIA): Chain Abstraction and Data Availability Demand
NEAR is betting on chain abstraction—allowing a user to sign a single intent while the protocol handles cross-chain settlement behind the scenes without manual bridging. With a market cap of roughly $4.5 billion, it is the largest and most liquid asset in this tier.
Celestia specializes in modular data availability, letting Layer 2 rollups publish transaction data at a fraction of Ethereum's base-layer cost. While the architecture has seen broad technical adoption, rollups still pay minimal fees to use it, leaving TIA around $0.42—roughly 98% below its February 2024 peak.
Both NEAR and TIA ultimately hinge on the same proof point: converting developer adoption into protocol fees or a durable reason to hold the token.
Portfolio Risk Architecture: How a 25% Growth-Tier Cap Works
A practical way to manage mid-cap exposure is to enforce a hard ceiling on its share of your total crypto portfolio—such as the 25% weight used in our balanced allocation model earlier. If mid-caps are capped at 25% and the entire sleeve drops 80% during a prolonged risk-off stretch, the maximum hit to your overall portfolio is 20%.
An 80% drawdown is hardly theoretical—APT logged one over the past year. Whether you set that ceiling at 15%, 25%, or 35%, strict position sizing—not coin picking—is what caps the damage when a thesis takes longer than expected to play out.
Mid-Cap Tokenomics & Value-Capture Audit (November 13, 2026)
Asset | Market Cap vs. FDV | Circulating Float | Primary Value-Capture Mechanism | Core Structural Hurdle |
Sui (SUI) | ~$3.2B / ~$7.8B | 41% | Gas fees, storage fund lockups, & DeFi staking | Heavy multi-year unlock overhang (~2.4x FDV/MCap) |
Aptos (APT) | ~$480M / ~$1.13B | ~42% | Network gas fees & validator staking | Steep 12-month drawdown (-83%) & ongoing vesting supply |
NEAR | ~$4.5B / ~$4.5B | ~100% (no hard cap) | Gas fees (70% burned) & chain-abstraction settlement | High usage must scale enough to offset ~5% annual issuance |
Celestia (TIA) | ~$420M / ~$490M | ~85% | Blobspace data-availability fees & staking | Cheap blob pricing limits protocol fee revenue today |
High-Beta & Asymmetric Upside: Best Cheap Crypto to Buy Now Under $1
Searches for the best cheap crypto to buy now—or for the next breakout altcoin—usually focus on tokens trading below $1.
As of November 13, 2026, five assets on our scorecard clear that unit-price threshold: SUI ($0.78), APT ($0.54), TIA ($0.42), ONDO ($0.35), and KAS ($0.028).
TAO (~$207) and RENDER (~$1.50) sit well above $1, yet they anchor the same high-beta compute themes and belong in this comparison—and as any seasoned allocator will note, a sub-$1 unit price does not automatically mean a cheap valuation once circulating supply is factored in.
Decentralized Physical Infrastructure (DePIN) & AI (TAO, RENDER, KAS): Hardware Incentives vs. Compute Demand
Decentralized infrastructure networks pay token rewards to independent hardware operators who contribute compute or security. The long-term survival test is straightforward: whether paying enterprise and developer demand eventually replaces token emissions as the primary source of operator income.
Bittensor (TAO): Capped at 21 million tokens with 56% in circulation and a market cap near $2.4 billion. Ongoing emissions fund specialized "subnets" competing to produce decentralized AI services, making subnet fee revenue relative to token emissions the single most important ratio to track.
Render (RENDER): A decentralized marketplace for GPU rendering and AI compute capacity. With roughly 83% of maximum supply already circulating, insider dilution risk is low; the bigger hurdle is demand-side competition against centralized cloud hyperscalers on pricing, reliability, and enterprise tooling.
Kaspa (KAS): A proof-of-work Layer 1 rather than a DePIN protocol in the strict sense, but it belongs in this bucket as a hardware-secured network. Nearly 97% of its 28.7 billion supply has already been mined, meaning future miner security budgets will have to transition steadily from block subsidies to on-chain transaction fees.
Real-World Asset (RWA) Tokenization (ONDO): Institutional Treasury On-Ramps and Private Credit Yields
Real-world assets (RWAs) remain the crypto sector with the most measurable institutional adoption.
RWA.xyz data as of November 12, 2026 shows nearly $39.8 billion in distributed on-chain assets (excluding stablecoins), including roughly $13.9 billion in U.S. Treasury debt and more than 5.7 million holder addresses, while private and structured credit segments contribute roughly $8.6 billion alongside growing commodity ($5.1 billion) and tokenized stock ($3.9 billion) markets.
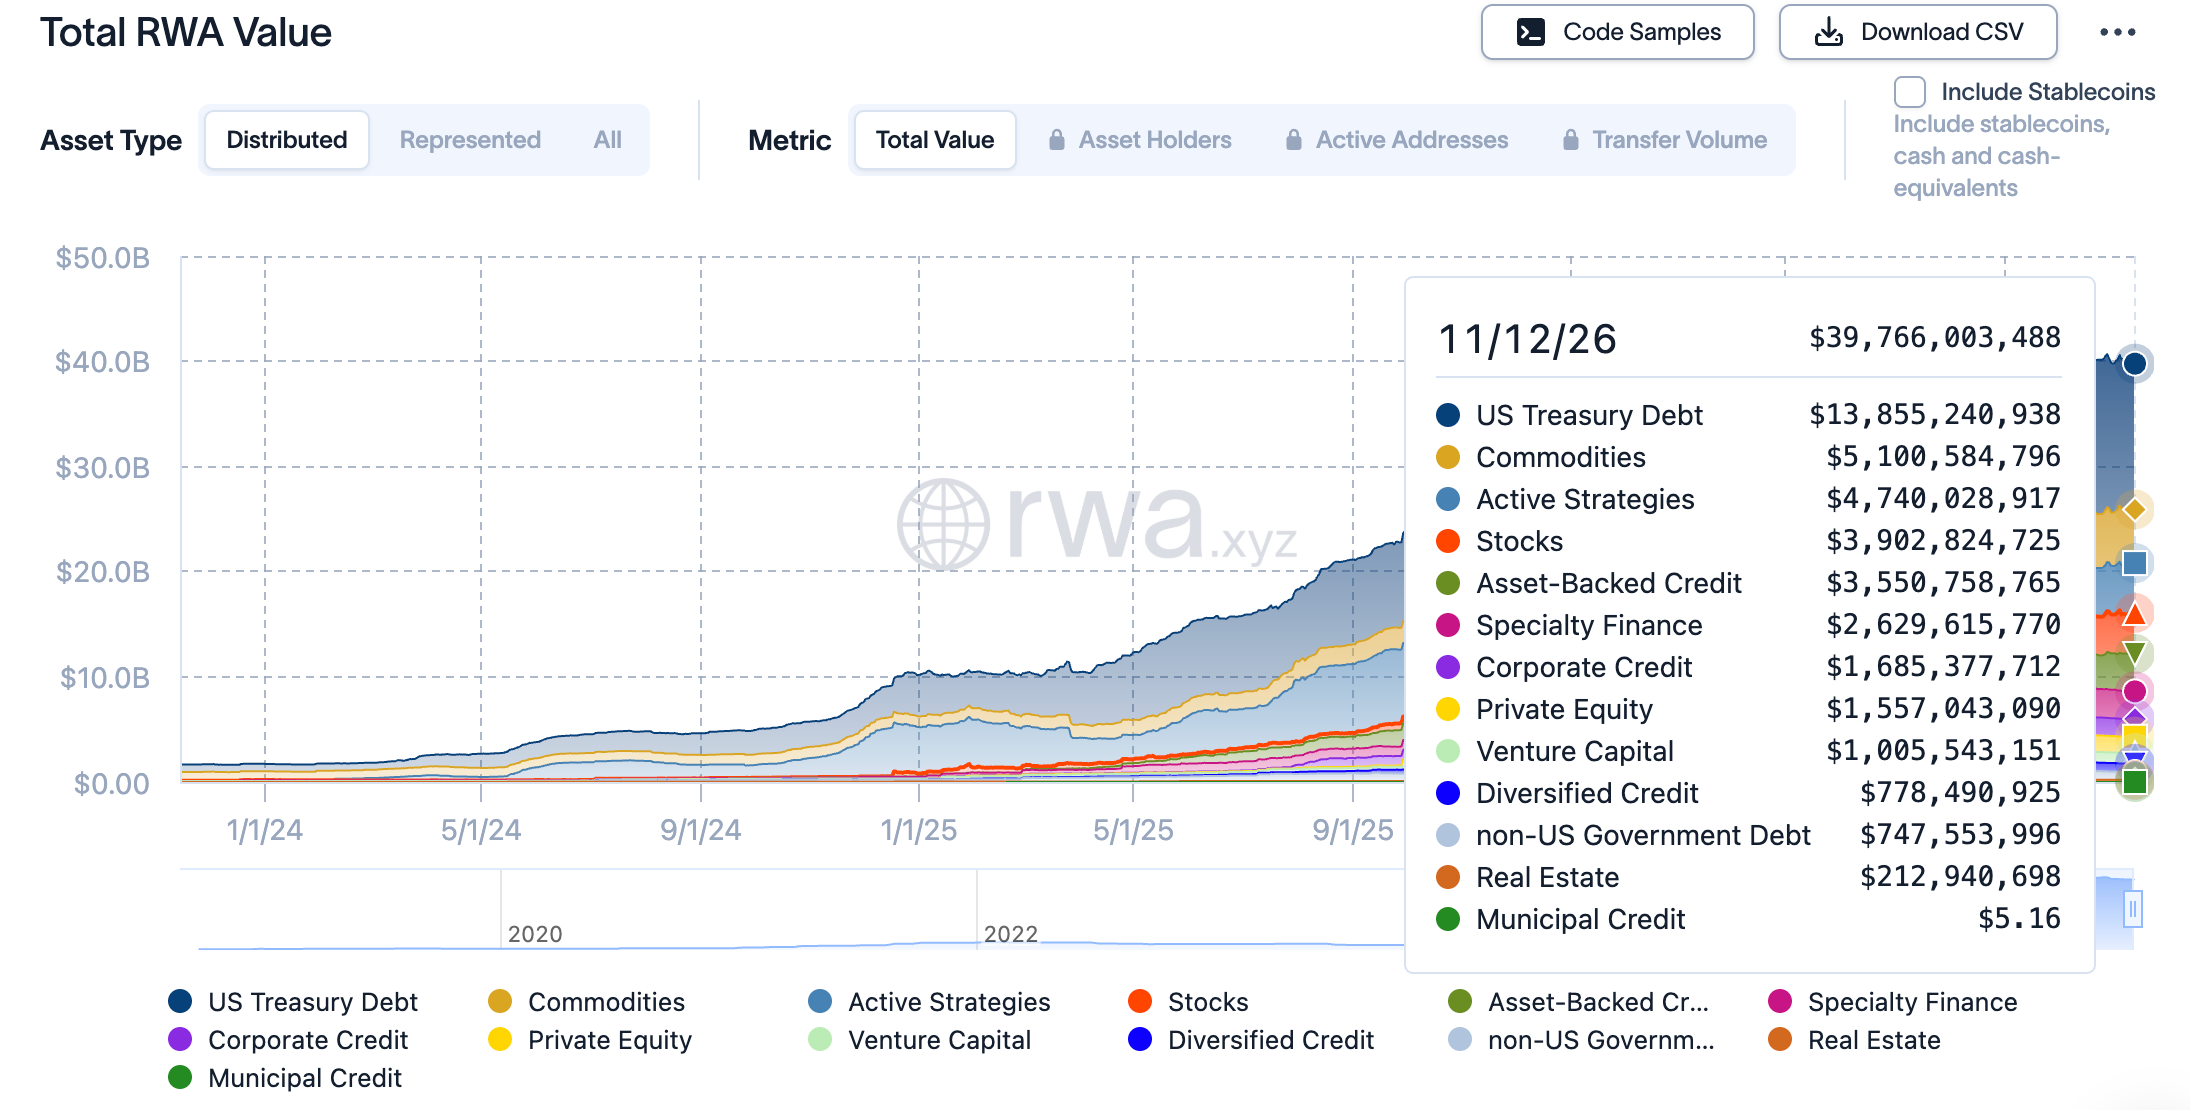
Distributed RWA value reached $39.77 billion on November 12, 2026, led by U.S. Treasury debt ($13.86B) and commodities ($5.10B). Source: RWA.xyz.
Ondo Finance is one of the largest issuers in the space, with its USDY product at roughly $2.4 billion. The ONDO token trades near $0.35 with a $1.7 billion market cap and 49% of supply in circulation.
The critical distinction for investors is that underlying Treasury yields go to holders of the tokenized funds rather than ONDO token holders—meaning the token's value rests on future governance and protocol economics that are much harder to model.
The Unit Bias Trap: Market Cap vs. Token Price Math Every Speculator Must Know
Unit bias is the common retail instinct that a $0.03 coin automatically has more room to run than a $200 token.
On its own, unit price tells you nothing about upside; what actually determines how much capital is required to move a token is market capitalization—current price multiplied by circulating supply.
What a $1 Token Price Would Require at Today's Circulating Supply (November 13, 2026)
Token | Price | Circulating supply | Market cap now | Market cap at $1 |
SUI | ~$0.78 | 4.14B | ~$3.2B | ~$4.1B |
ONDO | ~$0.35 | 4.87B | ~$1.7B | ~$4.9B |
KAS | ~$0.028 | 27.8B | ~$0.78B | ~$27.8B |
The gap in required capital is stark. For Kaspa (KAS) to reach $1, its market cap would have to climb to $27.8 billion—roughly 35 times its current size and more than a tenth of Ethereum's entire valuation. By contrast, SUI needs only a 28% gain from $0.78 to cross $1.
Supply dilution adds a second layer of difficulty: because SUI and ONDO still have more than half of their maximum supply locked for future release, the market cap required to sustain a $1 price will keep rising as new tokens enter circulation.

The same $1 price target implies vastly different market caps depending on circulating supply.
Bar chart comparing current market cap with the market cap needed at $1 for SUI, ONDO and KAS, illustrating unit bias in cheap crypto.
Risk Engineering: How to Spot and Avoid 2027 Tokenomic Traps
Most losses in altcoins come from flawed token structure, not from picking the wrong narrative. Running three checks before entering a position catches the majority of structural traps early.
Low Float, High FDV: Surviving VC Cliff Unlocks and Inflationary Token Dumps
A low-float, high-FDV token launches with a thin circulating supply alongside a towering fully diluted valuation (FDV). Early buyers set the price on a narrow float, only for insiders and early investors to unlock into that liquidity later.
Compare market cap with FDV. A ratio below 0.50 means more than half of the total supply has yet to hit the market.
Separate cliff unlocks from linear vesting. Large one-time cliff releases create sharp supply shocks, whereas small daily or monthly linear emissions are easier for spot markets to price in.
Measure each unlock against average daily volume. SUI's November 1 unlock of roughly 13.15 million tokens was worth about $12 million at the time against daily trading volume in the hundreds of millions—a size the market can absorb. A single cliff equal to several days of spot volume is a very different risk.
Mercenary TVL vs. Organic Sticky Liquidity: Auditing On-Chain User Retention
Total value locked (TVL) can easily be rented. Protocols distribute token incentives, mercenary capital arrives to farm the yield, and liquidity vanishes the moment emissions taper off. To separate rented TVL from sticky usage, check four metrics:
Post-incentive TVL retention: How much capital stayed on-chain after the last liquidity-mining program expired.
Fee-to-TVL efficiency: Whether locked assets actually generate protocol fees, since idle farm deposits produce none.
Whale concentration: The share of total deposits controlled by the ten largest wallet addresses.
Cohort address retention: Whether wallets active three months ago are still transacting organically today.
Smart Contract & Centralization Vulnerabilities: Upgradable Multi-Sigs and Regulatory Exposure
Many DeFi protocols remain upgradable by a small group holding multi-signature keys. While that setup allows rapid emergency patches, it also means a handful of signers can alter protocol rules unilaterally. Always verify how many signers are required, whether contract upgrades sit behind a public timelock, and which firms audited the codebase.
The May 2025 Cetus exploit on Sui illustrates both sides of validator and governance control. Roughly $223 million was drained through a math-library flaw before Sui validators coordinated on-chain to freeze approximately $162 million of the stolen funds.
That intervention contained user losses, yet it also demonstrated how much direct control a validator set can exercise when stakes are high. Tokens whose value depends on a single issuer or tight control group carry similar exposure to sudden rule or regulatory changes.
Pre-Entry Red-Flag Checklist: Screening Out Structural Traps
Risk Dimension | Green Light (Healthy Structure) | Red Flag (Pass or Size Down) |
Supply & Unlocks | Market cap / FDV ≥ 0.65; upcoming cliff unlocks < 10% of daily spot volume | Market cap / FDV < 0.40 with multi-day-volume insider cliffs ahead |
Liquidity Stickiness | TVL holds steady after incentives end; consistent fee generation per dollar locked | Steep TVL drop post-airdrop; top 10 wallets control > 50% of pool depth |
Control & Security | Audited contracts behind a ≥ 48-hour timelock and broad validator/governance distribution | Uncapped admin upgrade keys with no timelock or single-issuer dependency |
Execution & Security: Finding the Best Place to Buy Crypto Safely
The best place to buy crypto is the venue where realized execution cost and counterparty risk stay lowest for the specific assets and order sizes you trade—both of which can be verified directly before deploying capital.
Execution Costs Beyond the Fee Table: Spreads, Slippage, and Peak-Volatility Stress
Your true trading cost equals exchange fees plus bid-ask spread plus slippage. Base spot fees across major exchanges typically sit around 0.08% to 0.10%, with base perpetual futures fees around 0.02% maker and 0.06% taker; Bitunix's published fee schedule falls squarely in that range without requiring native token lockups. On a thin mid-cap order book, however, a single market order can easily slip by several times the headline fee.
Order-book depth also needs to hold up under stress rather than just on quiet afternoons. During the sharpest 30-minute Bitcoin move on November 5, 2026, Bitunix reported that its BTC market retained roughly 90% of normal depth, with more than $31 million in resting liquidity near the mid-price. Regardless of which exchange you use, auditing order-book depth during recent sell-offs tells you far more than a calm-market average.
Precision Execution Tools: Multi-Chart Workspaces, Screeners, and Alerts
Managing a portfolio spread across three risk tiers means tracking multiple charts alongside token unlock dates. Workspace layout directly affects whether you spot those signals in time.
On Bitunix, PC Ultra consolidates multi-chart layouts, order entry, open positions, and risk controls into a single desktop workspace. Its Super Filter scans across markets for unusual price or volume moves—useful for catching breakouts or breakdowns in mid-cap tokens you do not watch every hour—while Super Alert triggers notifications on price, indicator, drawing, or candlestick conditions. Replay Trading, introduced in November 2026, also lets traders rehearse entries and exits candle by candle on historical data using simulated USDT balances before risking live capital.
Leverage warrants separate discipline. Bitunix offers up to 200x leverage on major pairs such as BTC and ETH; at that ratio, an adverse price move of roughly 0.5% is enough to exhaust initial margin—a stark contrast to altcoin volatility like SUI's ~9.5% single-day drop on November 5. High leverage compresses your distance to liquidation without improving the odds of a trade.
Solvency & Downside Protection: Proof of Reserves, Care Fund, and Fixed Risk Execution
Counterparty protection works best in layers:
Verifiable solvency: Proof of Reserves (PoR) using Merkle-tree cryptography lets users independently confirm that their account balances are included in exchange reserves exceeding client liabilities. Bitunix publishes ongoing reserve snapshots showing ratios above 100% on this basis.
Dedicated protection reserve: A ring-fenced backstop forms the second layer. On October 22, 2026, Bitunix expanded its Care Fund from $30 million to $50 million in USDC and published the verifiable on-chain address. The fund is earmarked for exceptional incidents requiring an exchange-level response; it does not reimburse ordinary trading losses, and any compensation is reviewed case by case.
Position-level loss caps: Execution controls form the third layer. Bitunix's Fixed Risk tool allows traders to define a maximum dollar loss prior to entry, automatically calculating the appropriate position size—though in fast-moving markets, execution slippage can still cause the realized loss to exceed the planned threshold.
Copy Trading and Weekly Net Settlement: How Profit Sharing Is Calculated
Copy trading automatically mirrors a lead trader's futures positions, meaning profit-sharing mechanics determine how much of any upside a follower actually keeps.
Bitunix settles copy-trading profit sharing on a weekly cycle running from Monday 00:00 to Sunday 23:59 UTC. The standard 10% share is calculated strictly on a follower's net realized profit for that weekly window—if a cycle ends in a net loss, no profit share is charged. Weekly netting protects followers compared with per-trade models that skim fees on individual winning trades even when the overall week finishes in the red.
Standard copy-trading caveats still apply: historical returns do not guarantee future performance, followers absorb the lead trader's drawdowns in real time, and standard trading and funding fees remain payable. Evaluating a lead trader's maximum historical drawdown and assets under management offers a much clearer risk gauge than chasing a 30-day return headline.
Looking Ahead to 2027: Discipline Outlasts Conviction
Finding the best crypto to buy now for 2027 is rarely about uncovering an obscure token before the crowd—it is about matching real on-chain fundamentals, clean token supply, and reliable trade execution to the drawdown you can actually endure. In a market still digesting rate-hike repricing and heavy ETF outflows as of November 2026, surviving the chop is half the return.
Anchor your core in assets with institutional rails, treat sub-$1 mid-caps and high-beta AI or RWA plays as sized bets rather than all-in wagers, and verify order-book depth before you click buy. Narratives will keep rotating into 2027, but the arithmetic of risk management never goes out of cycle.
Data Note: Crypto prices, market caps, and FDVs reflect snapshots as of November 13, 2026 (CoinMarketCap/CoinGecko); RWA metrics reflect RWA.xyz data as of November 12, 2026. For informational purposes only—not investment advice.