
Trading Guide
Futures Trading Quick Start
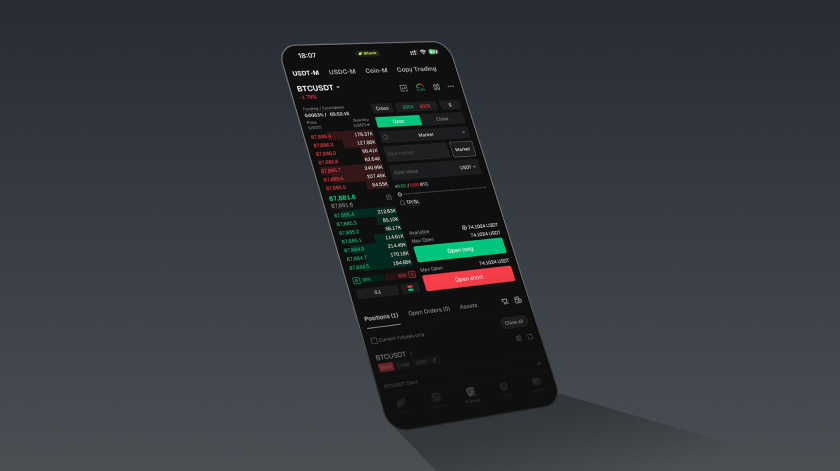
Complete Guide to Bitunix Futures Terminology (App)
This guide explains every major label on the Bitunix futures trading app — order book, order panel, positions, K-line chart, and common tools. Use it to read prices and risk metrics correctly, choose margin and order settings, and link to deeper tutorials on leverage, TP/SL, and fees.
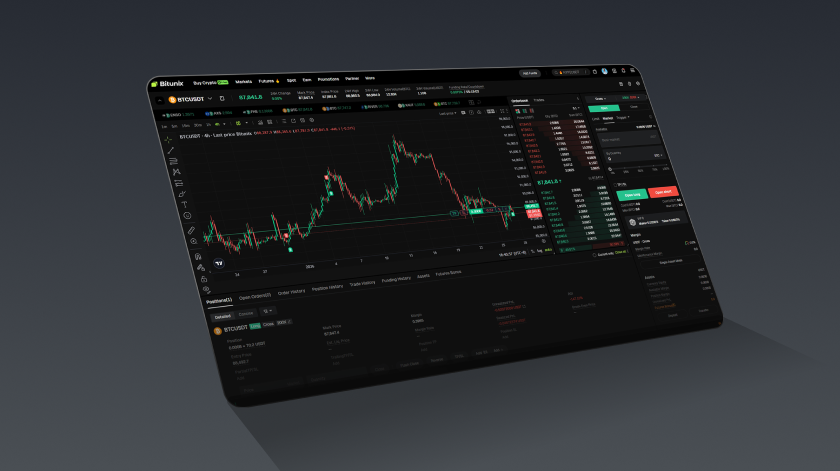
Complete Guide to Bitunix Futures Terminology (Web)
This guide explains every major label on the Bitunix futures trading web interface — top bar, K-line chart, order book, order panel, and positions table. Learn pricing, fees, and risk fields, then follow step-by-step workflows to trade with clearer judgment and lower avoidable liquidation risk.

Market News Analysis|How Macro Events Move Crypto Prices
Learn how six classes of market news—macro, policy, industry structure, whale/exchange events, black swans, and news plus technical levels—often influence crypto prices and Bitunix perpetual futures. This guide gives a quick comparison table, product definition, a before/during/after workflow, risk rules, and FAQs for compliant, SEO-friendly education (not trading advice).
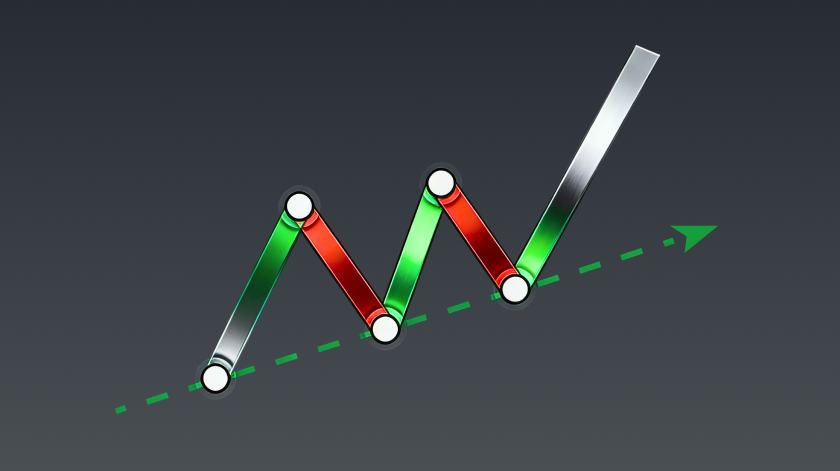
How to Draw Trend Lines | Crypto Technical Analysis for Beginners—1
Technical Analysis Basics 1 teaches how to draw uptrend and downtrend lines on Bitunix futures charts using the three-touch rule, body anchors, and higher timeframes. It contrasts valid vs invalid examples, walks through web/app drawing and price alerts, and links trend discipline to safer futures execution.
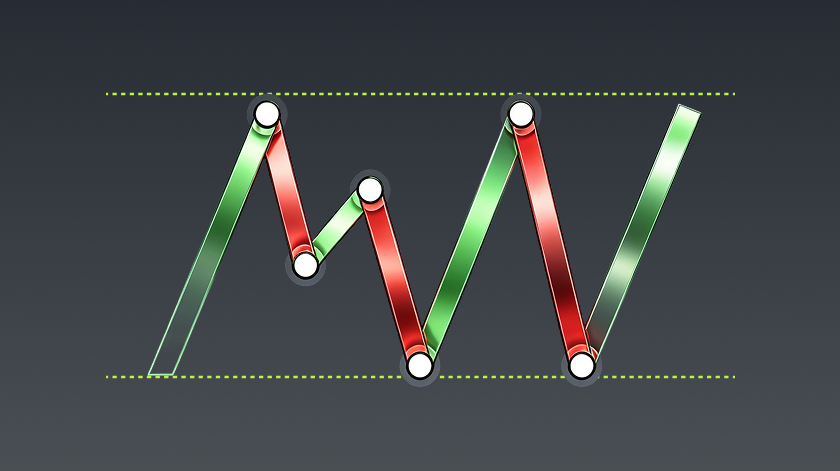
Support and Resistance Levels | Crypto Technical Analysis for Beginners‑2
Technical Analysis Basics 2 explains support and resistance on Bitunix futures charts—how to mark levels, judge valid vs invalid zones with volume and time, and apply breakout, retest, and S/R flip logic with price alerts and disciplined futures risk management.
Advanced Trading Guide|High‑Probability Trading Signals
This advanced practical lesson teaches a two-phase framework for Bitunix perpetual futures: before entry (trend + key levels + triple-confirmed signals) and after entry (logic, rhythm, self-control). It walks through educational case patterns (e.g. trend-channel longs, Fib support holds, failed box breakouts) with alerts, sizing, and risk—not a promise of profits.

Trading Decision Framework|3‑Step Trading SOP
This guide defines a three-step SOP for Bitunix perpetual futures: (1) preparation, (2) confirmation via trend + key level + entry signal, (3) risk control before, during, and after the trade. It includes difficulty tiers, example wait vs execute cases, alert setup, and compliance-focused disclaimers—not guaranteed profits.

Futures Risk Management|Capital Protection Best Practices
This guide explains why liquidation happens on Bitunix perpetual futures—especially under isolated margin—and how to control margin ratio, leverage, funding, and stop-loss before the system force-closes your position. It is educational capital-protection content, not a guarantee against loss.

Bitunix Futures Long-Short Hedge Guide
This playbook explains long–short hedging (long/short lock) on Bitunix USDT-margined perpetual futures: opening matched long and short exposure to manage uncertainty around events or choppy markets. It covers use cases, a five-step execution flow, cost and margin notes, risks, and FAQs—education only, not trading advice.
K-line Indicators

Single Candlestick Patterns | Bitunix K-Line
Part of the 34 K-line patterns series, this lesson defines single candlestick shapes on Bitunix charts—Doji, Hammer, Hanging Man, Shooting Star, Inverted Hammer, and Gravestone Doji—plus a double-doji breakout framework. Learn meaning, confirmation rules, and how to apply patterns with trend, levels, and volume on futures—not as standalone buy/sell signals.

Double Candlestick Patterns | Bitunix K-Line
Part 2 of the 34 K-line patterns series covers eight two-candle formations on Bitunix charts—engulfing, piercing/dark cloud, harami, and tweezers—for BTC/USDT futures and spot. It explains bias, confirmation, stop placement, and how to combine patterns with trend, levels, and volume—not standalone signals.

Triple Candlestick Patterns | Bitunix K-Line
Part 3 of Bitunix’s 34 K-line patterns series teaches six three-candle setups on Bitunix charts—Morning Star, Evening Star, Three White Soldiers, Three Black Crows, Three Inside Up, and Three Inside Down—for reversal and momentum reads on spot and perpetual futures, with confirmation, execution steps, and risk controls (education only).

Continuation Patterns | Bitunix K-Line
Part 4 closes the 34 K-line patterns track with 14 continuation-focused (and related) formations on Bitunix charts—three methods, flags, pennants, rectangles, wedges, cup & handle, and rounding arcs—for trend continuation or breakout trades on spot and futures, with volume confirmation, stops, and risk rules (education only).

82 Candlestick Patterns Checklist | Bitunix
The 82 Ultimate Candlestick Patterns Handbook on Bitunix Academy turns K-lines from noise into a structured decision system: trend context, reversal vs continuation logic, and the Ultimate K-line Quick Check Table. This guide maps the handbook to the 34-pattern course track, K-line alerts, and safe futures execution—education only, not signals or investment advice.

K-Line Box Trading Strategy | Bitunix Futures
This guide explains the K-line Box Pattern on Bitunix perpetual futures—horizontal consolidation between support and resistance, midline no-trade zone, range trades at boundaries, and breakout trend rules with daily + 15m workflow, RIVER/ETH case logic, measured-move targets, and risk pitfalls (education only).

M-Top Double Top Strategy | Bitunix Futures
This guide explains the M-top (double top) bearish reversal on Bitunix perpetual futures—left peak, neckline, weaker right peak, and confirmed breakdown—with daily / 4H / 15m workflow, BTC/ETH case logic, measured-move take-profits, stop rules, and pitfalls (education only, not advice).

W-Bottom Double Bottom Strategy | Bitunix Futures
This guide explains the W-bottom (double bottom) bullish reversal on Bitunix perpetual futures—left bottom, neckline, right bottom, and volume-confirmed breakout—with D / 4H / 15m workflow, conservative vs aggressive entries, TP/SL/leverage rules, BTC/ETH success cases, and a RIVER false-break lesson (education only).
Technical Indicators

Fib Confluence Trading Strategy
The Fibonacci retracement tool, also known as the Golden Ratio tool, is a widely used technical analysis tool for identifying potential price levels. By selecting the swing high and swing low of a complete directional price move, traders can automatically generate key Fibonacci levels, including 23.6%, 38.2%, 50%, 61.8%, and 78.6%. These levels help traders identify potential support and resistance zones when the market retraces.
MA Trading Strategy
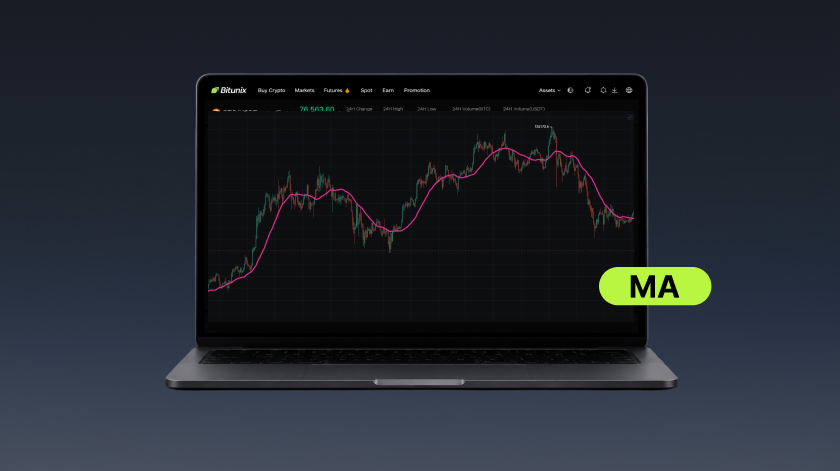
In crypto futures, trend is a core driver of returns, and the Moving Average (MA) is one of the most practical trend-following tools. This guide explains how MA works, bullish and bearish rules, signal validation, stop-loss and take-profit, and position sizing for leveraged trading. It covers daily plus 4-hour confirmation with volume and MACD, BTC and ETH case paths, when to avoid ranging markets, and how to use Bitunix price alerts and Super Alert for MA conditions—so traders can follow trends with clearer risk control.
EMA Trading Strategy
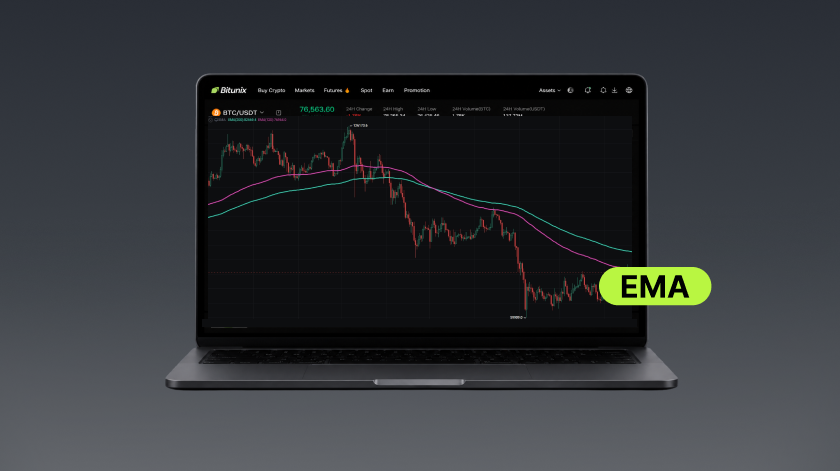
The Exponential Moving Average (EMA) weights recent prices more heavily than older data, so it reacts faster than a simple MA and suits short-to-medium trend tracking and reversal timing in crypto perpetual futures. This guide explains EMA30 with EMA120/200 for direction, ETH and BTC daily case workflows (death cross shorts, golden cross longs), entry at breakout or retest, stop-loss and staged take-profit rules, leverage caps, core risks (false crosses, ranging markets), FAQ, and how to configure Bitunix price and EMA alerts—helping traders follow trends with clearer risk control on Bitunix.
MACD Trading Strategy
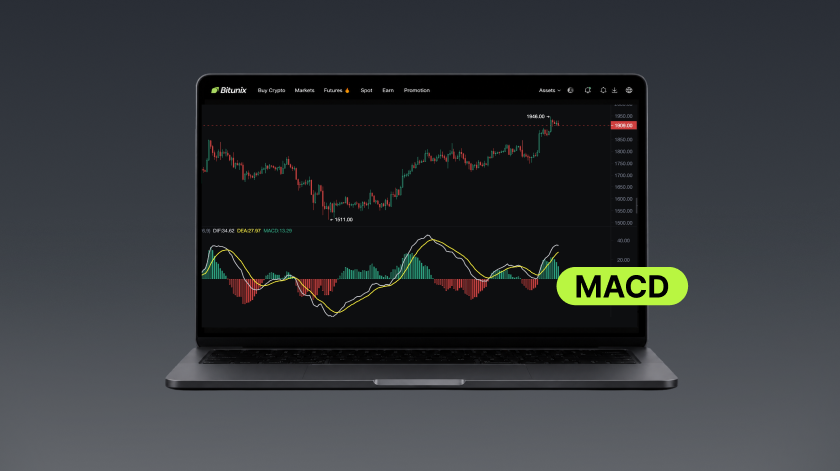
This guide explains how MACD measures momentum in crypto markets, covers four core patterns and multi-indicator filters (EMA, Bollinger Bands, support/resistance, candlesticks), walks through a five-step perpetual futures workflow (with ETH/BANK-style examples from Academy), and shows how to automate MACD conditions with Bitunix Super Alert. For education only—not investment advice.
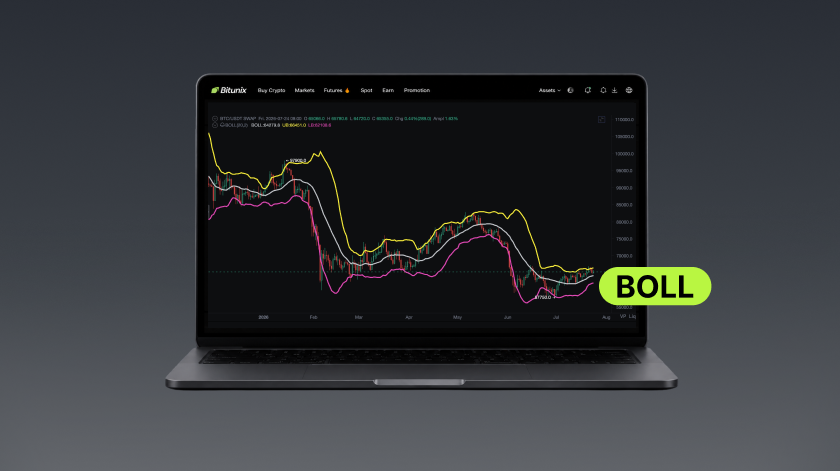
BOLL Trading Strategy
Covers BOLL structure (upper, middle, lower), expansion/contraction/parallel patterns, EMA and S/R confluence, ETH and BTC daily workflows, pitfalls, and Bitunix Super Alert. For learning only—not investment advice.
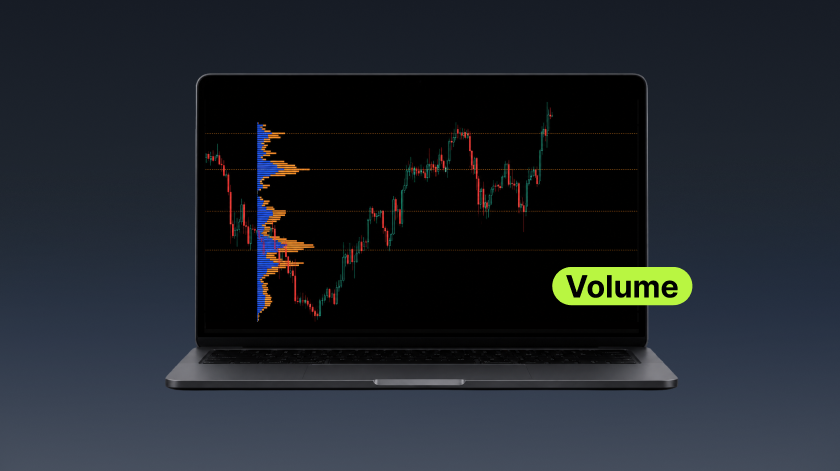
Volume Trading Strategy
Defines trading volume on Bitunix charts, four classic price–volume patterns, BICO/KOMA-style case logic, risk pitfalls, and Volume alerts via Super Alert. Educational only—not investment advice.

KDJ Trading Strategy
Core Value of KDJ 1. Identify overbought and oversold conditions to spot potential turning points in the market. 2. Use K/D crossovers, including golden crosses and death crosses, to identify potential entry and exit opportunities. 3. Detect divergences between price and the KDJ indicator to provide early signals of weakening trend momentum. 4. Combine KDJ with Bitunix's indicator alert feature, using candlestick patterns, volume and price analysis, plus support and resistance levels to confirm signals across multiple indicators.

RSI Trading Strategy
Core Trading Value of RSI 1. Identify Market Extremes: Quickly identify overbought and oversold conditions to avoid chasing price moves or selling into weakness, while identifying potential areas for pullbacks or rebounds. 2. Spot Potential Trend Reversals Early: Use bullish and bearish divergence patterns to identify signs of weakening momentum and assess potential reversal signals near market tops or bottoms. 3. Assess Trend Strength: Use the 50 midline to evaluate the prevailing momentum and market direction, helping traders align with the broader trend and avoid counter-trend trading. 4. Filter False Signals Through Multiple-Indicator Confirmation: Combine RSI with support and resistance techniques, price and volume analysis, and EMA moving averages to confirm signals across multiple indicators and reduce the risk of misinterpretation.
Trading Tools

Coinglass Bitcoin Liquidation Map for Futures Traders
Defines the Coinglass liquidation/clearing map, how to open it, how to read liquidation clusters and “magnetic” zones, and how to pair that with Bitunix perpetual execution, leverage, and stops. Third-party estimates only—education, not advice.

Coinglass Bitcoin ETF Data for Futures Traders
Explains Bitcoin spot ETFs, how to find ETF data on Coinglass, how to read BTC and USD net flows, and how to pair flow trends with daily structure (trend lines, S/R, Fib) when planning Bitunix perpetual strategies. Flows inform bias—not standalone signals. Education only.

Coinglass Bitcoin Rainbow Chart for Futures Traders
Defines the Bitcoin Rainbow Chart (log-scale sentiment bands), how to open it on Coinglass, and how futures traders on Bitunix can use it for macro bias, position sizing, and risk discipline—not as a sole trade signal. Education only; DYOR.
