

Chart layout is a feature set provided by the Bitunix platform for users to take a cloud snapshot of chart status. This feature set can help users complete transaction analysis using different chart status modes in different trading scenarios, thereby achieving the effect of website and mobile app collaboration on the Bitunix platform's charts, allowing users to automatically synchronize the content set at one end point to another end point.
In the chart layout function, we can combine various states such as time period, chart type, technical indicator, price type, multi-screen layout, and personalized chart settings that we have set, thereby releasing powerful functional combination effects. Next, let's use a specific combination example to explain how to improve our price analysis efficiency through chart layout.
Time period, chart type, indicator template, drawing template, chart template, these information can be reused across businesses. For example, the indicator template I set in the contract can be used in spot business, and the drawing template set in the copy business can be used in contract business. The data stored in the cloud will be migrated according to the user's account system. For example, the content set on the mobile phone can be synchronized to devices such as PC or iPad
For example, today I need to analyze EHTUSDT in order to find better entry opportunities and points to gain more profit margins.
Step 1:Switch to multi-screen mode on the chart using the multi-screen layout function
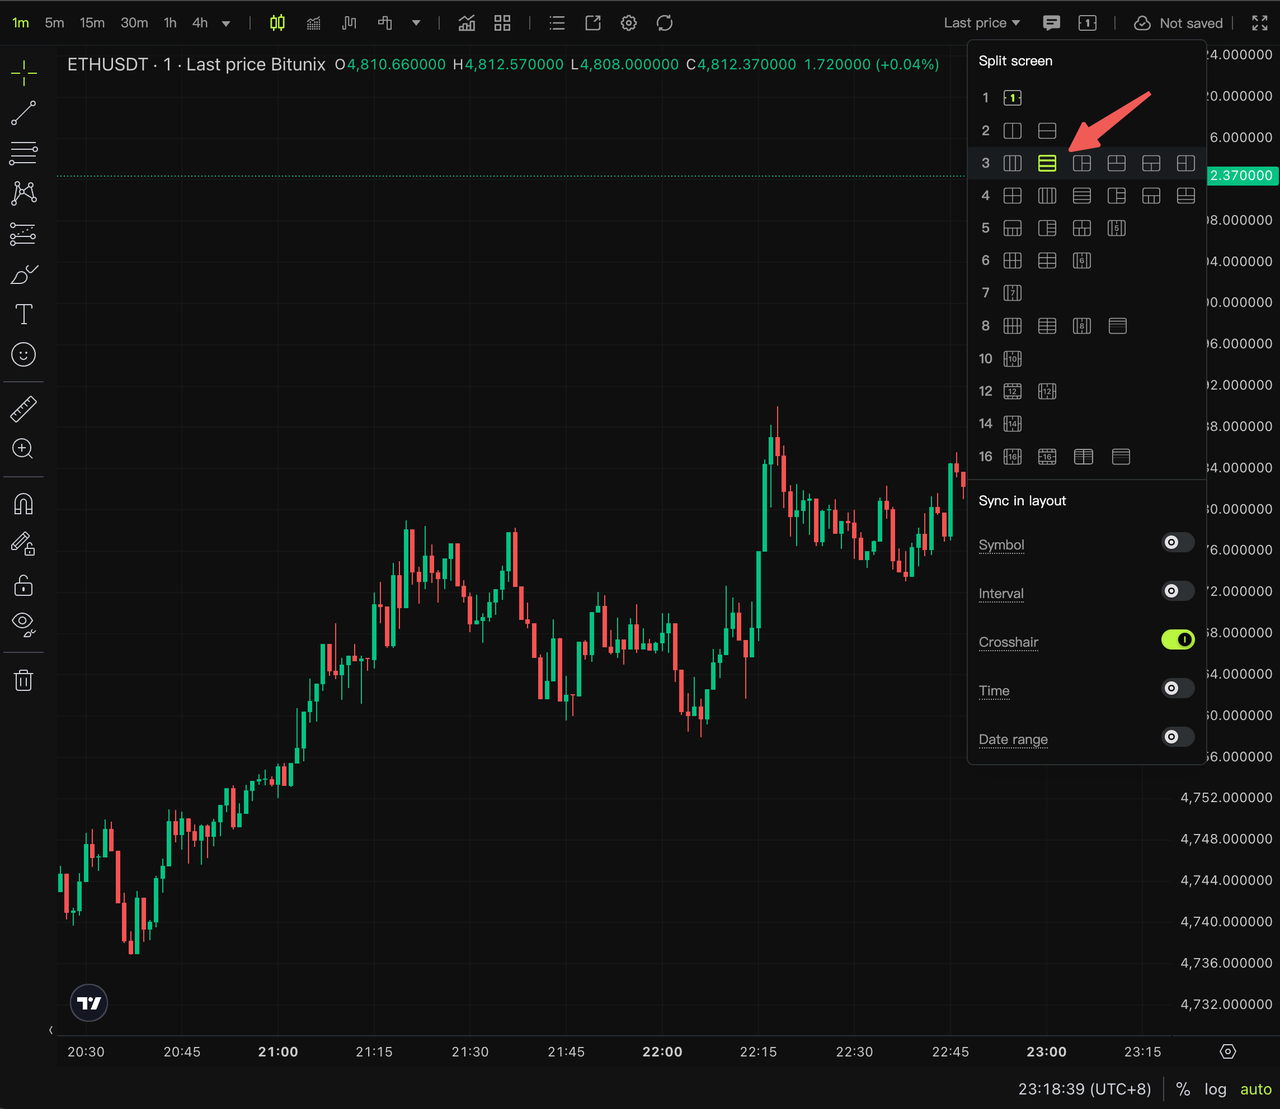
Set different time period modes for each sub-window and set line chart display mode for 1-minute time period

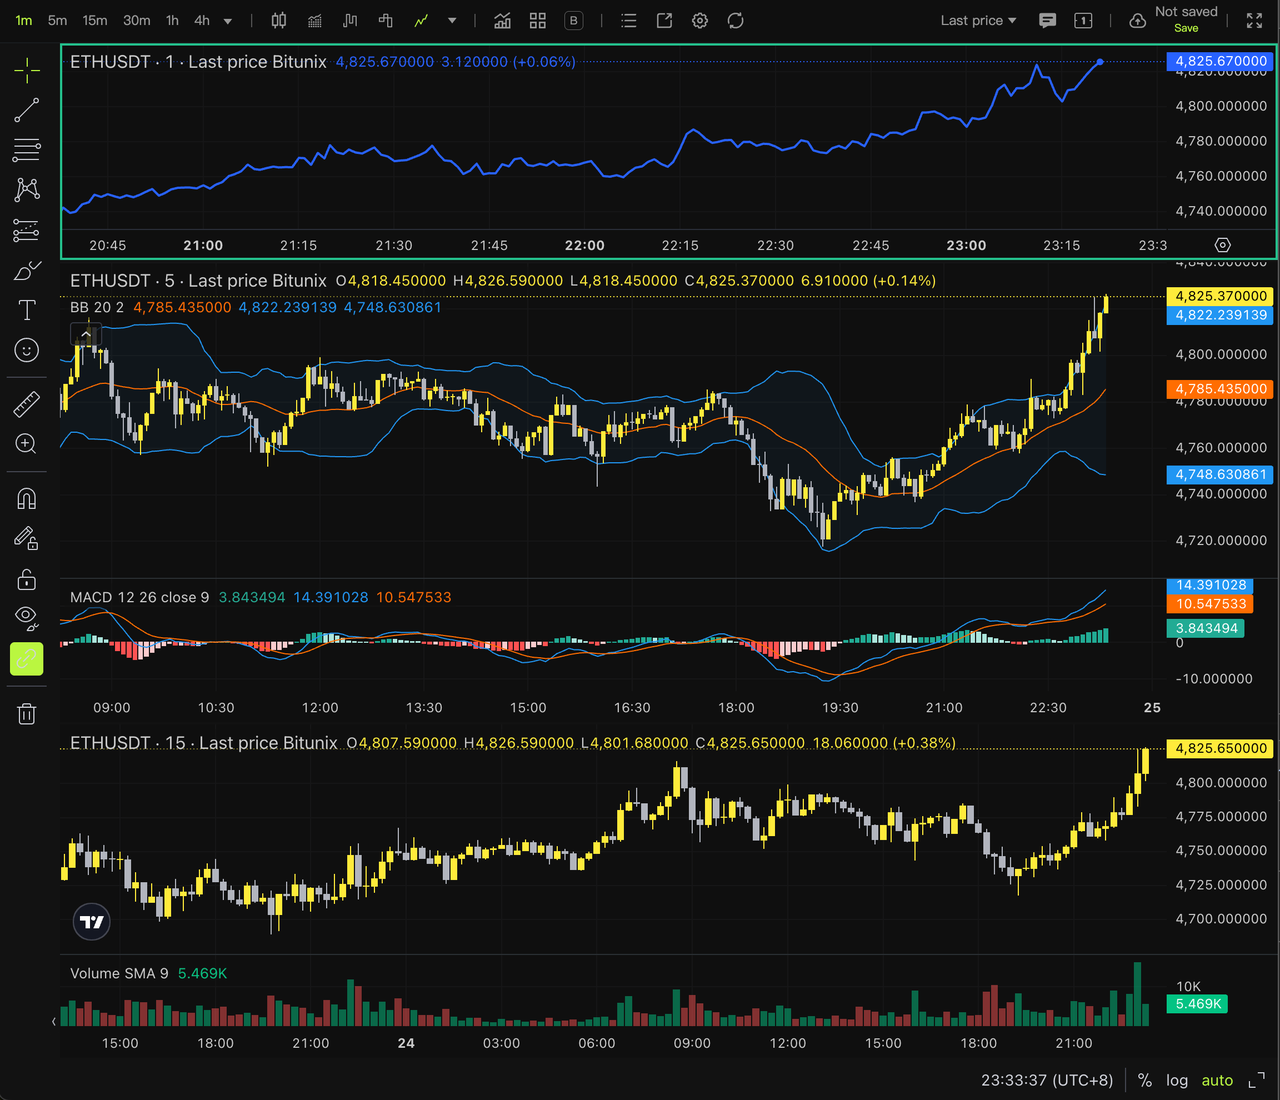
Step 2: The step is to analyze different indicators for different multi-screen windows
For example, we set the Bollinger Bands and MACD indicators separately for the ETHUSDT window in 5-minute mode, and set the Volume indicator separately for the ETHUSDT window in 15-minute mode. We can perform combined analysis through multi-screen indicators.
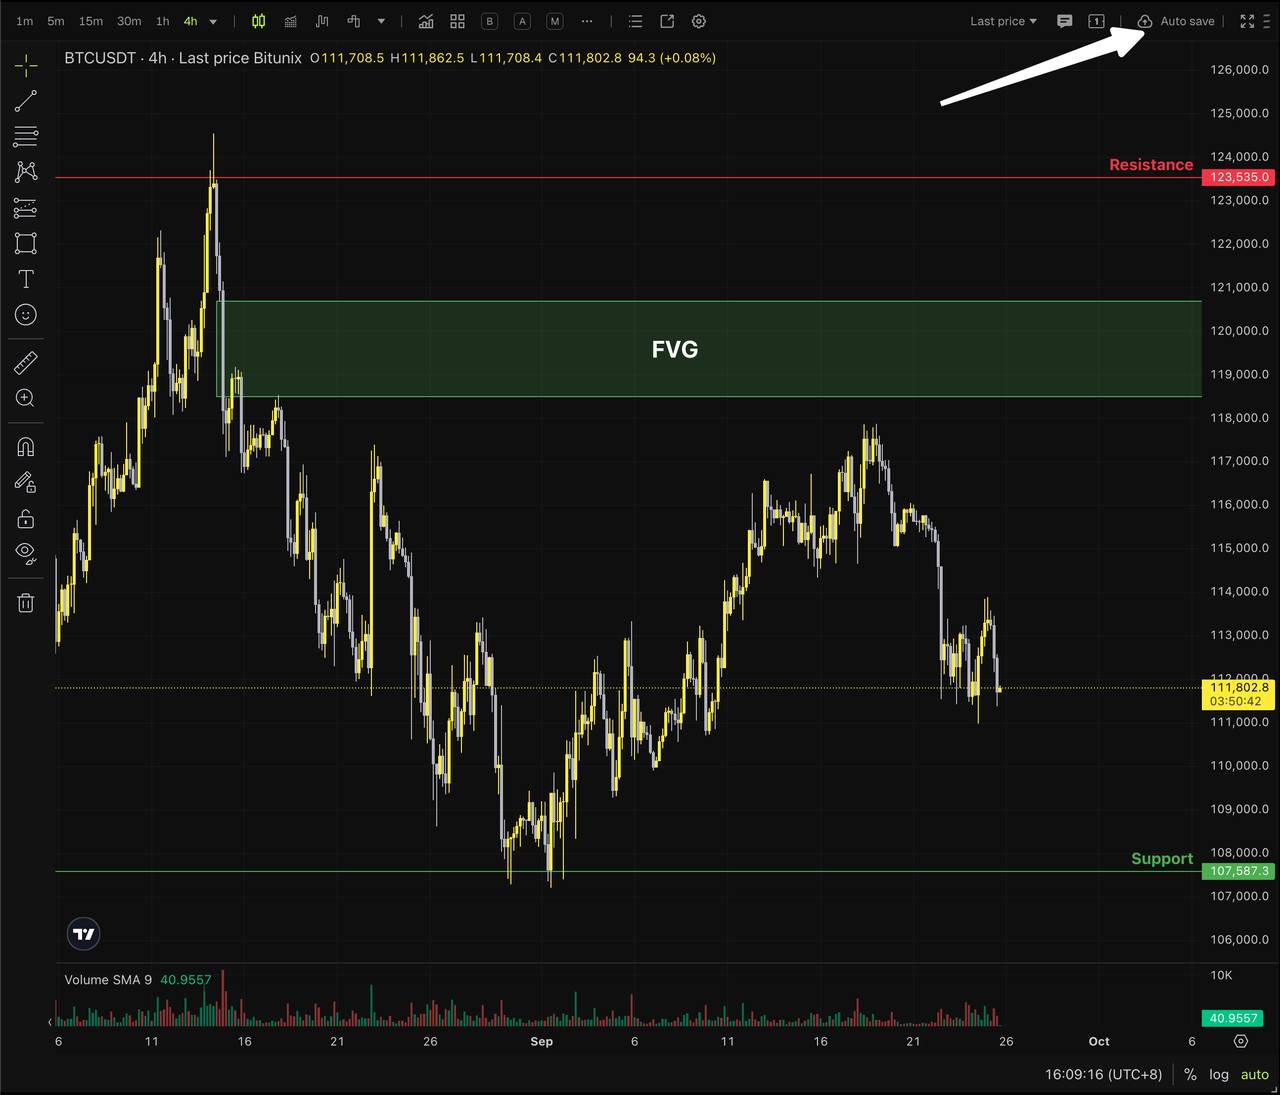
Step 3: Step is to store the current layout.
In Windows operating system, you can use [Ctrl + S], and in macOS system, you can use [╰ + S] shortcut to save. You can also click the Save hotspot in the upper right corner to save the chart layout, and the program will automatically execute the save after 3 seconds.
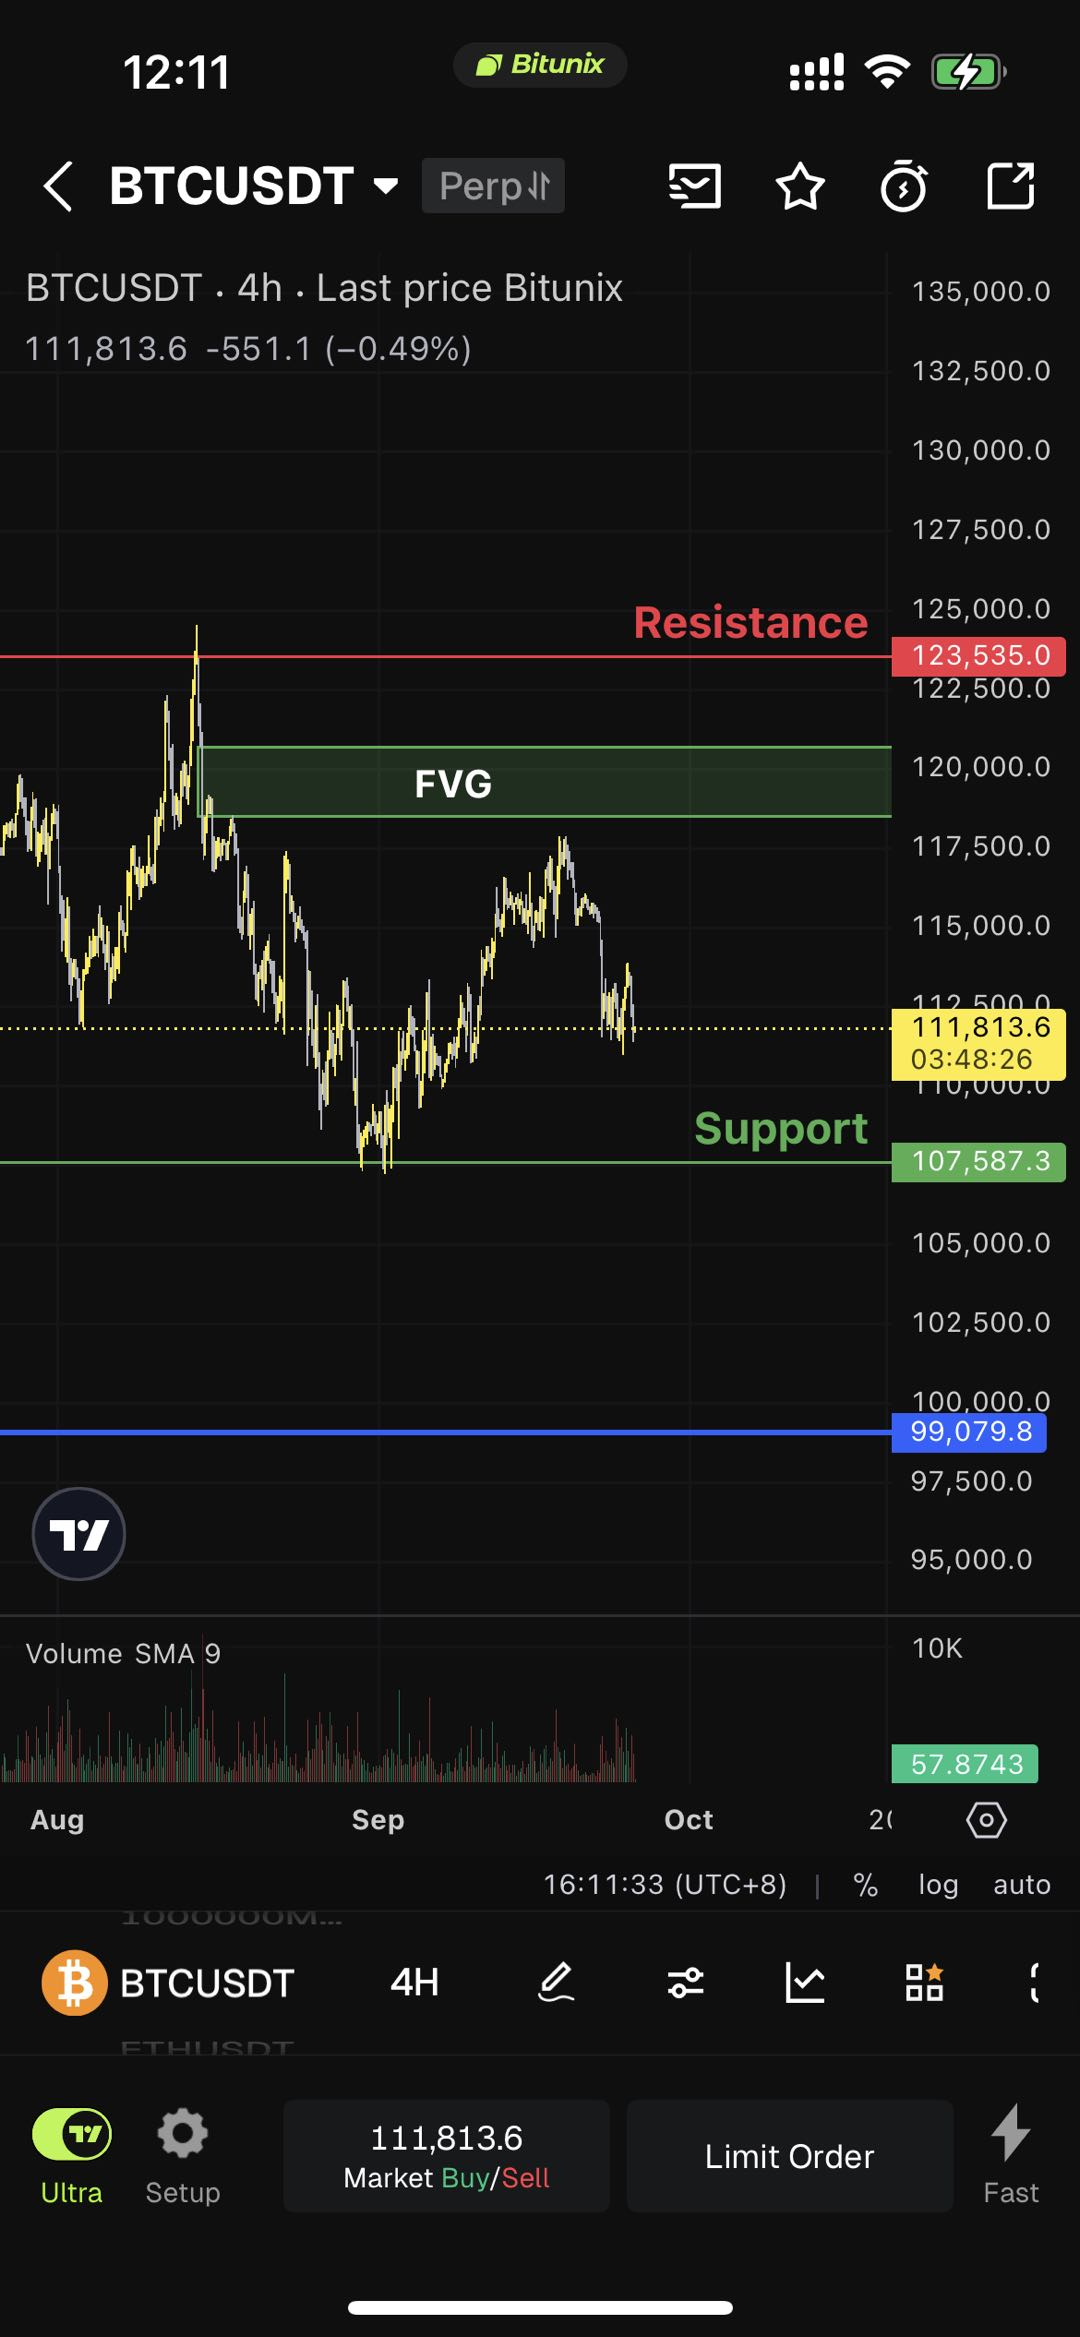
Step 4: Data synchronization in App Professional Edition
Considering the problem of mobile data consumption caused by real-time synchronization, in the first stage, we only pull data from the cloud database into the App every time the App is first launched. If cloud data is updated at other end points after the App is launched, the App will no longer update the cloud data in real-time. (For example, if I open the App and draw on the PC, the App will not display the newly drawn content in real-time. Only when the App is restarted will the latest drawn content be displayed.)
FAQs
- If I open the chart interface for drawing on both PC and mobile, how do I save the drawing record?
- When users are drawing on both PC and mobile devices at the same time, there may be a problem of dual-end writing to the same cloud cache. In this case, we take the last person to save as the standard, that is, whoever wrote last will have their record saved in the database. Therefore, to avoid the problem of dual-end writing, it is recommended to use only one end point for drawing saving operations at the same time.
- Will the content I drew or the settings I made to the chart be saved when I am not logged in?
- No, all operations performed on the chart while not logged in are in temporary memory state and will not be saved locally.
- If I set up a chart, will it be automatically saved?
- It will be automatically saved, with a minimum saving interval of 3 seconds. If the user does not manually save the content set within 3 seconds and refresh the page, the chart will only record the status of the last saved chart and be restored.
- Why can't I see the multi-chart layout content set on the website in the App Professional Edition?
- Currently, the multi-screen chart layout synchronization function is not available on the App side. Currently, only the chart layout records under a single window are synchronized.
Disclaimer
This article is not intended to provide:
(i) investment advice or recommendations;
(ii) an offer or solicitation to buy, sell, or hold digital assets; or
(iii) financial, accounting, legal, or tax advice.
Digital assets, including stablecoins and NFTs, are highly volatile and involve significant risk. Please carefully consider your financial situation and risk tolerance before trading or holding digital assets.
Consult your independent legal, tax, or investment professional to ensure that your actions comply with applicable local laws and regulations.